10 Charts for the Month of May
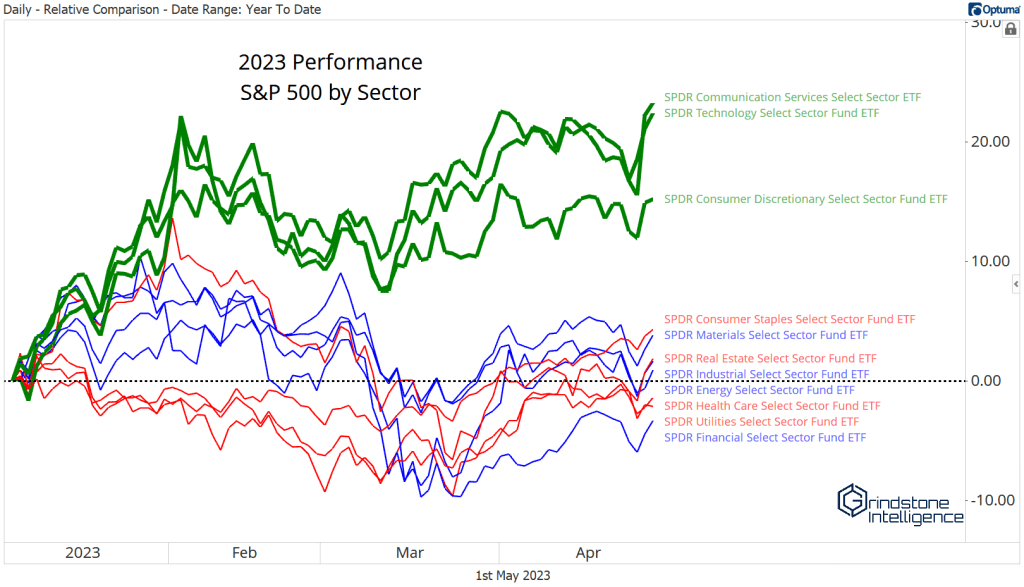
1. Growth Sectors Continue to Outperform
In the bear market of 2022, growth sectors led on the downside. The tech-laden NASDAQ dropped 33%, far more than the declines seen for value-oriented groups . Things are different now. Big tech is pacing gains in 2023.
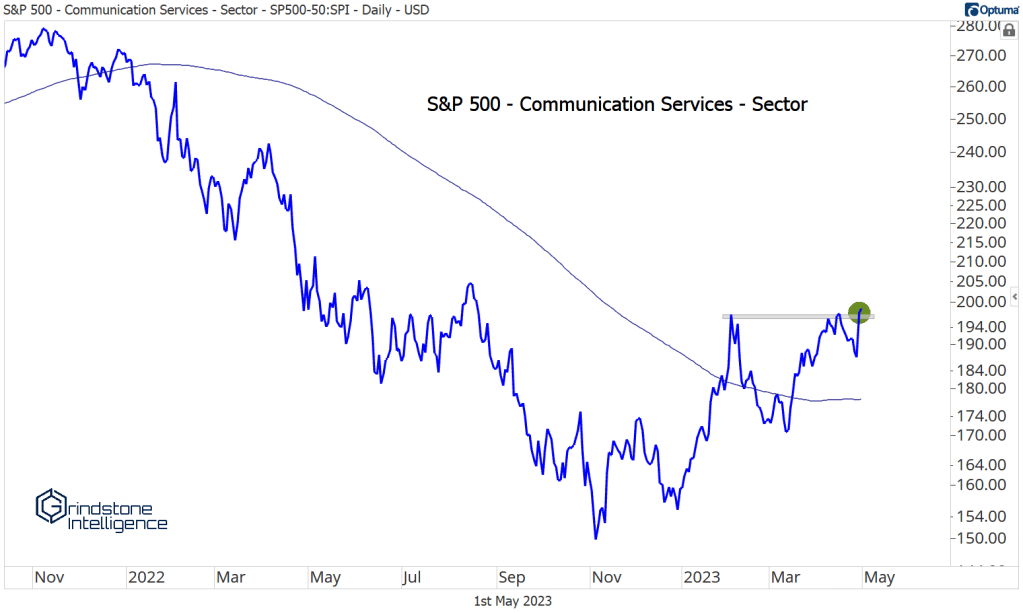
2. Communication Services is Leading the Way
The Communication Services sector has rallied 23% through the first four months of 2023, thanks in large part to a 92% year-to-date gain for Meta Platforms. Communications ended last week at its highest level since last August.
3. Mean Reversion Ahead?
After the equal weight S&P 500 steadily outperformed the cap-weighted index in 2022, we’ve seen a sharp relative selloff over the last month and a half. The ratio broke down to new 52-week lows last Thursday. Momentum, though, is putting in a potential bullish divergence. That could set the stage for a mean reversion rally in favor of the equally weighted index.
4. Interest Rates Going Nowhere Fast
The ICE BofA MOVE Index, which tracks fixed income market volatility, touched its highest level since 2008 during March, and remains elevated relative to historical norms. Despite that, 10-year Treasury yields are virtually unchanged over 1-month and 3-month timeframes.
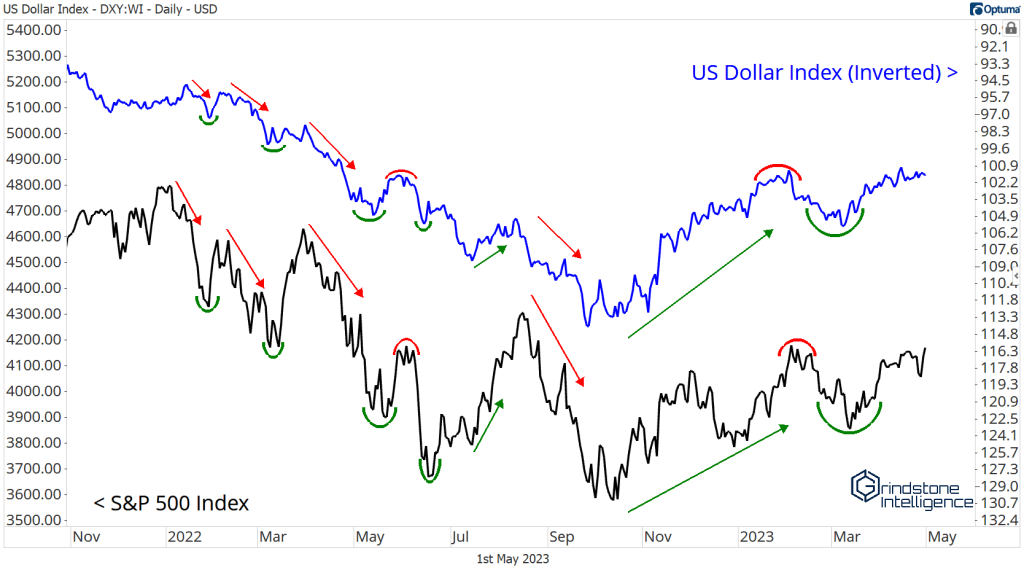
5 and 6. Stocks Are Still Highly Correlated with Currencies
All throughout 2022, the US Dollar was in the driver’s seat. Each time the Dollar Index touched a new high, stock prices fell to new lows. That negative correlation is still very much alive – except those Dollar headwinds have turned into tailwinds. The DXY is at its lowest level since last April.
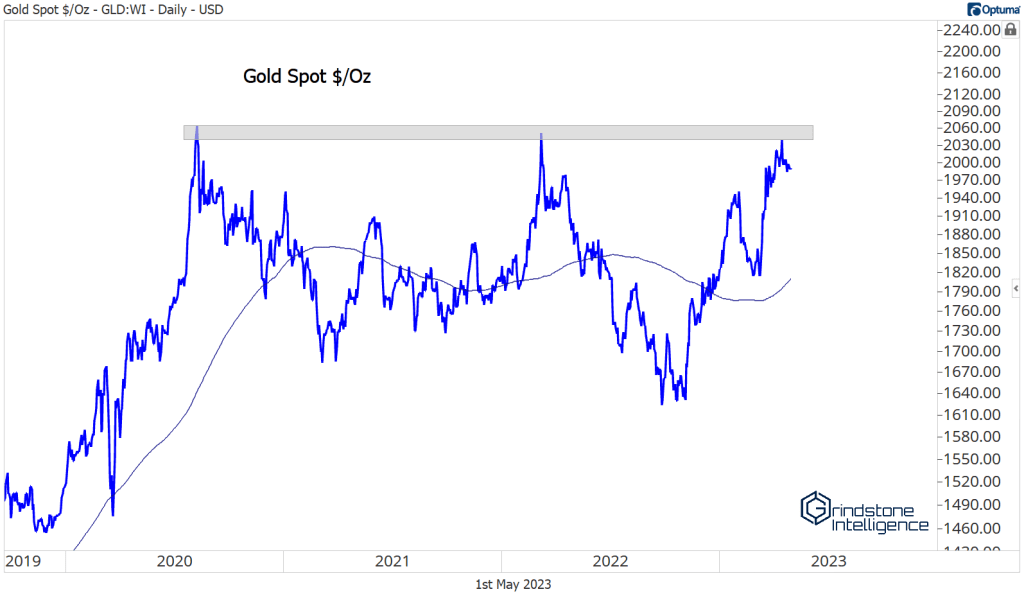
7. Gold Prices Approaching All-Time Highs
Precious metals are off to a strong start in 2023, led by an 8% rally in gold. That puts the yellow metal just 3% from all-time high prices, which were set in August 2020. A breakout from this range could spark a move to 3170.
8. Bitcoin Rejected at 30,000
Bitcoin has been one of the best places to invest in 2023, with a year-to-date gain of more than 70%. It’s still stuck below last summer’s key breakdown level, though, after briefly surpassing it in April. A sustained move above 30,000 would go a long way toward convincing us that the intermediate-term trend has changed.
9 and 10. The Fed’s decision is getting harder
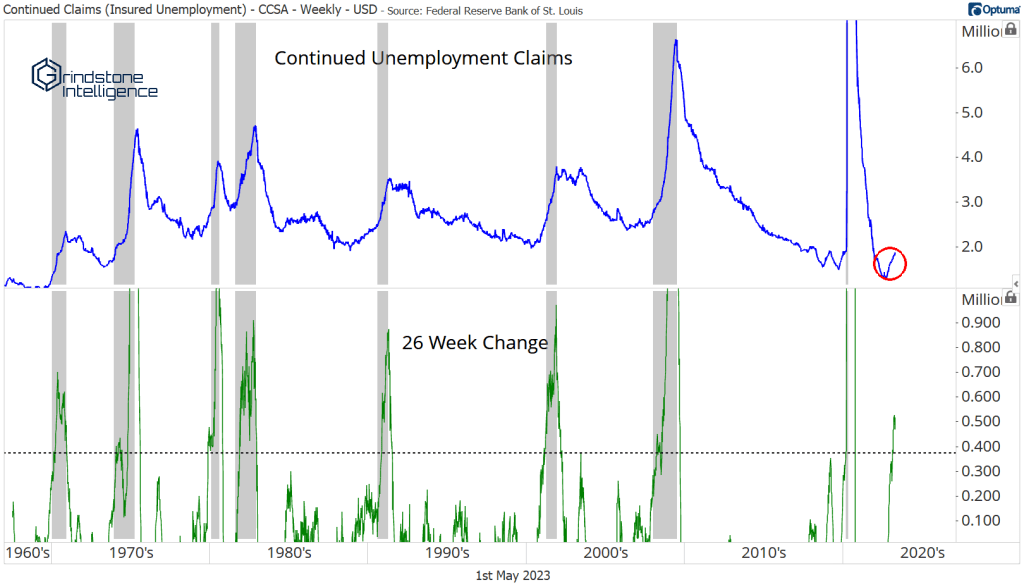
Inflation is still too high. Year-over-year growth in CPI has declined for 9 consecutive months, but that decline is largely attributable to normalization of goods prices. Core services prices are still near 40-year highs. Meanwhile, the labor market is starting to show signs of weakness. The number of continuing jobless claims remains quite low, but the 6-month change is cause for concern. We’ve never seen claims increase at this pace outside of a recession. The Fed has to weigh the risk of pushing the economy into a downturn against the risk of letting inflation remain higher for longer.
The post 10 Charts for the Month of May first appeared on Grindstone Intelligence.


