2020 Preview: Valuation
In my last post, I reviewed the 2019 performance and 2020 expectations for S&P 500 earnings. The previous year’s no-growth EPS environment stands in stark contrast to the outstanding rally equities have turned in over the last 12 months. The result is a market whose valuation has returned to a cycle high.
Here’s the forward price-to-earnings ratio of the S&P 500 going back to 1990.

The current forward multiple of nearly 18.3x matches the late 2017 peak – well above the average for the decade and more expensive than at any time during the housing era expansion. Still, we’re far from the peak ratio of the late 1990s. Keep in mind that the S&P 500 was already being described as ‘irrationally exuberant’ when the forward multiple first reached 18x in June 1997. Then the index tacked on another 70%.
Much like during the dotcom era, the latest market rise has been fueled by the Information Technology sector. Tech currently trades at 21.8x its forward earnings estimates, a whopping 43% above its own average multiple over this cycle. By comparison, the broad S&P 500 index is trading at a 22% premium to itself, while the Energy sector (whose average is admittedly distorted thanks to outlier multiples of over 100x following the oil collapse of 2014-2016) offers a relative discount.
Compared to average valuations over the longer-term, Tech still trades at a hefty price. But the most notable valuation premiums are found in areas traditionally described as counter-cyclical. At 18.6x forward earnings, the Utilities sector trades at a 33% premium to its long-term average of 14x, and Consumer Staples trade at similar premium of 25%. Meanwhile, seemingly more reasonable multiples are found in the Energy and Health Care sectors.
With a better understanding of where valuation has been, we can start to frame some expectations for the coming year. I haven’t even gotten used to the idea of 2019 being in the past, but as of January 1, 12-month forward EPS include estimates for 2021 data. That means any discussion of year-end S&P 500 levels derived from a forward multiple is based on earnings reports that we won’t get for more than 2 years. It’s hard enough for analysts to predict the next quarter, let alone the next 8, so it pays to take consensus estimates with a grain of salt. Still, we need to start somewhere.
Per Bloomberg, the consensus estimate for 2021 EPS is $198. Should the market maintain it’s current multiple, that translates to a roughly 9% return for calendar 2020. Now for the salt. Consensus estimates are habitually too optimistic. Macroeconomic strategist Ed Yardeni has charted this phenomenon with his “squiggles” chart.
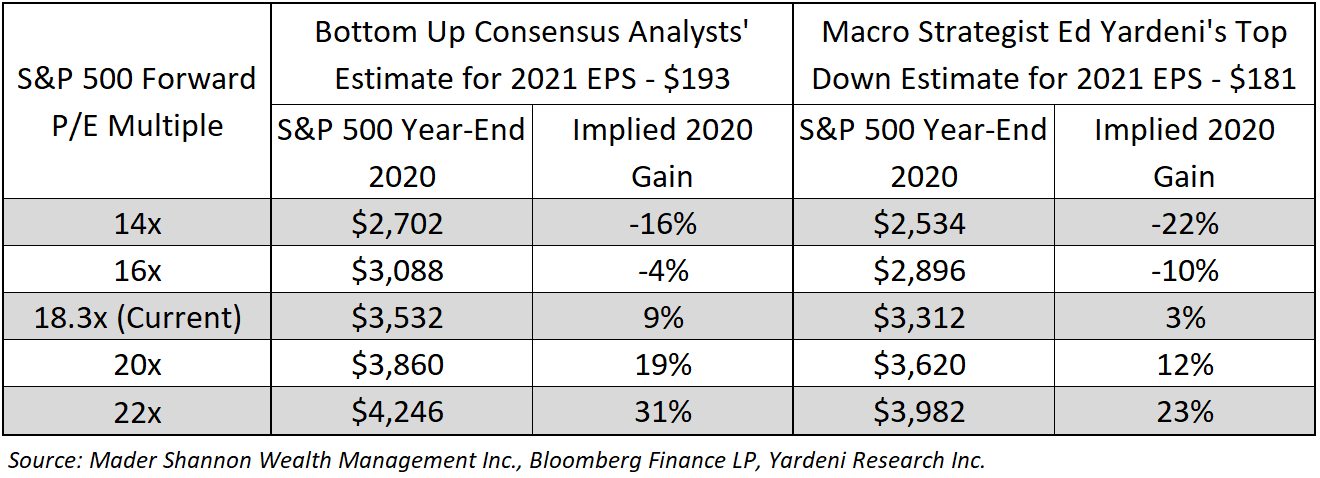
The blue squiggles represent the consensus analysts’ earnings per share estimates for any given calendar year. With few exceptions, initial projections are simply too high, and analysts are forced to revise their estimates lower. Given that backdrop, Dr. Ed anticipates 2020 and 2021 earnings per share will be closer to $172 and $181, respectively – roughly half the growth currently expected by the Street. Here’s how the S&P 500 would look for each of the two scenarios.

Assuming the consensus estimate of $193 is on the money, maintaining the current multiple would be enough for equities to turn in another above-average year.
On the other hand, if analysts stay true to form and Yardeni’s outlook proves more accurate, sustaining a multiple of 18.3x would disappoint investors. Only further multiple expansion would help equities replicate their 2019 returns, but a multiple compression back to the average would result in a year of negative performance for equities.
The post 2020 Preview: Valuation first appeared on Grindstone Intelligence.


