A Broad Look at Market Breadth
Stocks are surging to start the year, leading many to believe the bear market lows are in. This week, we’re taking a broad look at market internals to gauge the health of this advance.
The reason we watch breadth is pretty simple: the more stocks that participate in a trend, the stronger that trend is. A handful of large stocks can drive cap-weighted index prices higher (or lower) by themselves. Sometimes they can do it for longer than people expect. But they can’t do it forever. Monitoring stock market participation is one way to monitor the durability of a trend.
The cumulative advance-decline line might be the most well-known of breadth indicators. Its calculation is fairly simple: an index is created by cumulatively adding or subtracting the net of rising vs. falling issues for each trading day. If a greater number of stocks are rising than falling, the advance-decline line rises, and vice versa. No indicator is infallible, but the NYSE Advance-Decline line has reliably diverged from prices before several major stock market selloffs. Its track record is less reliable during bear market recoveries, but that’s not a reason to ignore the A/D line entirely – it can still offer useful information.
Right now, the A/D line for the NYSE is at its highest level since last August, and it’s broken the downtrend line from the 2021 highs. At the very least, that’s evidence of the downtrend in advances weakening.
Similarly, the A/D line for the NASDAQ Composite is at multi-month highs and just below the lows from last spring. For A/D lines like this, we don’t view prior lows or highs as areas of support or resistance, per se. This isn’t a tradable index, so there’s little reason to treat it as such. But conceptually, it makes sense that if this line recovers above those former turning points, breadth must be stronger than it was back then.
Advancers are outpacing decliners, as evidenced above. And that’s led to more stocks being in uptrends. Among the simplest ways to define whether something is generally rising or falling is to compare it to a moving average price – a stock higher than its average price over the preceding 200 days can be assumed to be trending higher, and vice versa. Today, two-thirds of issues in the S&P 500 are above their 200-day moving average, the highest number in over a year.
Even more stocks are in uptrends on a 100-day timeframe. Almost 80% of S&P 500 companies are above their 100-day average, and that’s the most in 18 months. From a long-term perspective, breadth is sending pretty clear bullish signals.
In the shorter-term, the signals are a bit more concerning. Three-quarter of stocks in the index are above their 50-day moving average – a healthy number when taken on its own. But that number isn’t as strong as it was in late 2022, or even a few weeks ago. In other words, while long-term trends are improving, the breadth of this January rally is thinning out.
We can see exactly where the trouble is. Only 18% of Consumer Staples stocks are above their 50DMA, and only 40% of Utilities are. Rather than lift all stocks, the rally from the lows has pulled money out of traditional safe havens, in favor of risk-on assets. It’s generally a good thing for risky sectors to outperform – that’s evidence of risk appetite and indicative of higher prices – but we’re not so sure how to feel about outright declines in prices for these other sectors. During bull markets, all groups of stocks tend to move higher, even if they do so at different speeds.
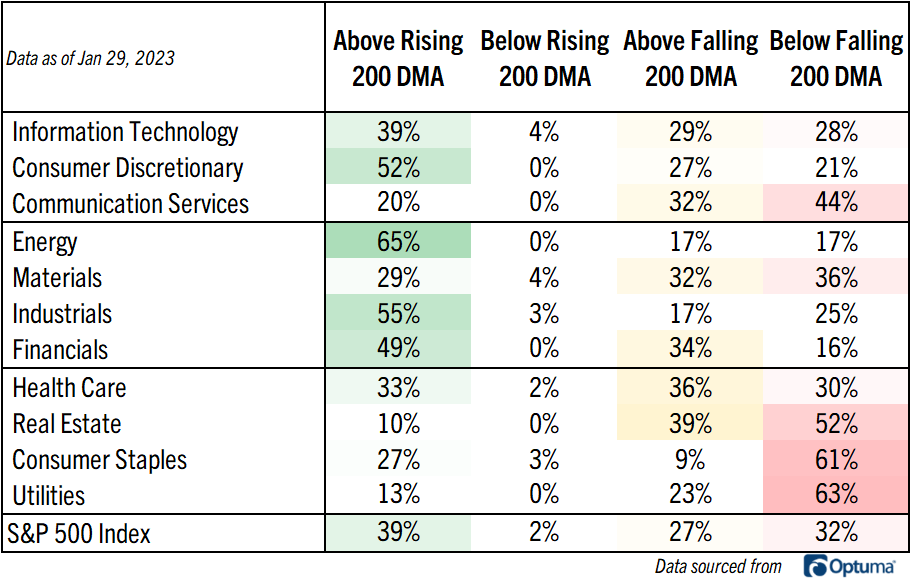
With that in the back of our minds, we can take moving average breadth a step further. We like looking at both the price in relation to its average and the slope of the moving average. It gives us an even clearer picture. A stock whose price is above a rising moving average cannot be in a downtrend, and vice versa – a stock whose price is below a falling moving average cannot be in an uptrend.
A full 48% of Consumer Staples stocks are in undeniable downtrends on a 50-day timeframe. The performance by Utilities doesn’t look quite as dark as it did before, though. 87% of Utilities stocks have a rising 50-day average price.
That same analysis on a long-term basis reminds us that stocks aren’t out of the woods quite yet. Almost 40% of stocks are in clear long-term uptrends, the highest we’ve seen in quite awhile. However, 32% of stocks are still in clear downtrends, and more than half still need to reverse a falling average price. The weakness in risk-off sectors is most pronounced.
On the other hand, trends are turning more bullish by the day in the old value-focused sectors: Industrials, Financials, and Energy. Consumer Discretionary is healthy, too.
Can those risk-on groups continue to rally while safety stocks stall? The chart below will be the one to tell us. During bull markets, prices set new highs. There’s nothing profound or controversial about that. So far, though, the number of stocks setting new 52-week highs is muted.
Until we see a material expansion, it’ll be premature to call an official end to the bear market that rocked stocks in 2022.
Nothing in this post or on this site is intended as a recommendation or an offer to buy or sell securities. Posts are meant for informational and entertainment purposes only. See Terms for more information.
The post A Broad Look at Market Breadth first appeared on Grindstone Intelligence.


