April Market Outlook
The bull market continues
At the outset of every month, we take a top-down look at the US equity markets and ask ourselves: Do we want to own more stocks or fewer? Should we be erring toward buying or selling?
That question sets the stage for everything else we're doing. If our big picture view says that stocks are trending higher, we're going to be focusing our attention on favorable setups in the sectors that are most apt to lead us higher. We won't waste time looking for short ideas - those are less likely to work when markets are trending higher. We still monitor the risks and conditions that would invalidate our thesis, but in clear uptrends, the market is innocent until proven guilty. One or two bearish signals can't keep us on the sidelines.
That’s still the type of environment we’re in today.
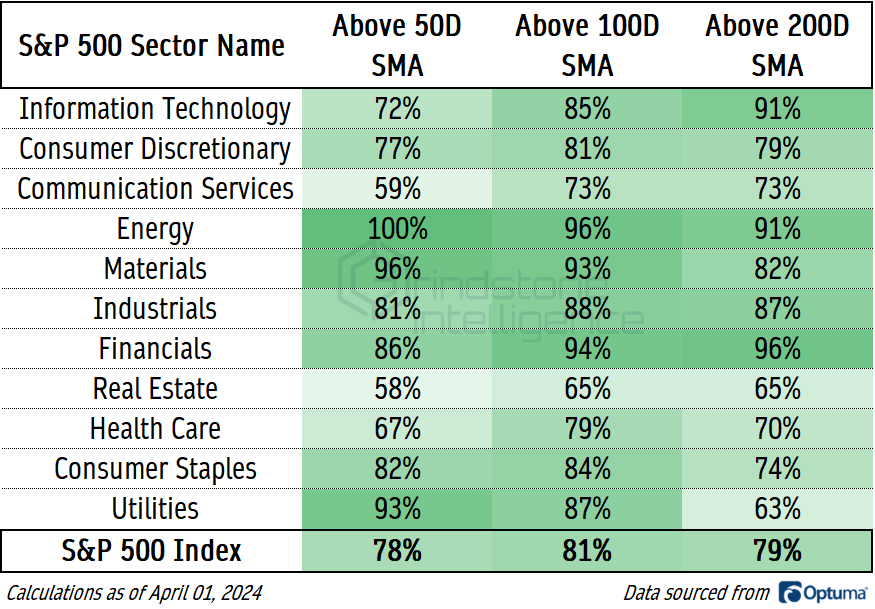
Bearish signals are getting harder and harder to find. The pessimists used to have breadth they could point to. For a large part of 2023, market leadership was narrow, and large swaths of the market just weren’t participating in the rally. All we’ve seen so far in 2024 is a broadening. Roughly 80% of stocks in the S&P 500 are above their 50, 100, and 200-day moving averages. And in every single sector, at least half of the constituents are.
The small caps have long been a point of contention, too. Despite being the first area of the market to find a bottom back in 2022, the Russell 2000 had been notably absent from the bull market. Until now. Just last week, the Russell 2000 hit its highest level in 2 years.
What else has there been to complain about? For awhile it was the lack of new highs. In each the S&P 500, the NYSE, and the NASDAQ, the list of stocks setting new 52-week highs peaked in December. But the list of new lows never rose in January and February, even on a short-term basis, and that kept us from getting overly concerned about market health. Over the last few weeks, we’ve seen a re-expansion in the number of new highs.
Nine of the 11 S&P 500 sectors have set a new 6-month high within the last week.
Here’s a more in-depth way to look at it. We can look at whether a stock has more recently broken out or broken down and determine whether that stock is in a cycle of setting new highs or new lows. About 80% of S&P 500 constituents are in new 3 and 6-month high cycles. Two-thirds are in new 52-week high cycles.
The areas of weakness above are quite obvious. Less than half of the stocks in the Real Estate, Consumer Staples, and Utilities sectors are setting new 52-week highs. But should that really bother us too much? Apple by itself has a higher weight in the S&P 500 index than the entire Real Estate and Utilities sectors combined. The Consumer Staples aren’t that much bigger. And all three tend to do better in risk-off periods, not the risk-on periods that drive markets higher.
Moreover, even the weakest areas of the market aren’t doing all that poorly. With commercial real estate falling apart, it seems to us that the regional banking industry will likely be at the center of any potential economic turbulence. Yet even when New York Community Bank was grabbing headlines and seeking capital infusions earlier this year, the banks as a whole were holding up. Last week, the industry hit a new 52-week high.
Without someone to lead us to the downside, the bigger question we have is how much higher prices can go. Stocks have logged back-to-back quarters of 10% gains, something that hasn’t been done in over a decade. Since the inception of the S&P 500 in 1950, it’s never been able to stretch that streak to 3. And the Dow Jones Industrial Average, which has been around a lot longer, hasn’t strung together 3 consecutive quarters of double-digit gains in over 100 years.
Does that mean stock prices have to fall from here? Of course not. But it’s unlikely that we’ll repeat the performance of the past 6 months.
We’ve been watching a potential resistance area for the S&P 500 up here near 5300, which is the 261.8% retracement from the 2020 decline. A year ago, we were watching the 161.8% retracement from that same decline as the trigger for declaring a new bull market in stocks. If the S&P 500 was above 4100, how could we not be buying stocks? Prices respected that 4100 level on the way up and on the way down during the October ‘22 retest, so we won’t be surprised if the next Fibonacci level up here at 5300 gets the same type of respect.
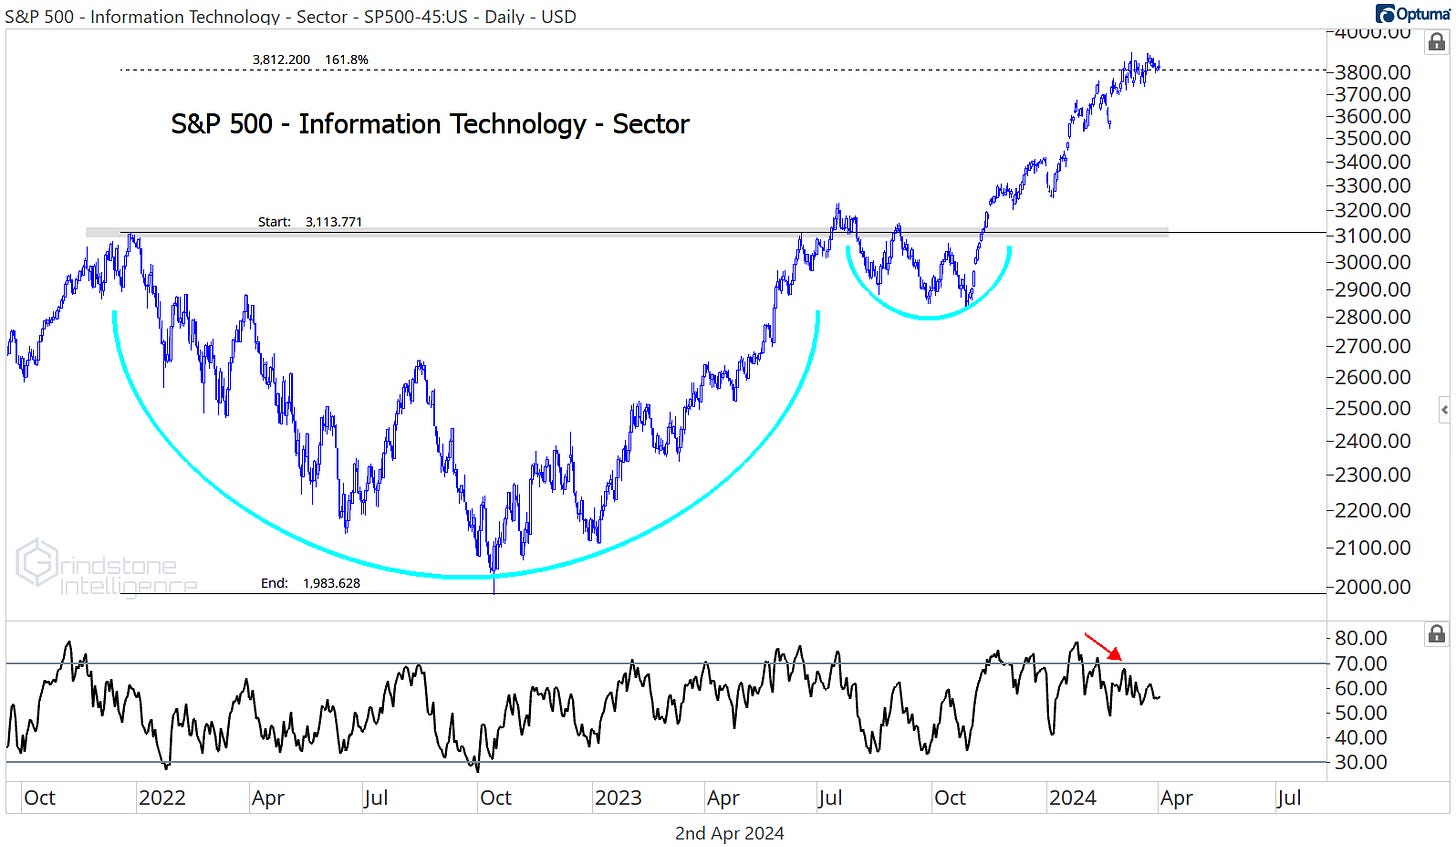
Especially with the largest and most important sector in the market running into a logical area of resistance of its own. The strongest trends don’t care about resistance or potential bearish momentum divergences like the one we’ve got shaping up here, but it would make a lot of sense to see Information Technology continue to stall out and digest the huge gains we’ve had since October.
What’s the bull case for the S&P 500 to keep moving higher even as Tech continues to consolidate?
Continued rotation.
Other areas of the market have stepped in and taken leadership positions. The Financials just broke out.
So did Energy.
And the Industrials just keep chugging along.
All three of those sectors are value-oriented (as opposed to the growth-oriented Information Technology and Communication Services sectors that led the market throughout 2023). And value is working hard to turn the breakout below into a failed move.
If the ratio of the Russell 1000 Growth Index relative to the Russell 1000 Value Index breaks back below the 2020-2021 highs, we could be sitting here in 9 months talking about how it was the bankers and manufacturers - not the AI stocks - that dominated the market in 2024.
Whether it’s growth or value stocks leading us higher, though, this is a bull market until proven otherwise.
What’s the proof we’re looking for to invalidate our thesis? Where could things still go wrong?
For one, we’re wary of the return of a few familiar foes. All throughout 2022 and 2023, it seemed the US Dollar and interest rates were driving the boat. Every time the Dollar rallied, stocks were under pressure. And when the Dollar relented, equities moved higher.
The correlation between stocks and the Dollar index has died down over the past several months, but we think that stays true only if the DXY remains rangebound. It’s been stuck between 100 and 105, and as long as that’s the case, we think it can be safely ignored. On a move above 105, the story changes.
A resurgence in interest rates is worth watching, too. The stock market set its ‘22 and ‘23 lows at the same time that 30-year Treasury rates were peaking. Lower rates have been good news for stocks, but higher rates are a problem.
If the Dollar is above 105 and 30-year yields are breaking above 4.5%, then we can start talking more about downside risks for equities. Right now, that’s not the case.
Fortunately, the stock market isn’t the only place to make money. Gold just broke out to new all-time highs.
Until next time.


