Breadth isn’t bad. It just isn’t good. And that’s okay.
Last week I shared the chart below on Twitter and noted how the number of 52 week highs has declined on each successive rally this year. Fewer and fewer stocks are leading the way higher. That’s not a great omen as US indexes continue to challenge key resistance levels that have been in place for 8 months.
Does that mean a return to the bear market lows is imminent? Should we be selling all the stocks we own? What does a deterioration in new highs really say about breadth, anyway?
When we talk about ‘breadth’ in the market, we’re talking about the number of stocks participating in a trend. The more stocks that participate, the healthier a trend is and the more likely it is to last. A lack of bullish breadth – like what we’re seeing in the list of new highs – warns of a weak uptrend.
Does that really surprise anyone?
We already knew the uptrend was weak. You could argue stocks aren’t in an uptrend at all. This area between 4100 and 4200 has been the line in the sand for months, and we’re still below it. Should it surprise anyone that the list of new highs isn’t expanding, when the benchmark index isn’t moving higher either? It would be more surprising if the list of new highs was expanding.
The good news is, downside breadth isn’t very strong either. The list of new 52 week lows peaked last June and continues to set lower highs on market selloffs. That’s certainly not bearish.
We can draw similar conclusions from the NYSE Advance-Decline Line, which is also setting lower highs. If the A/D line was setting higher highs, that would be a sign of underlying strength within the market. But if the indexes aren’t setting higher highs, why should we expect the A/D line to? It would be more surprising if it were.
At the same time, we aren’t seeing the A/D line set new lows, either. Sure, we can be disappointed in a lack of bullish breadth signals. But why not take heart in the lack of bearish breadth signals at the same time?
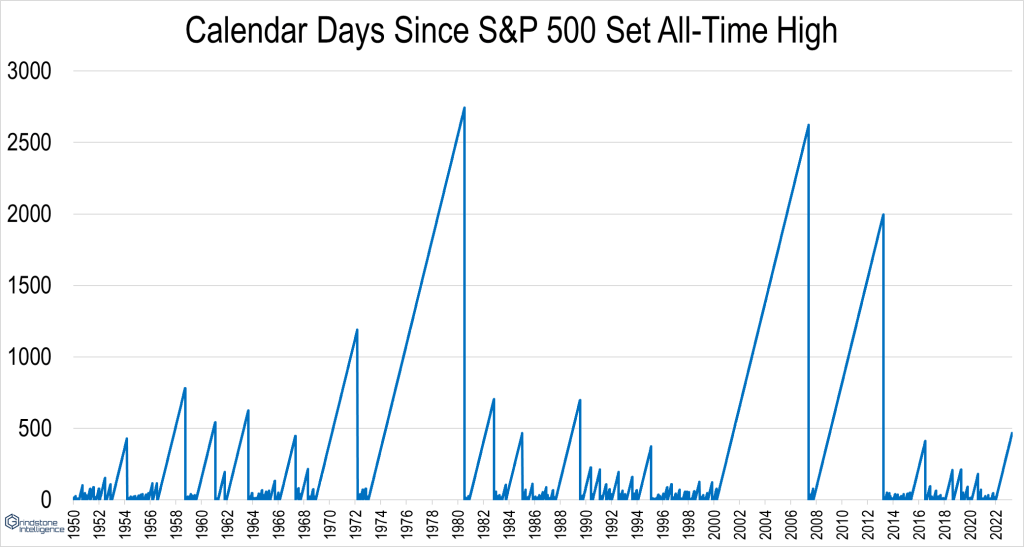
We’ve grown so used to sharp, V-shaped recoveries in stock prices over the last decade that it’s easy to grow frustrated with a market that doesn’t show continual improvement. It’s been more than a year since the S&P 500 last set an all-time high, the longest stretch since stocks surpassed their 2007 highs. But it’s normal for bear markets to last for extended periods. We endured longer stretches, in the ’50s, ’60s, ’70s, and ’80s, let alone the bear markets of the ’00s.
It takes TIME to repair structurally broken trends. And even in the absence of an expansion in new highs, structural improvement is exactly what we’re seeing beneath the surface.
One of the easiest ways to classify the trend of a stock is by comparing its current price to the level and trend of its long-term moving average. Today, 49% of S&P 500 constituents are above a rising 200-day moving average. In other words, almost half of the index is in an uptrend. What’s more, risk-on sectors like Information Technology, Industrials, and Consumer Discretionary are showing the most strength.
Still, 30% of the index is stuck in a structural downtrend. That’s not something you see in bull markets.
No, we aren’t out of the woods. Breadth still isn’t good. But it’s better than it was. And there’s nothing wrong with that.
The post Breadth isn’t bad. It just isn’t good. And that’s okay. first appeared on Grindstone Intelligence.


