Breadth Stinks
Domestic large-cap stock indexes continue to rise – the S&P 500, Dow Jones Industrials, and Nasdaq all reached new highs earlier this week. Their strength masks a lack of progress made by the majority of stocks over the last few months. In other words, breadth stinks.
The concept of breadth is pretty simple: the more stocks that participate in a trend, the stronger that trend is. A handful of large stocks can drive cap-weighted index prices higher by themselves. Sometimes they can do it for longer than most people expect. But they can’t do it forever. Monitoring stock market participation is one way to monitor the health of a trend.
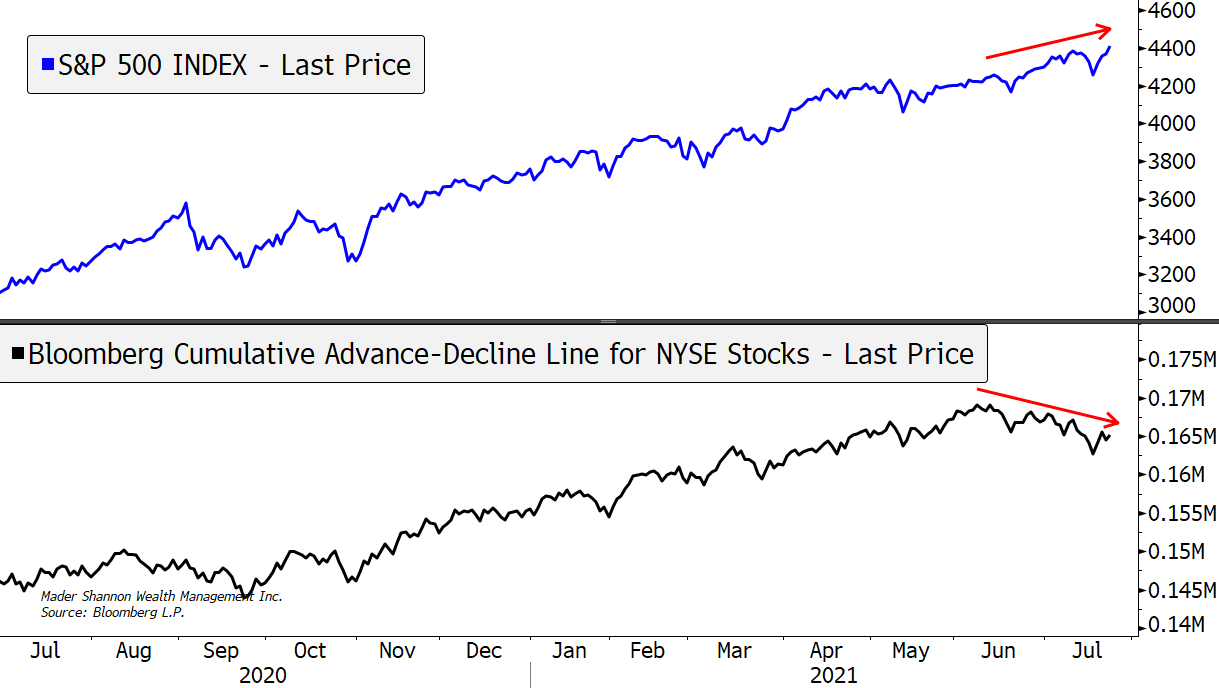
The cumulative advance-decline line might be the most well-known of breadth indicators. Its calculation is fairly simple: an index is created by cumulatively adding or subtracting the net of rising vs. falling issues for each trading day. If a greater number of stocks are rising than falling, the advance-decline line rises, and vice versa. No indicator is infallible, but the NYSE Advance-Decline line has diverged from prices before several major stock market selloffs. It’s sending a cautionary signal now, falling over the last 2 months while the S&P 500 has continued to rise.
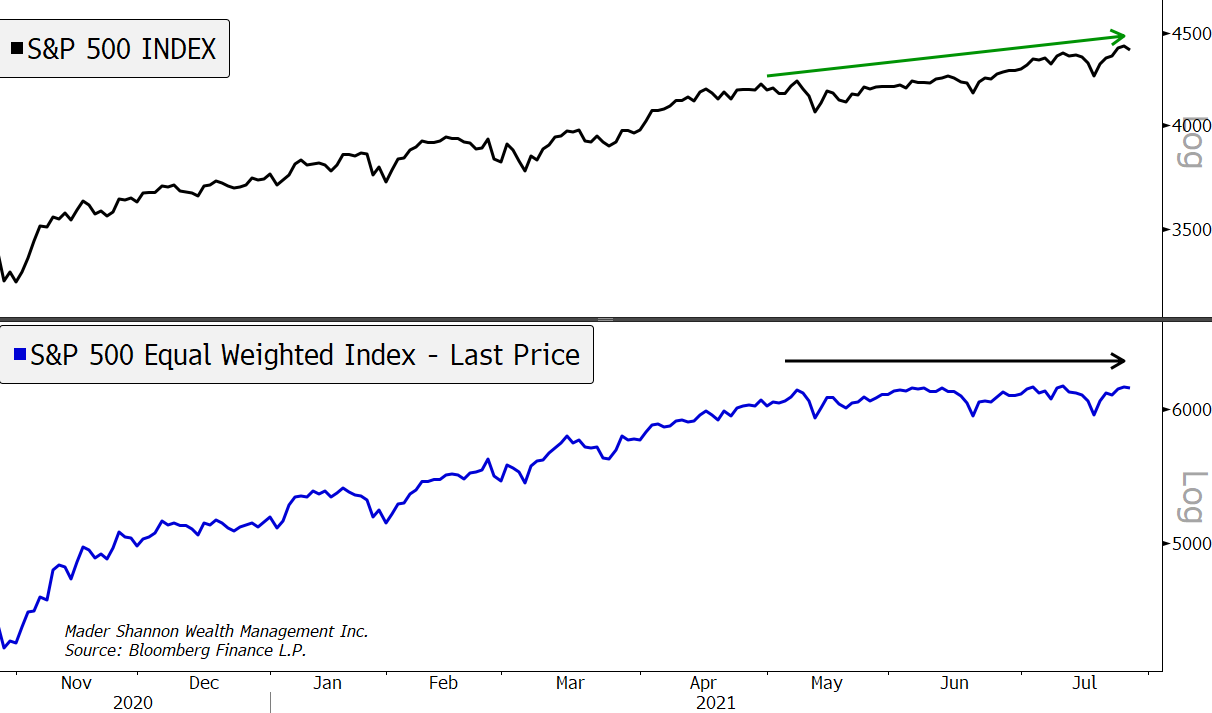
Equal-weight stock indexes confirm a lack of participation. The S&P 500 is a market capitalization-weighted indexes – the largest companies have the largest weight. Giving each stock the same level of importance, regardless of size, results in an index that’s been flat since May.
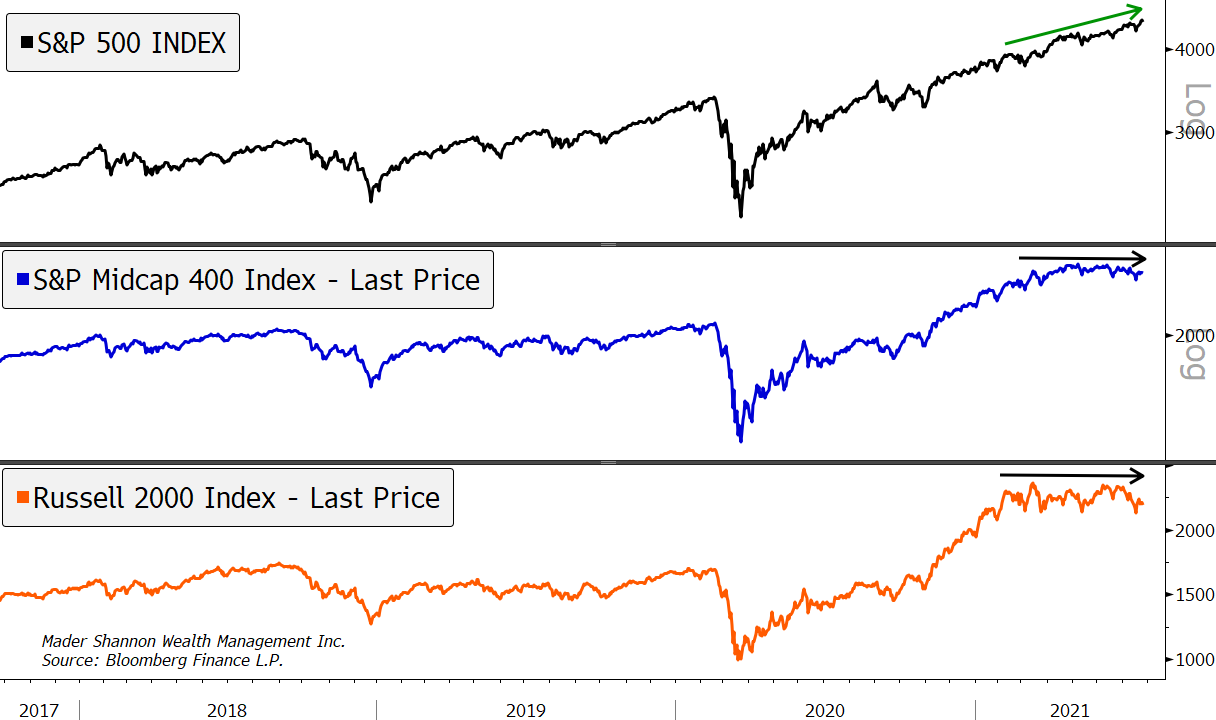
Small and Mid-cap stocks aren’t playing along either. The Russell 2000 peaked in March. Mid caps did so in April.
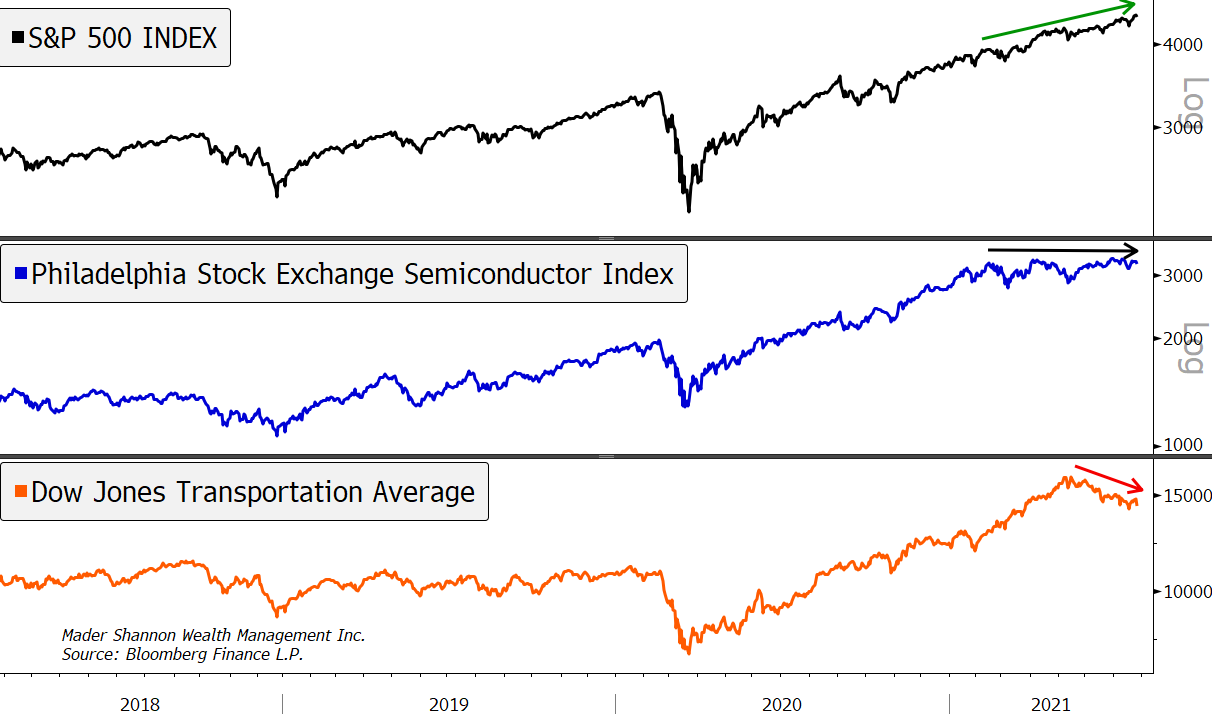
One of Dow Theory’s most popular tenants is that Transports should confirm higher prices in stocks, but they haven’t. They’ve been falling for a few months. Some argue that the world has changed – Railroad and Trucking companies don’t have the same importance in a digital world. Perhaps they’re right. But Semiconductors, the industry most commonly substituted for Transports in a so-called “New Dow Theory”, have been flat since February. In either case, new highs for the headline indices are still waiting for a thumbs-up from Mr. Dow.
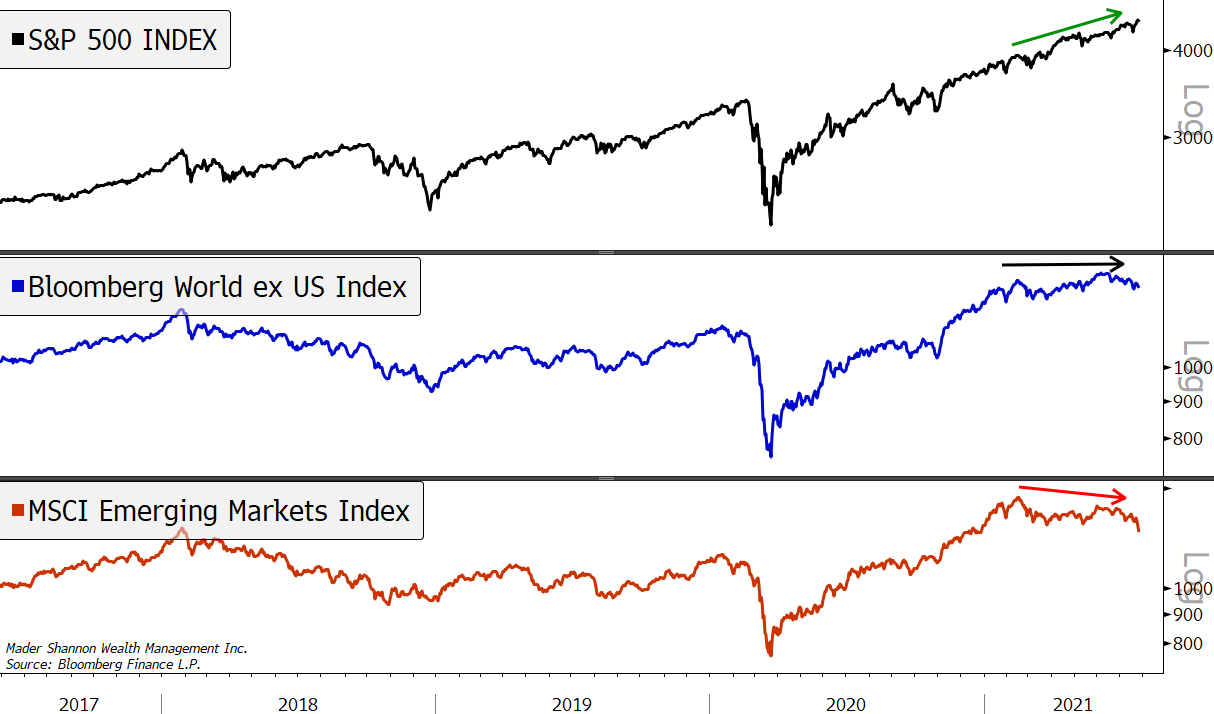
It may look like I’m just pasting the same chart over and over again, but I’m not. International stocks are struggling to set new highs, too. Emerging Markets have been especially weak, and just broke to six month lows.
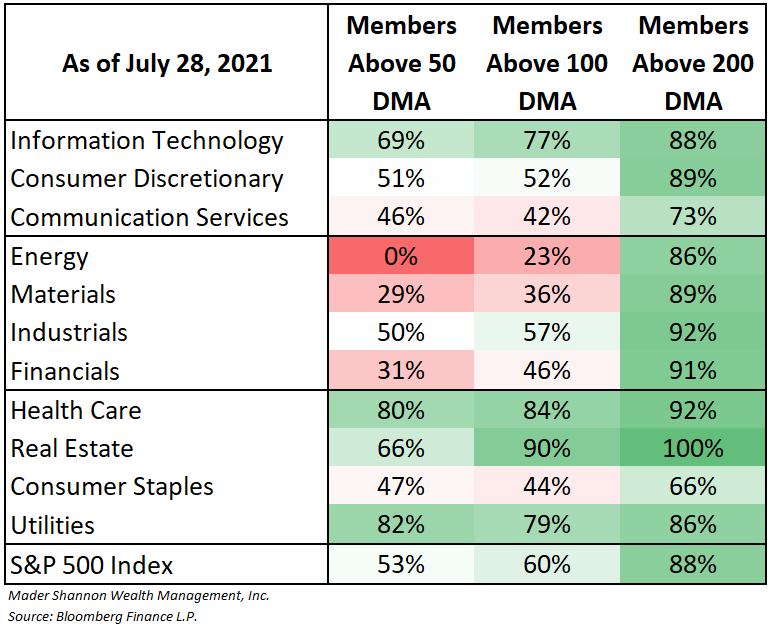
Beneath the surface of the S&P 500’s new highs lies Turmoil. Sixty percent of industries have lagged the index over the last 3 months, and individual stocks are struggling to maintain their uptrends. Only half of the 500 are hanging above their 50-day moving average, with offensive sectors struggling the most.
Breadth over the last few months just hasn’t been good, and in the past, weak breadth has often led to corrections and even bear markets. That said, almost 90% of stocks are still above their long-term moving averages – they aren’t yet in downtrends, they just aren’t moving higher. If more stocks start breaking to new lows, there could be trouble, but unless that happens, we’ll leave it at this:
New all-time highs aren’t bearish, but without participation of a majority of stocks, it’ll be a lot tougher for the indexes to keep moving higher.
Nothing in this post or on this site is intended as a recommendation or an offer to buy or sell securities. Posts on Means to a Trend are meant for informational and entertainment purposes only. I or my affiliates may hold positions in securities mentioned in posts. Please see my Disclosure page for more information.
The post Breadth Stinks first appeared on Grindstone Intelligence.


