

Bull Market on Hold
Market outlook and Industrials sector deep dive

Last week we pointed out a sharp bearish momentum divergence and a failed breakout in the Consumer Discretionary sector. Our point wasn’t to say we needed to flip the script and turn bearish while the market was near new all-time highs, but to acknowledge that real damage to the trend had occurred.
One week later, the divergences are piling up.
Here’s the most important one, in the Information Technology sector. The Tech sector set new all-time highs relative to the rest of the market back on February 9th, but the 14-day RSI for the Tech/SPX ratio never managed to reach overbought territory. That failure by momentum to confirm the move presents a major headwind for Tech.
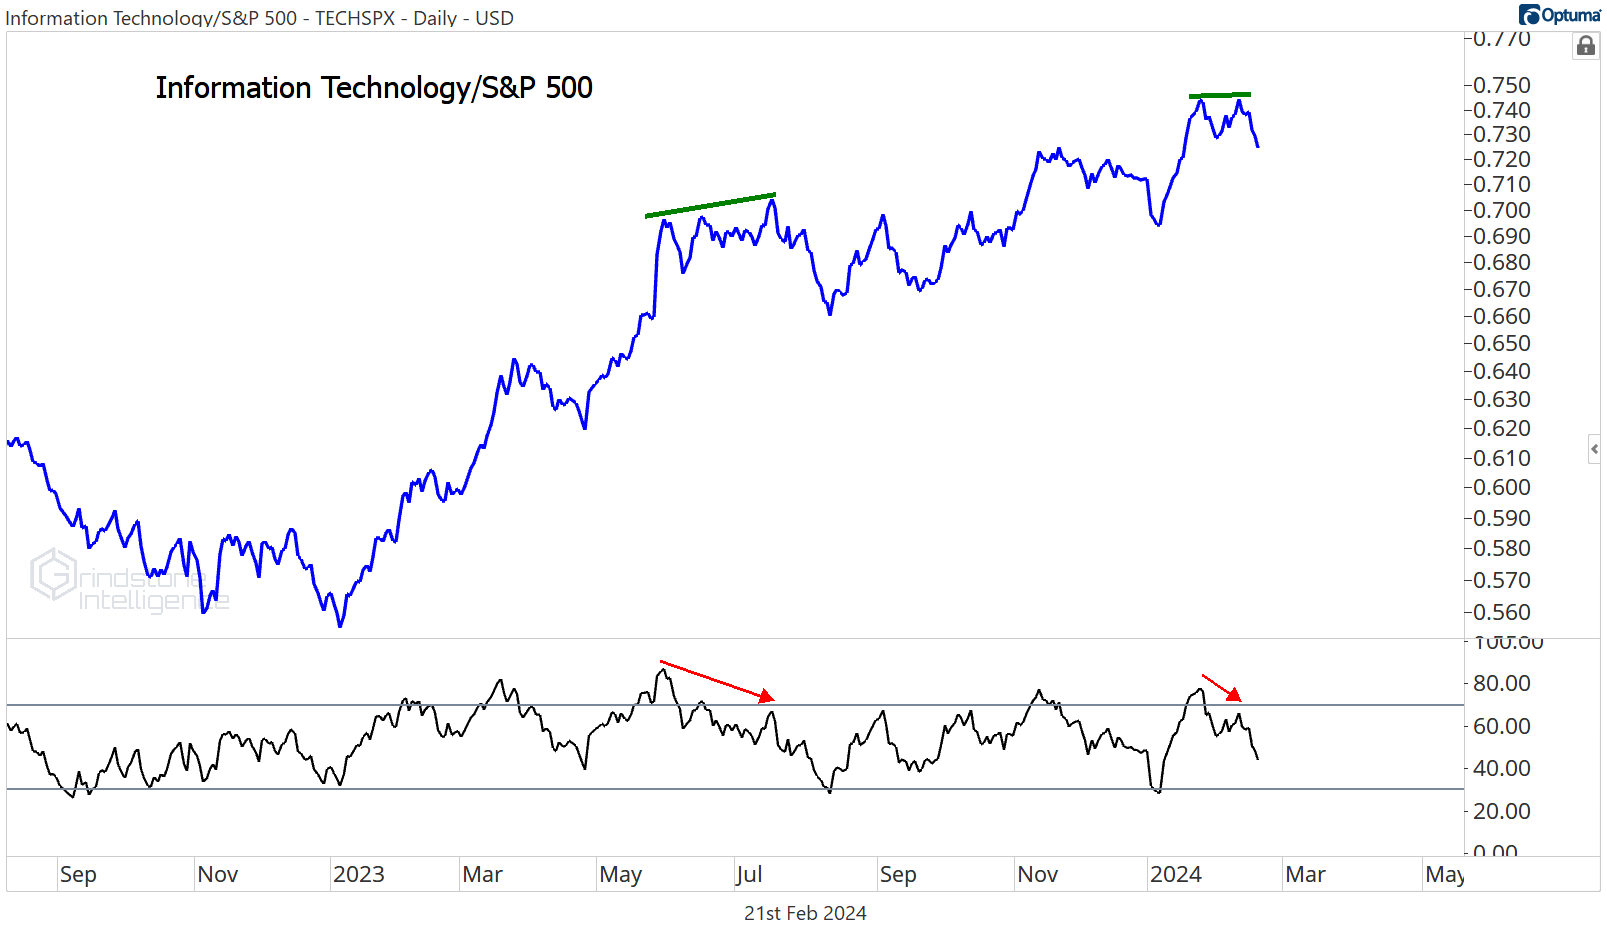
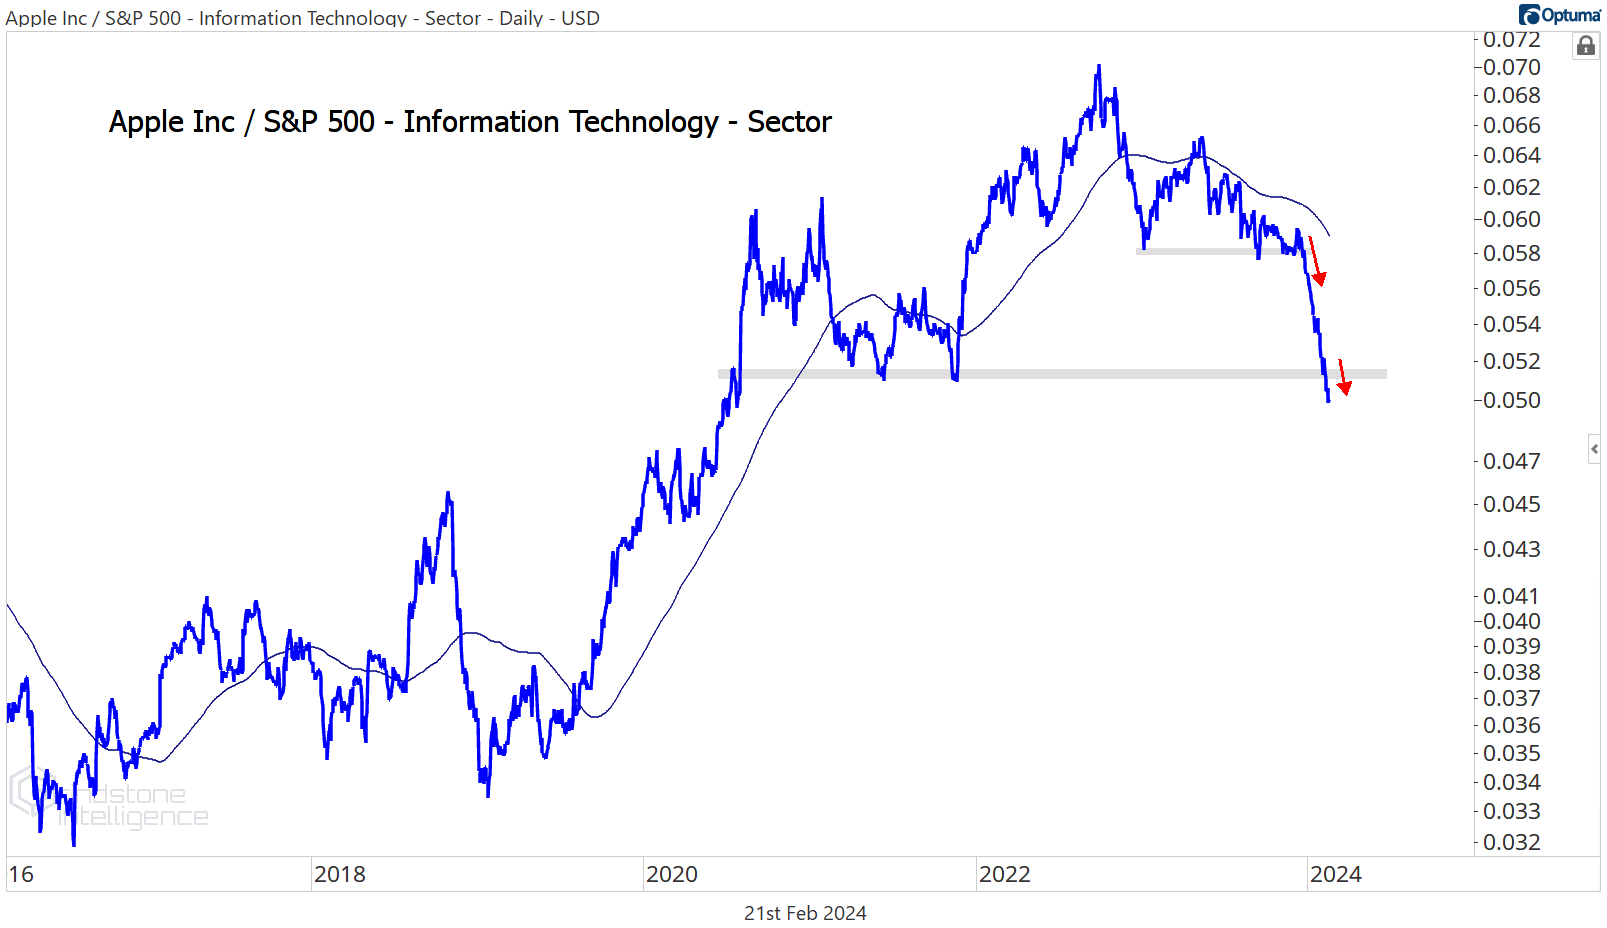
Tech makes up more than a quarter of the entire S&P 500 index, and it’s home to Apple, Microsoft, and NVIDIA, three stocks which could each lay claim to the title of ‘Most Important Stock in the World.’ Apple has a relative strength problem, something we’ve been pointing out to our subscribers for a month and a half. And it just broke to multi-year relative lows:
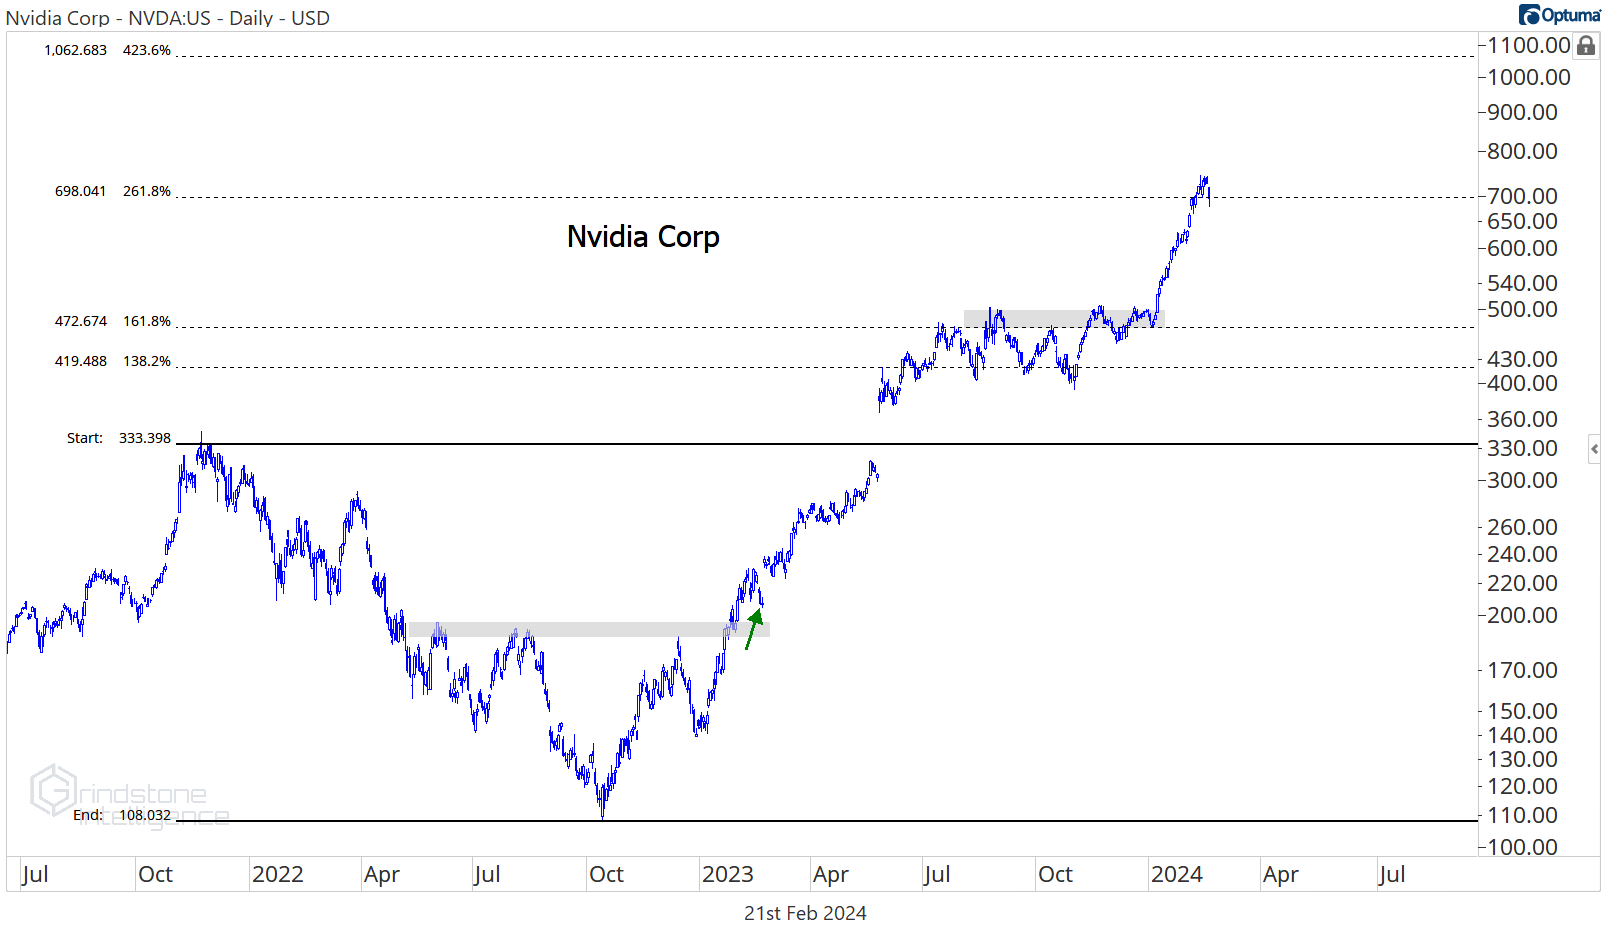
Despite Apple’s struggles, the Tech sector kept powering higher, in large part thanks to the strength in NVIDIA. But NVIDIA hit our target of $700 two weeks ago. Does that mean NVDA can’t gap 20% higher after earnings tonight? Of course not. But we have targets for a reason. It’s ok to step aside and see how the stock responds to this level.
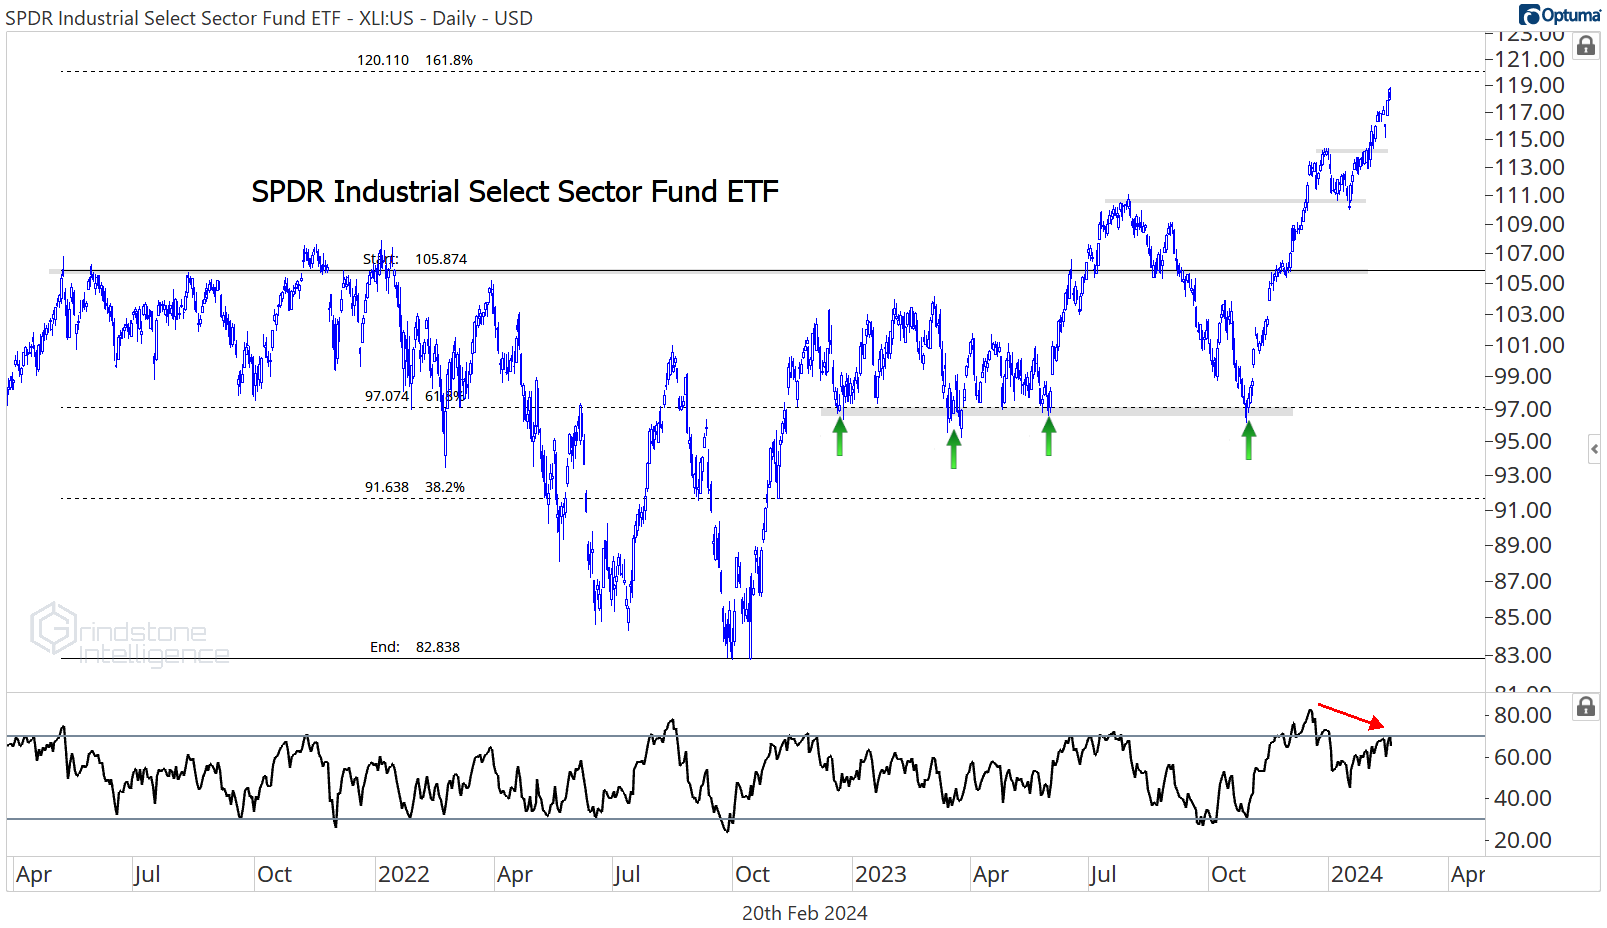
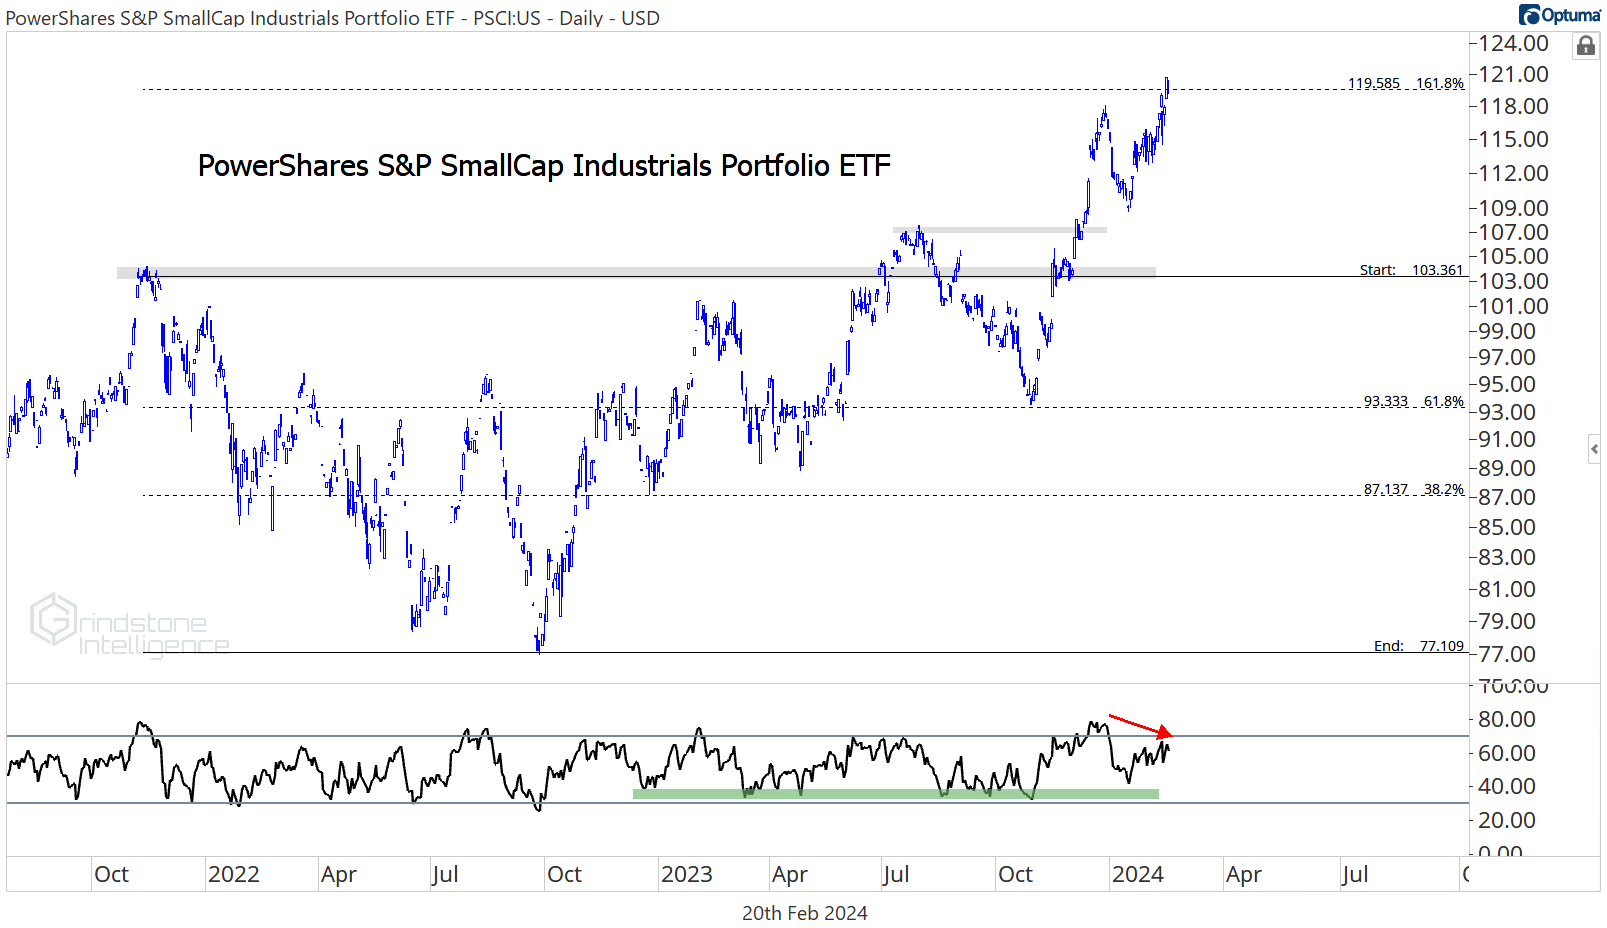
So we’ve got a big bearish momentum divergence in the Tech sector, along with some problems beneath the surface. We’ve got a similar problem in the Industrials sector. It’s finding sellers just shy of the the 161.8% retracement from the 2022 decline, and momentum has failed to reach overbought territory this year, despite the record highs.
Why are the Industrials so important? Because no sector is more highly correlated with the market overall. And because no other sector - with the exception of Tech - has been better during this bull market.
Sure, on the surface it looks as though other, more growth-oriented sectors have been preferable. But the equally weighted Industrials have gained 40% from the lows set back in October 2022, outpaced only by Tech. And on an equally weighted basis, the Industrials have outperformed Tech so far in 2024.
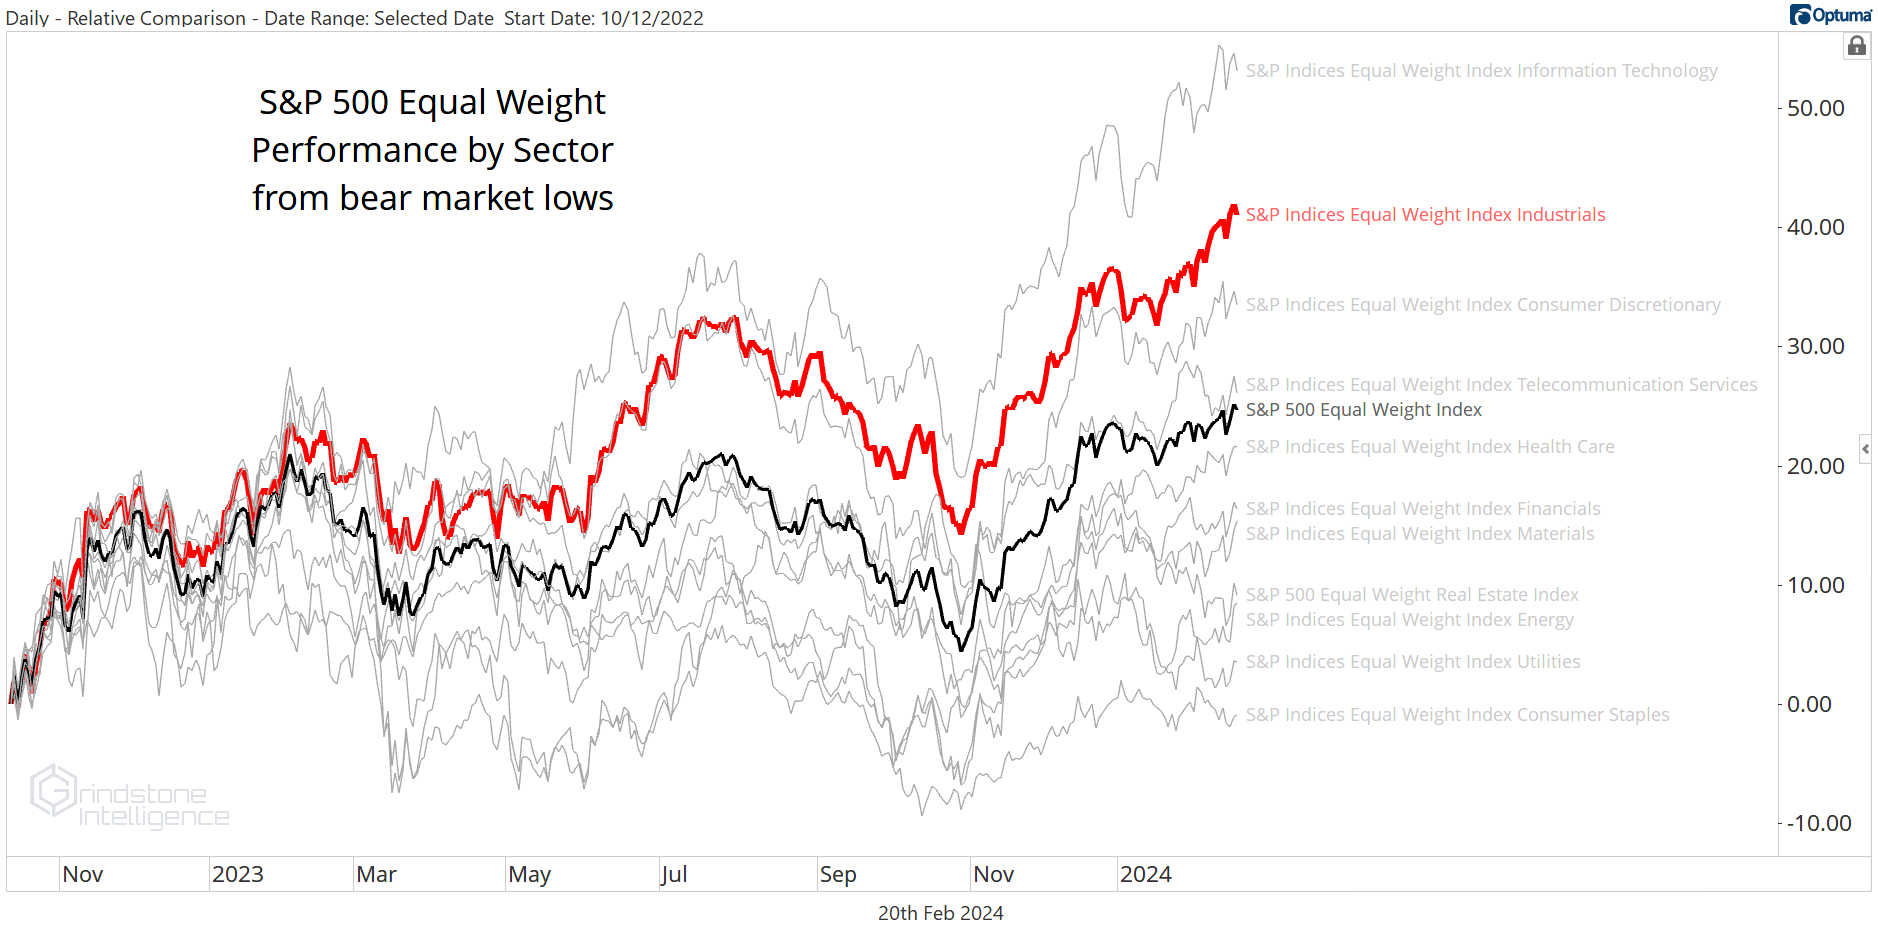
Here’s another look at how impressive the equally weighted Industrials have been over the last two years:
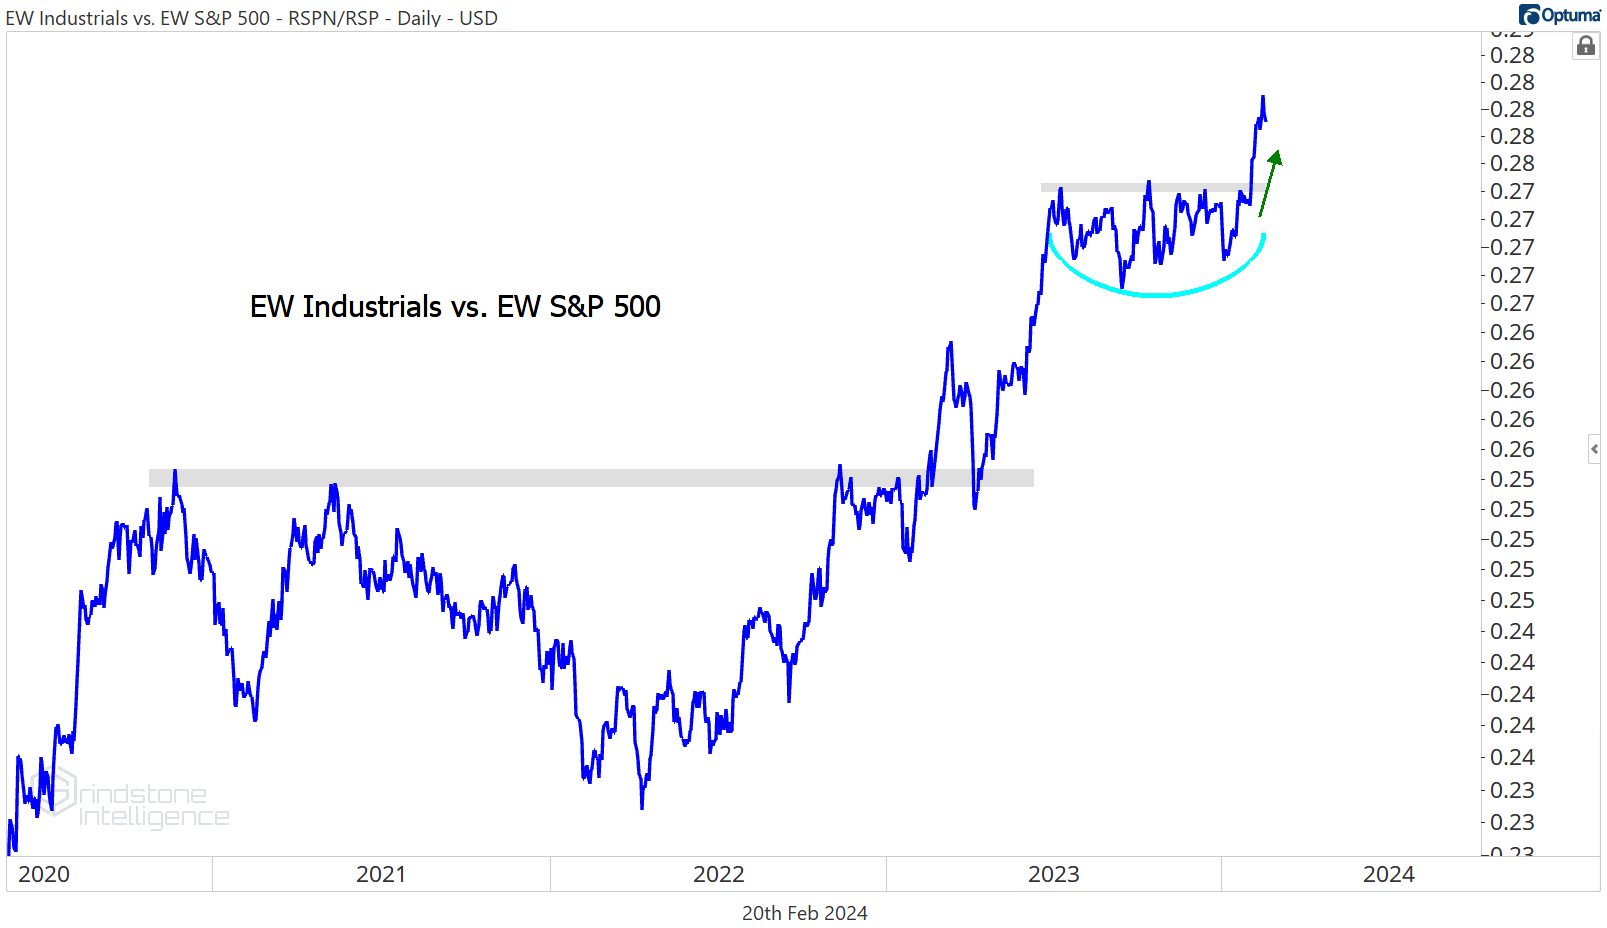
The strength is even more pronounced in the small cap space, where over the last year, the Industrials have outgained the next closest sector by 2x.
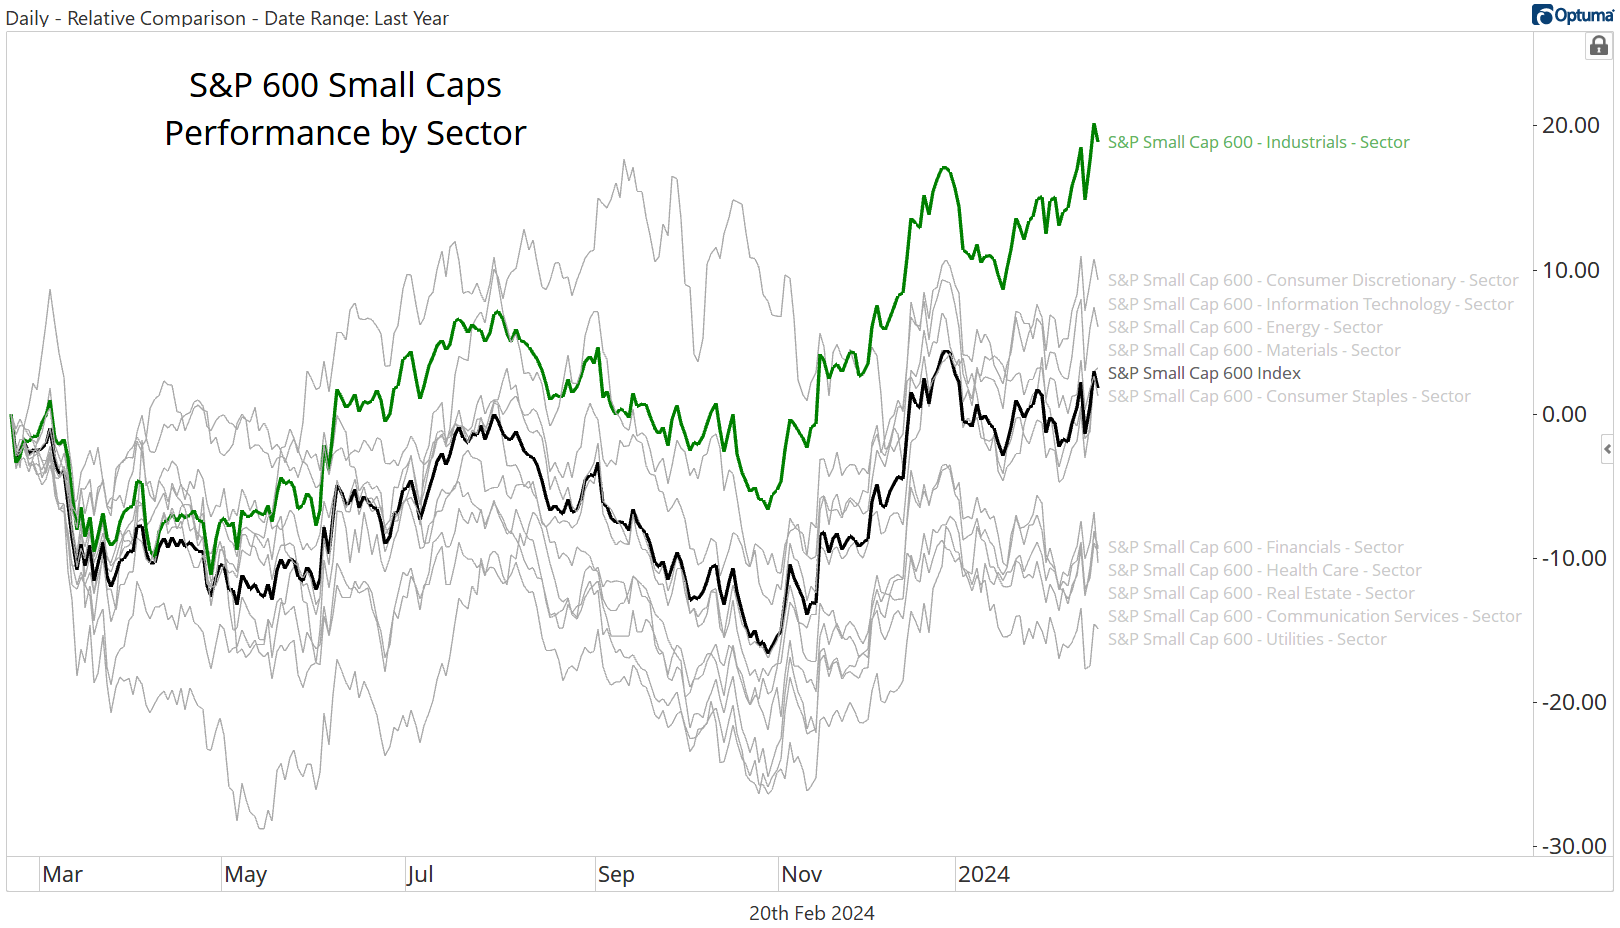
If you want to know what relative strength looks like, here it is. On the weekly Relative Rotation Graph, the small cap Industrials are oscillating between the Leading and Weakening quadrants when compared to the rest of the small caps. They’ve never even approached the Lagging quadrant.
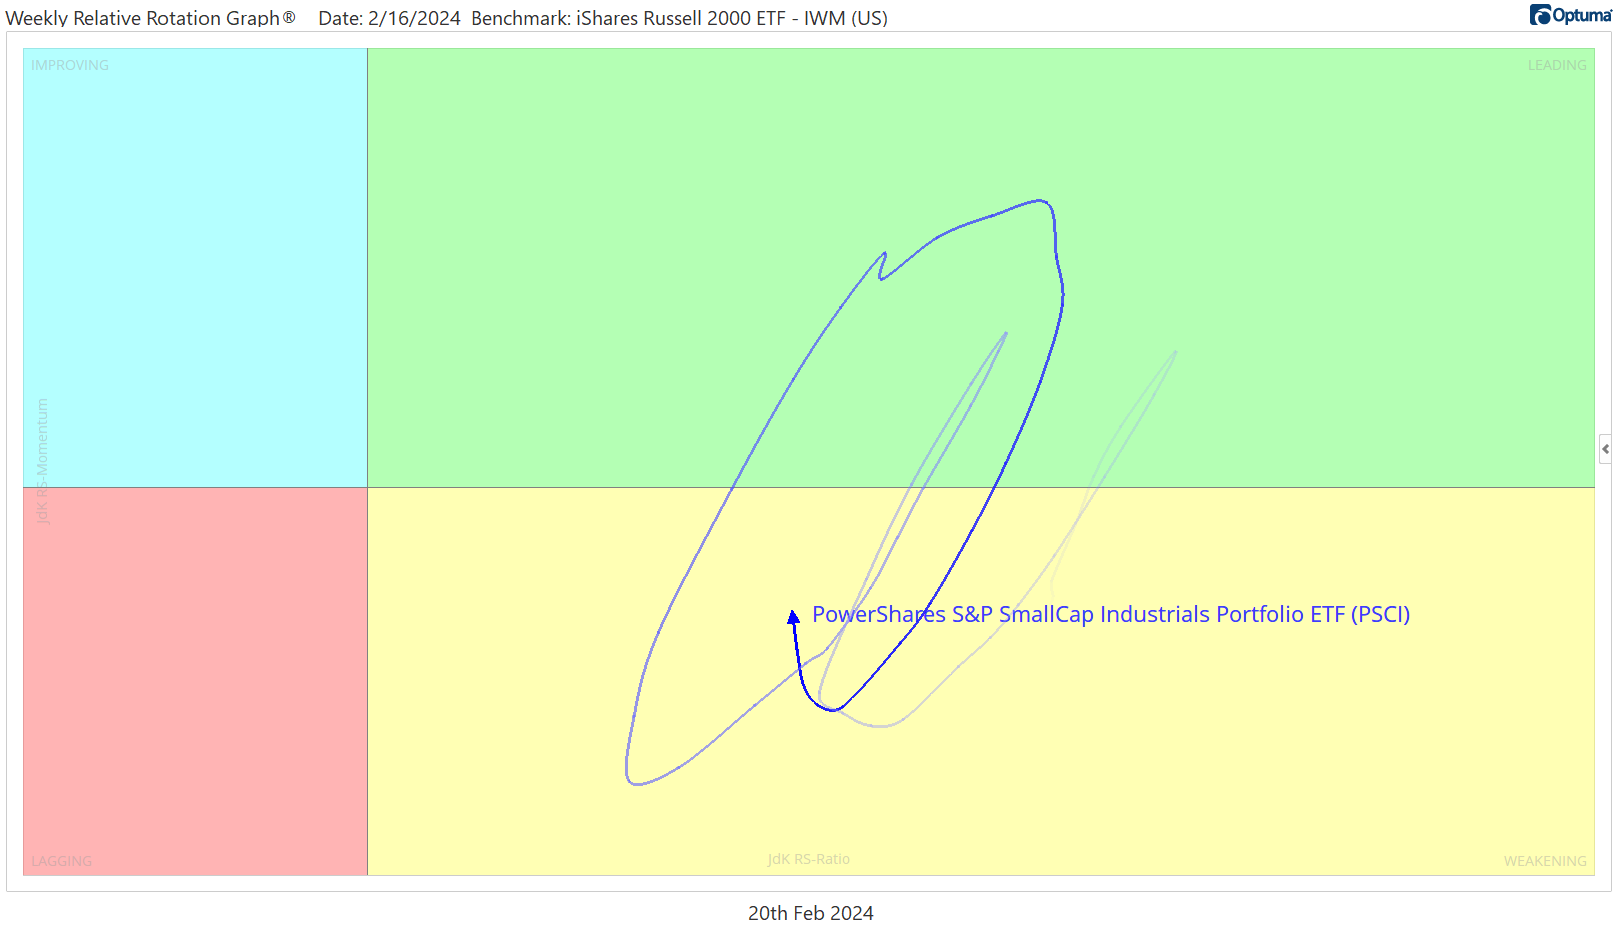
Much like NVDA, though, the small cap Industrials have reached our target, the 161.8% retracement from the 2022 decline. And momentum is putting in a bearish divergence to boot.
So what can we do about these bearish momentum divergences?
Trend damage like this generally gets repaired in one of two ways: through corrective price action or through time. A correction through time is the more bullish of the two, and that’s what we think is the most likely outcome here. But we’re not so naive as to believe that a sharp decline can’t happen.
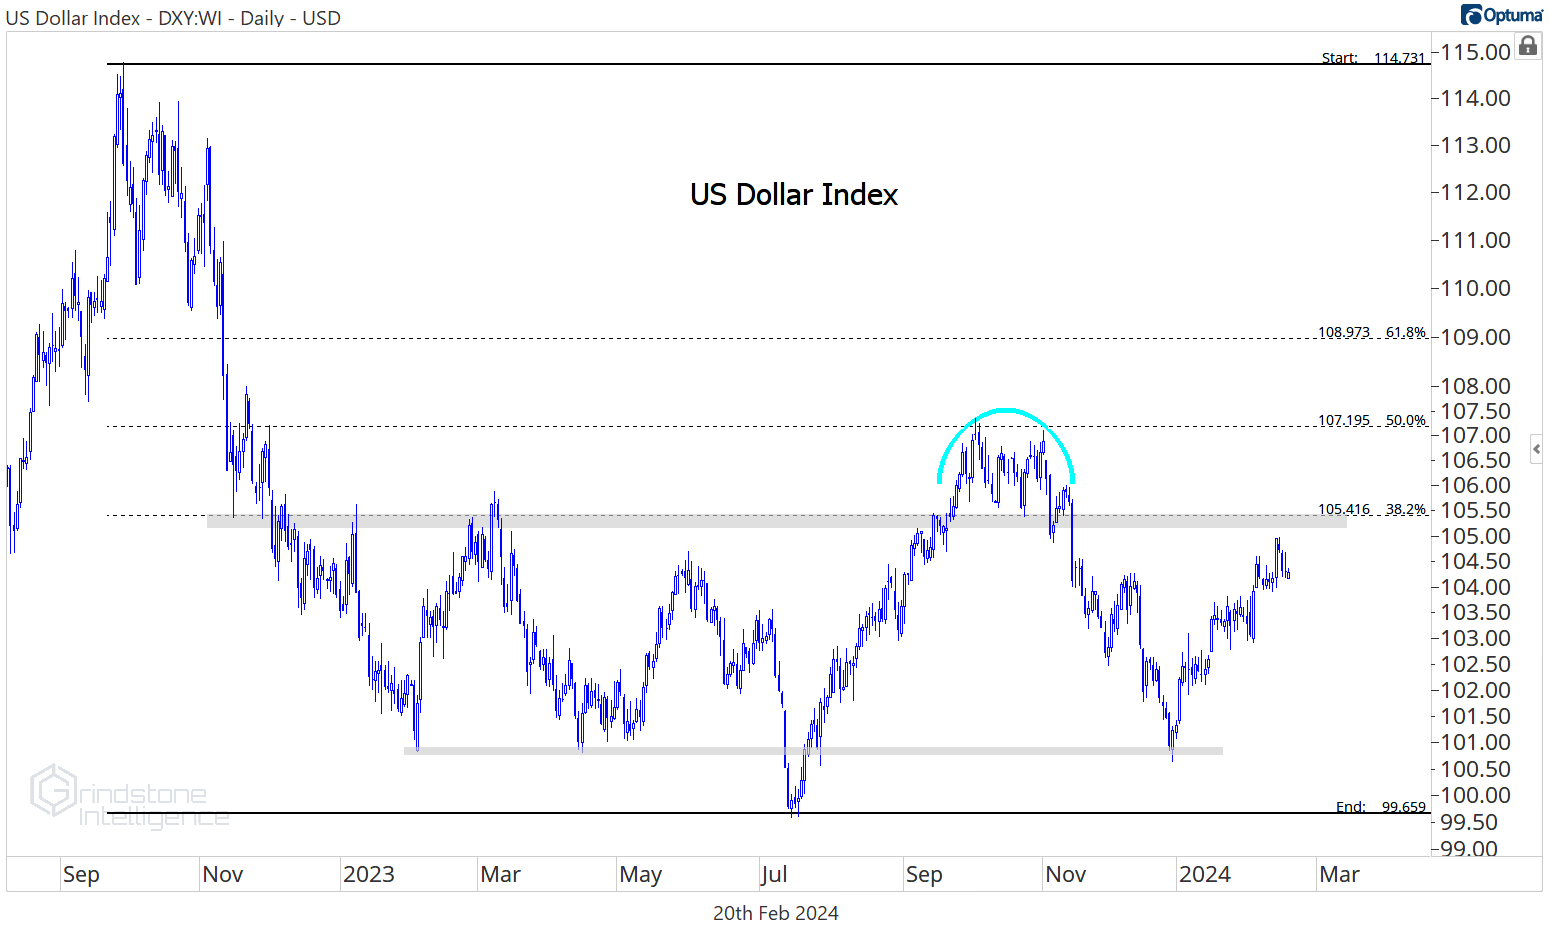
We always have to be aware of the bear thesis, even when markets are at all-time highs, and that’s exactly what we did in our January market outlook. We laid out exactly what we were watching for in order to turn more bearish on stocks. And our number 1 clue? The US Dollar.
Here’s what we said: “As long as the US Dollar Index is stuck in this range between 100 and 105, we think this bull market in stocks can remain intact… But if the Dollar is above 105, the story changes. We’d have to start taking the bearish evidence more seriously.”
And here’s where the Dollar Index stands today. Many bears out there have been sounding the alarm bells on stocks given the Dollar’s advance off the lows, but so far we simply haven’t seen enough. Not yet.
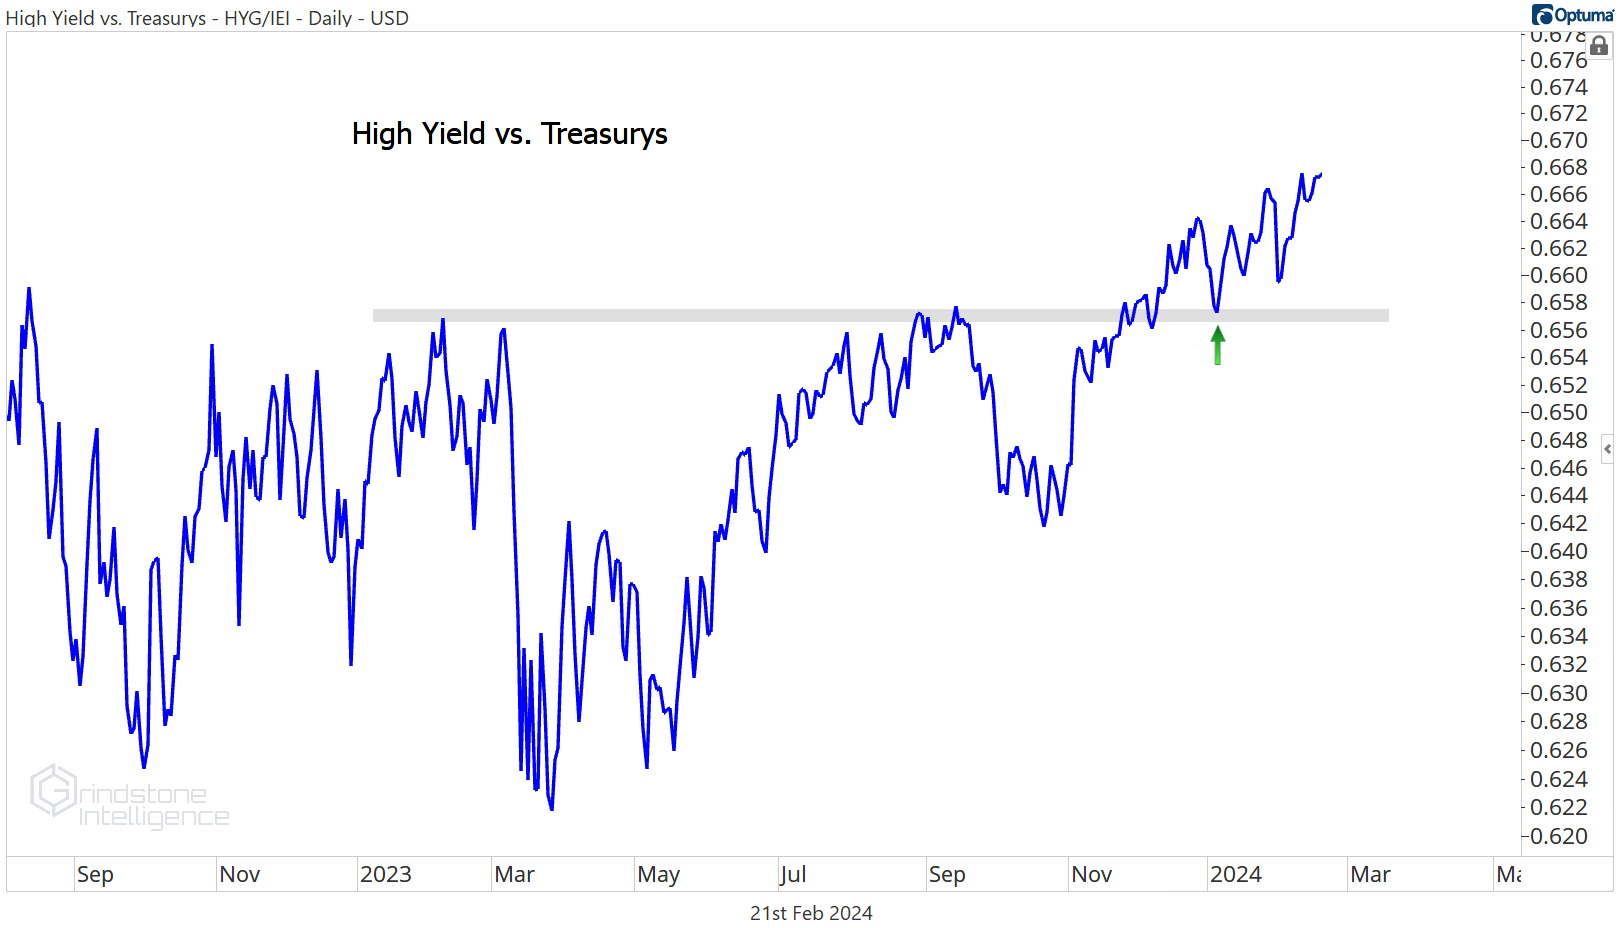
And as far as risk appetite goes, we don’t see investors running for safety, either. High yield bonds relative to US Treasurys are right near their highs.
So sure, it may take some to repair trends in some key sectors, but the evidence supporting a deep selloff for stocks just isn’t there yet. Until that changes, we’d rather err on the side of looking for stocks to buy.
Digging Deeper into the Industrials - Our Favorite Setups
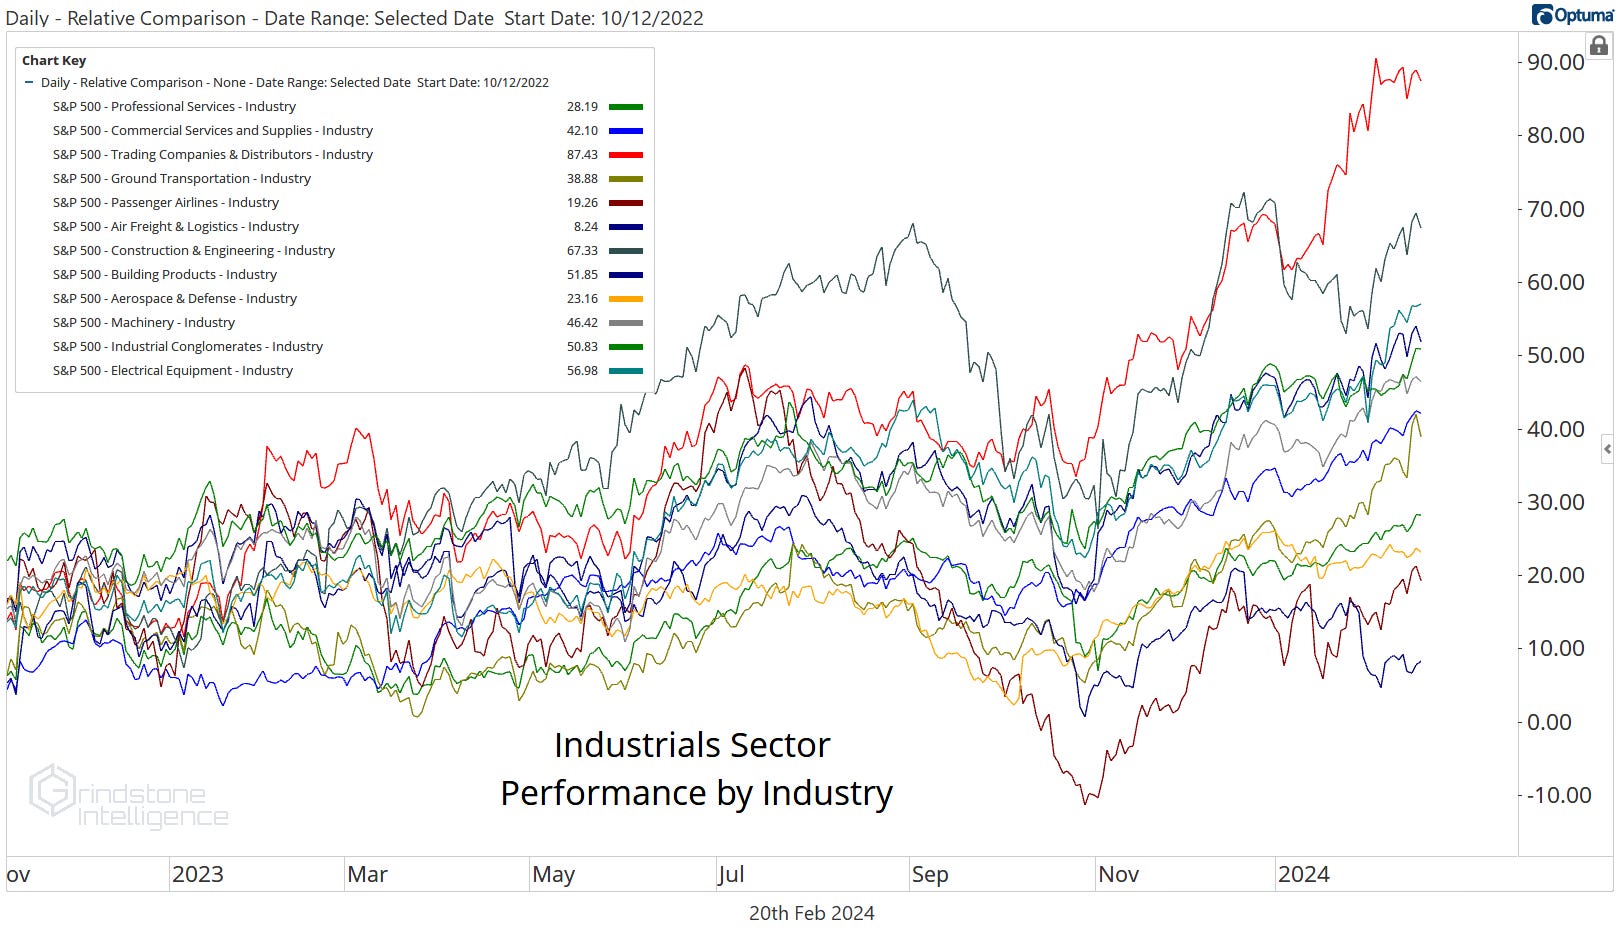
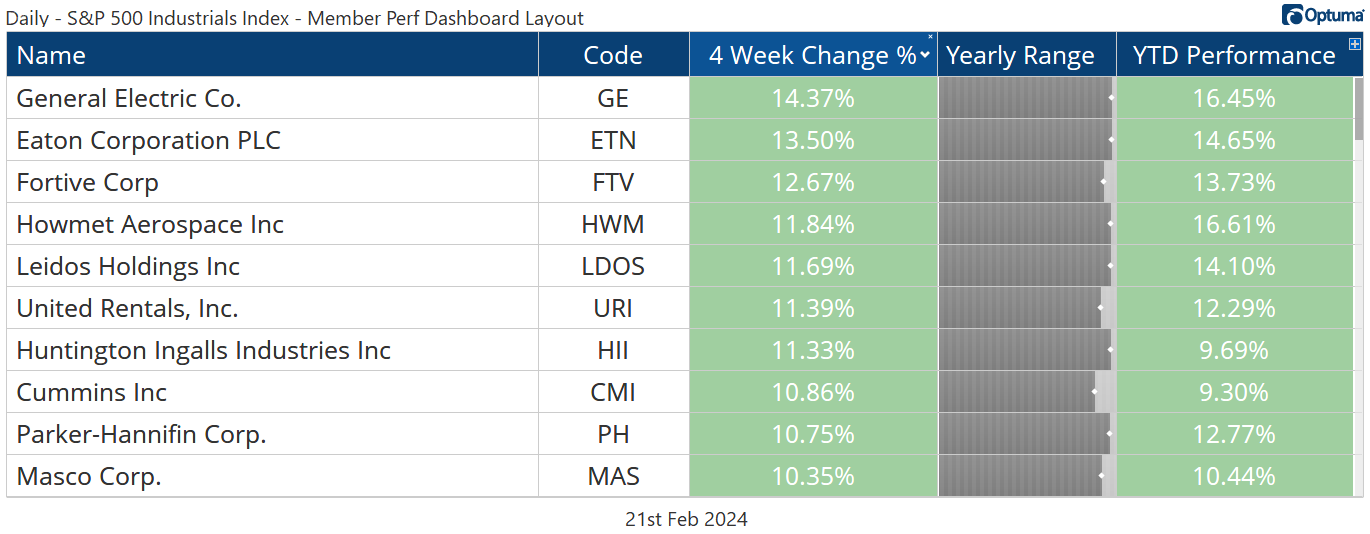
There’s no doubt about which industry has led the Industrials sector since stocks bottomed back in October 2022. The Trading Companies & Distributors have risen nearly 90%.
Over the last month, though, it’s the transports that have led. Passenger Airlines has been the best industry, up 11%, and Ground Transportation slid in at the #2 spot, gaining almost 8%.
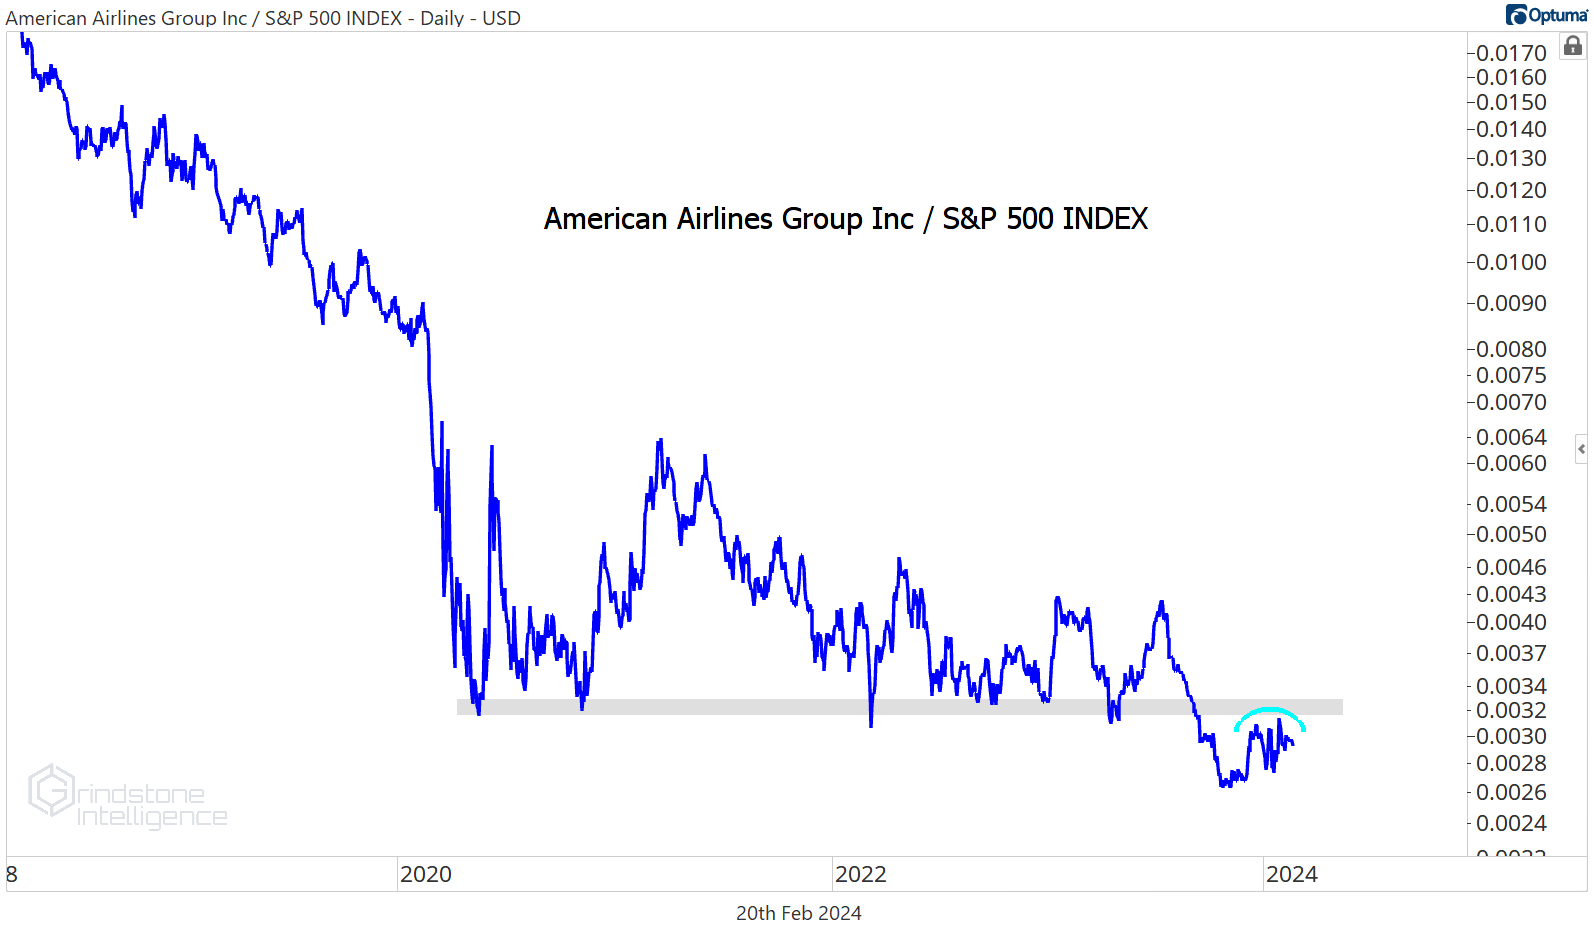
Despite the recent rally, Airlines are a place we want to avoid. This chart of American Airlines is pretty representative of the group as a whole. They’re consolidating below resistance from multi-year relative lows. Consolidations tend to resolve in the direction of the existing trend - which is down.
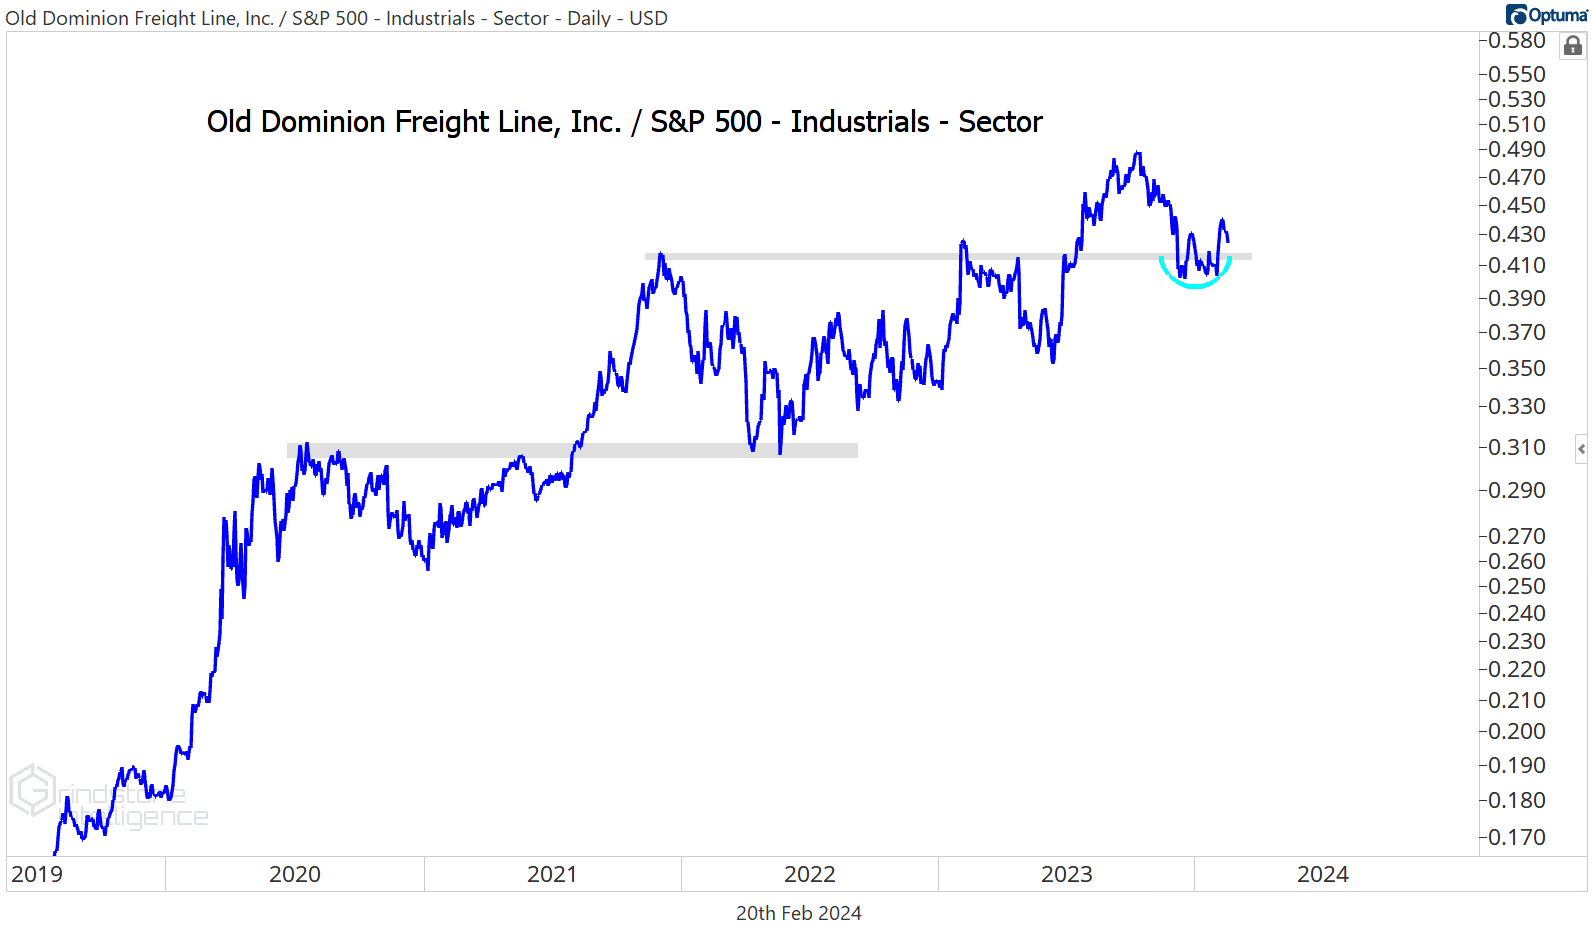
Within Ground Transportation, there are plenty of names that look as bad as the airlines (and some that look worse). Old Dominion has been better. Its multi-year uptrend relative to the rest of the Industrials sector remains intact so long as the ratio stays above support from the 2021-2022 highs.
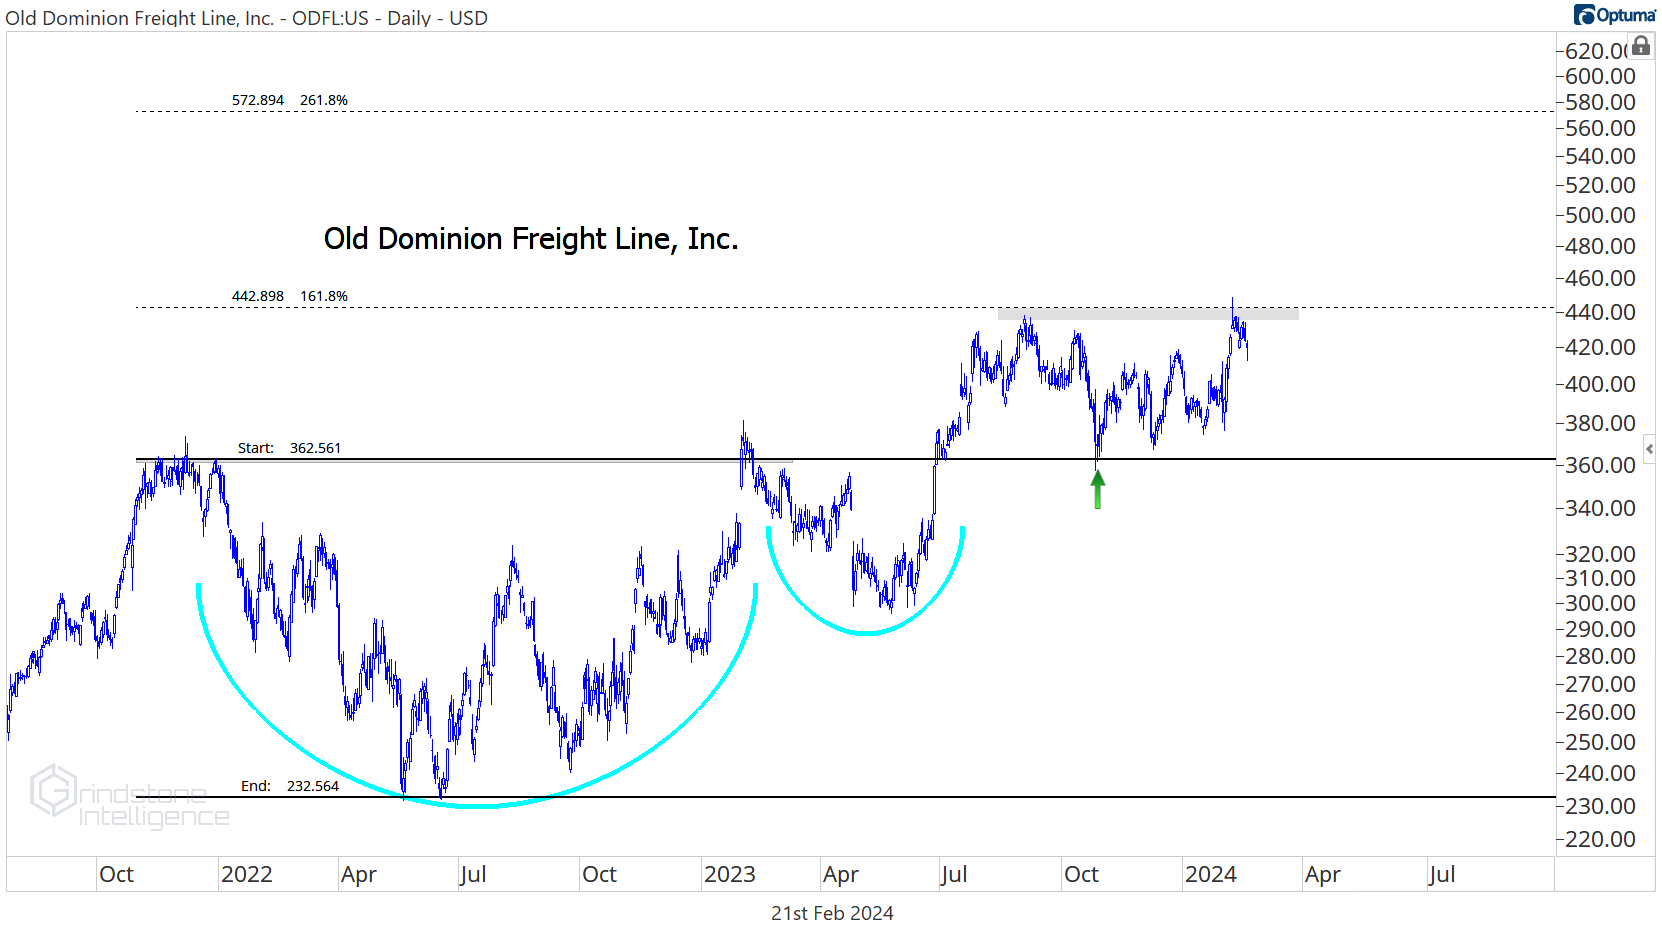
The stock did just hit our $440 target, so we can give it some time to digest these former highs. Longer-term, though, we think ODFL goes to $570, which is the 261.8% retracement from the 2021-2022 decline. We want to be buying a breakout above $445.
Leaders
GE has surged over the last month, bringing its year-to-date gains to 16.5%. The move also took GE past the $145 target we set in November, which was the 2014-2015 lows.
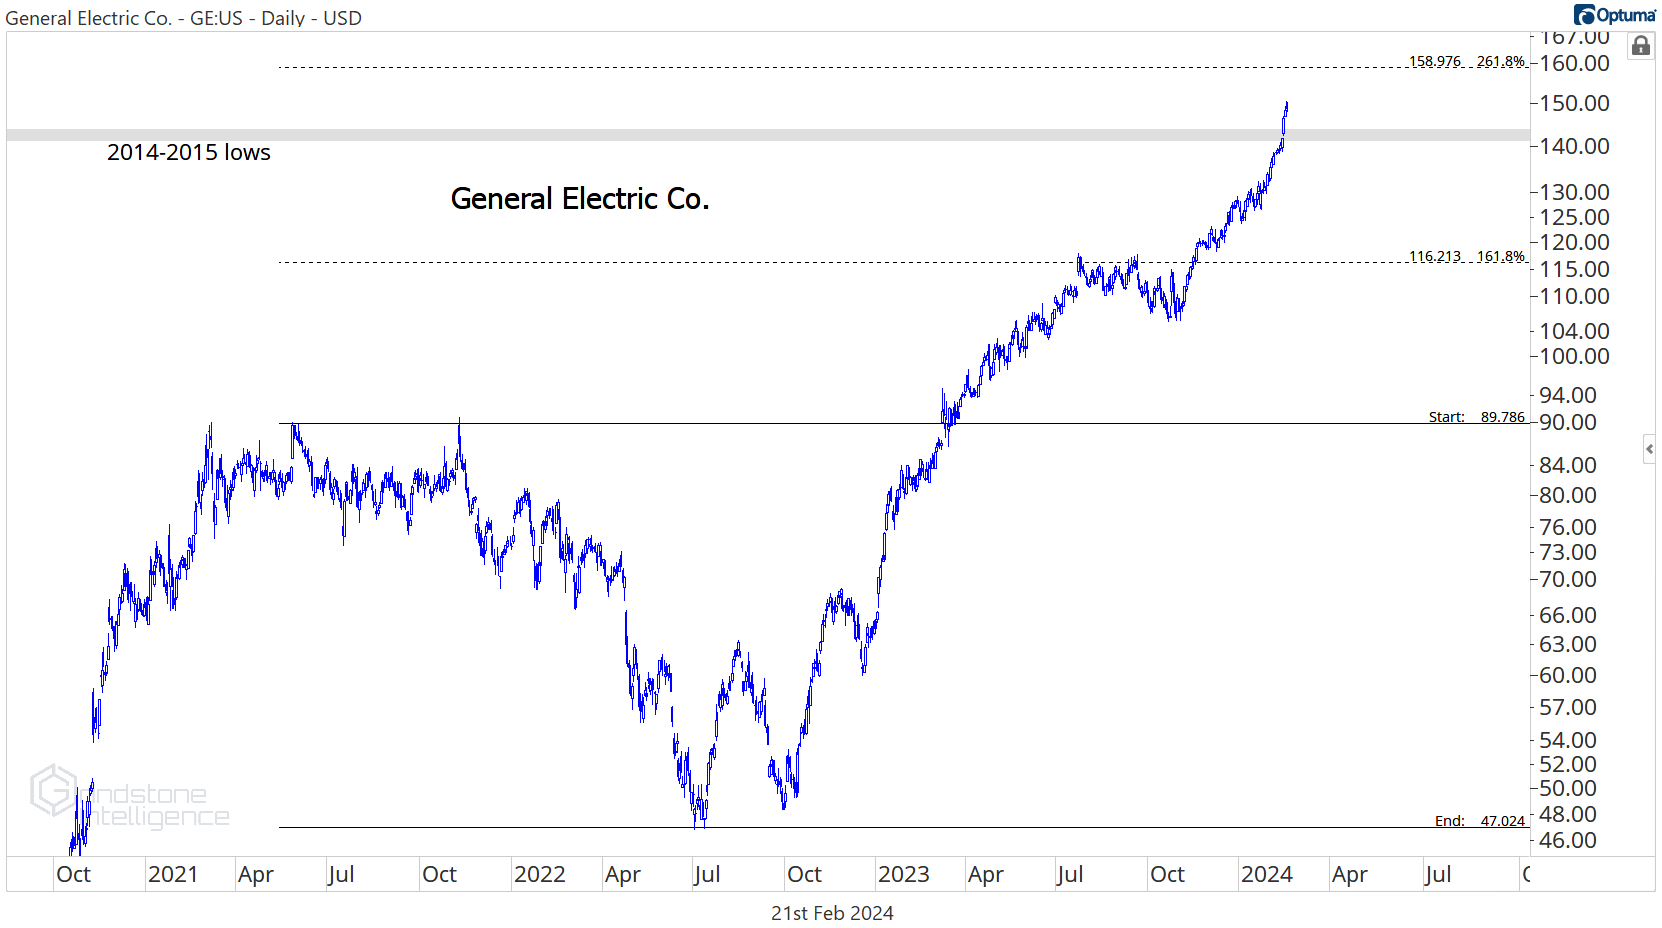
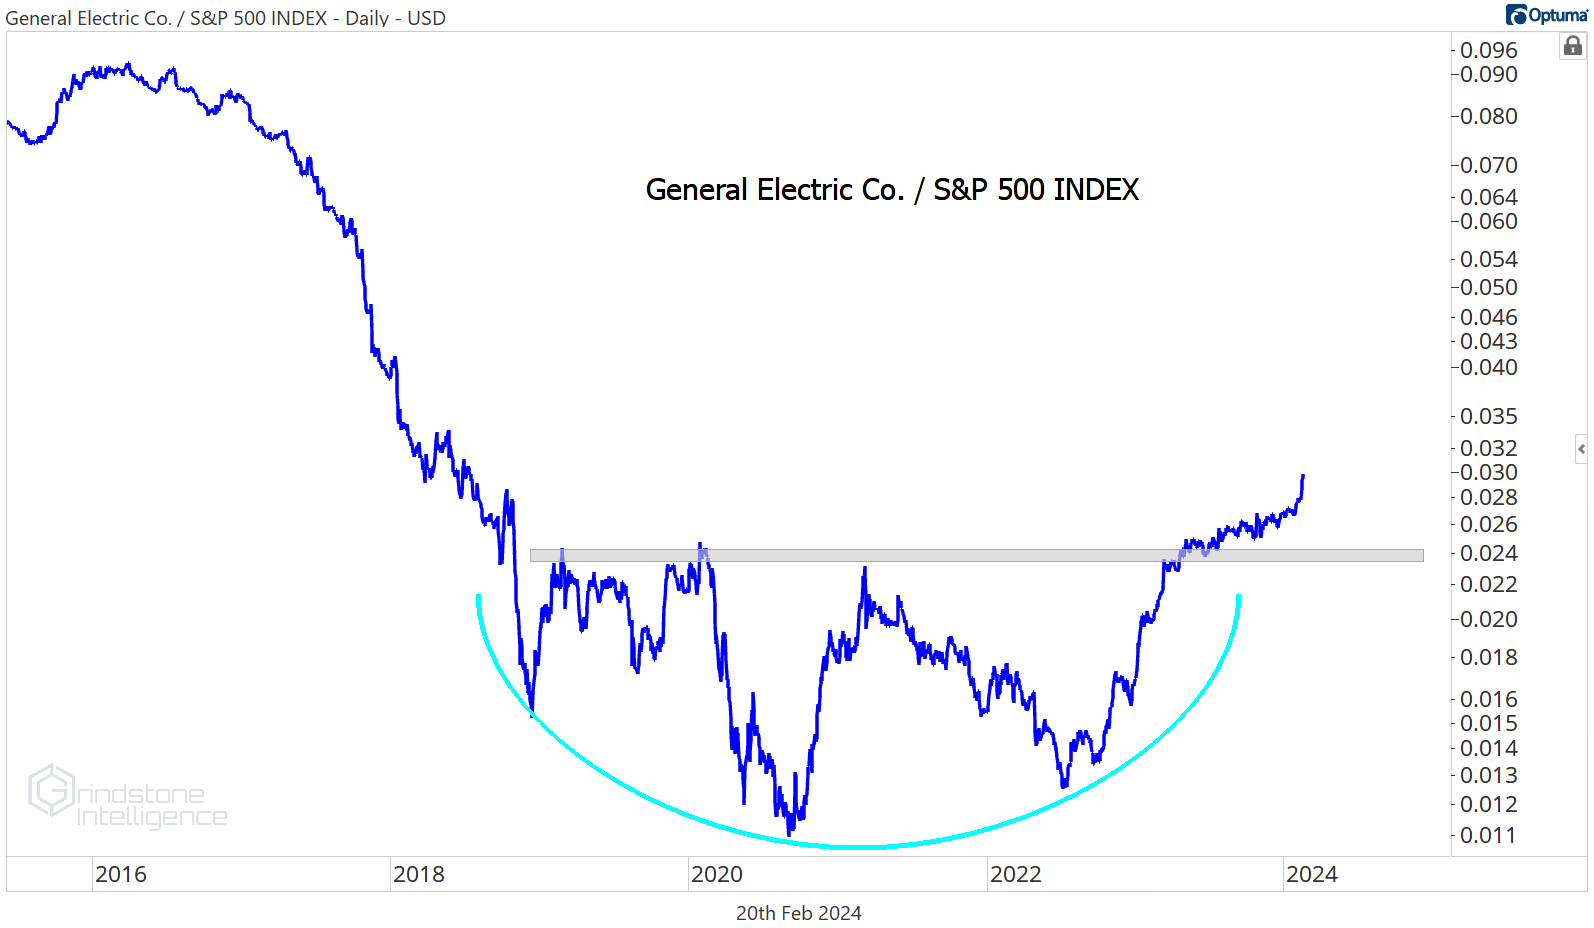
The stock is up near the 261.8% retracement from the 2021-2022 selloff, a potential area of resistance, so this isn’t the place to be initiating new positions. But before you think GE has gone too far, too fast, you need to zoom out. It just went absolutely nowhere vs. the rest of the market for 5 years. There’s a lot of catching up to do.
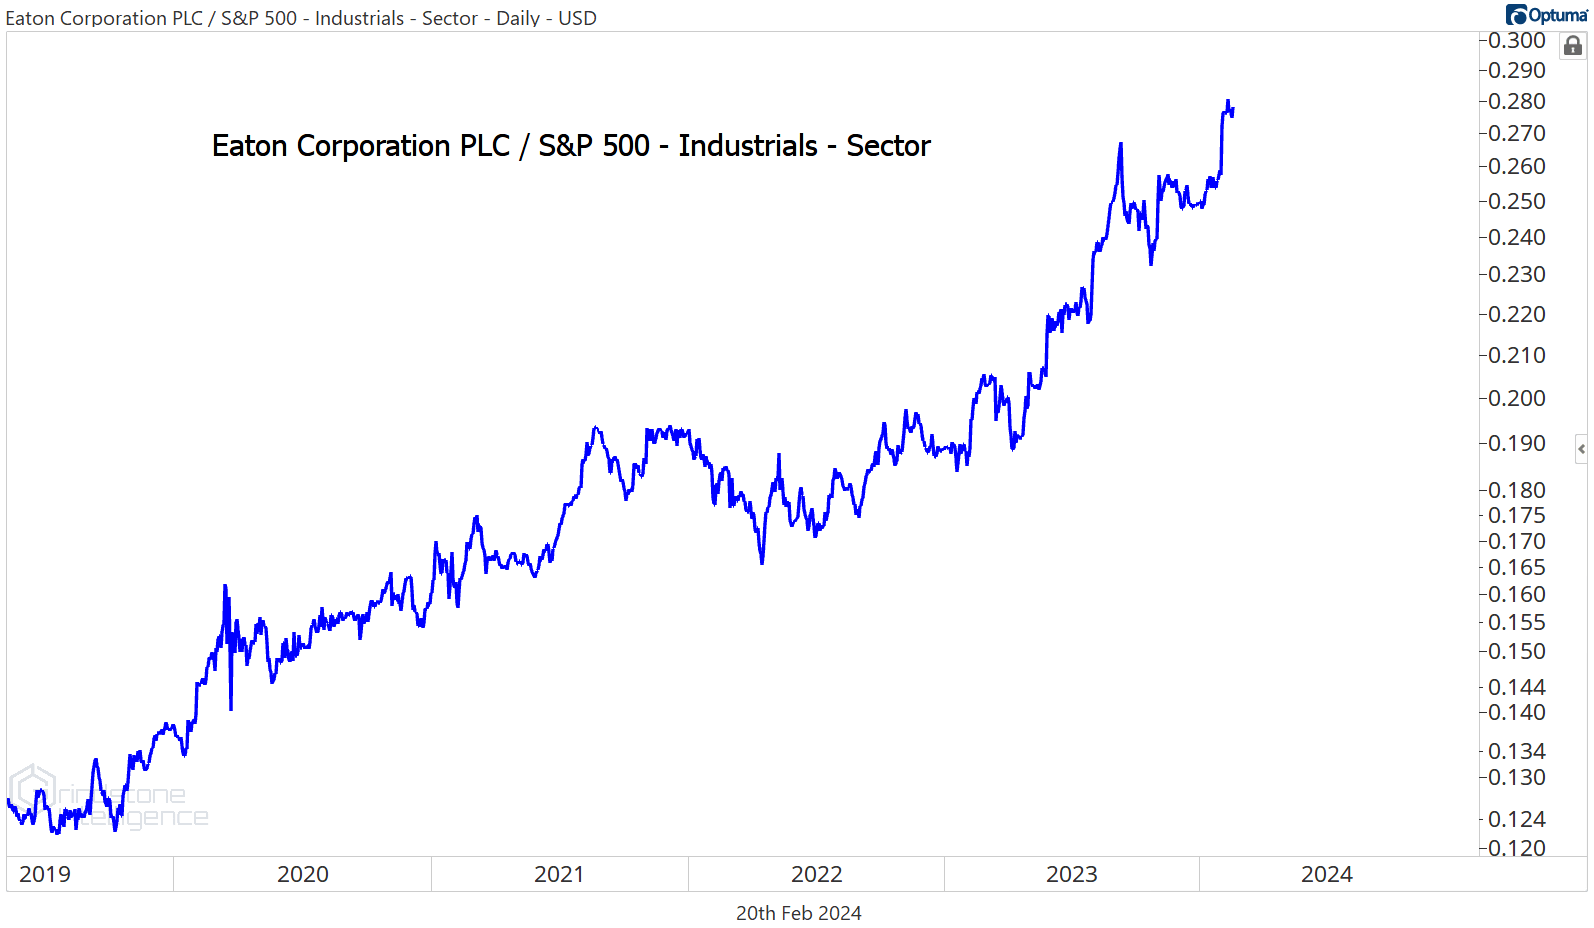
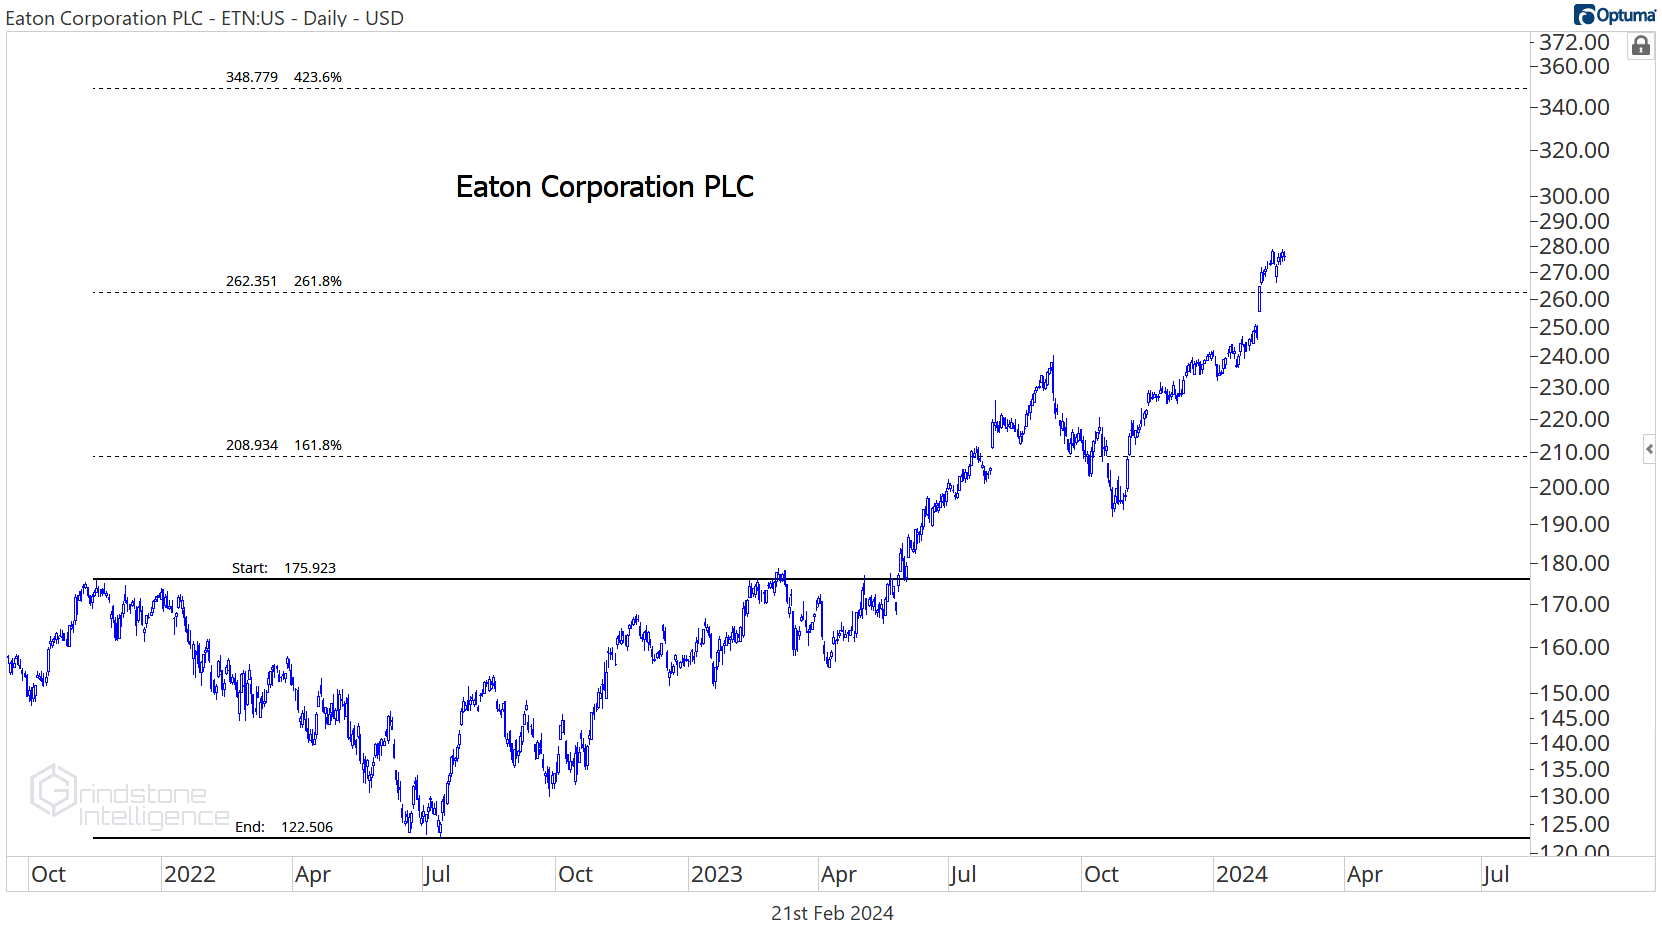
Eaton has been another big winner, and unlike GE, it’s been a picture of relative strength for all of the past 5 years. Here it is compared to the rest of the Industrials sector.
We can be buying Eaton above $260 with a target of $350.
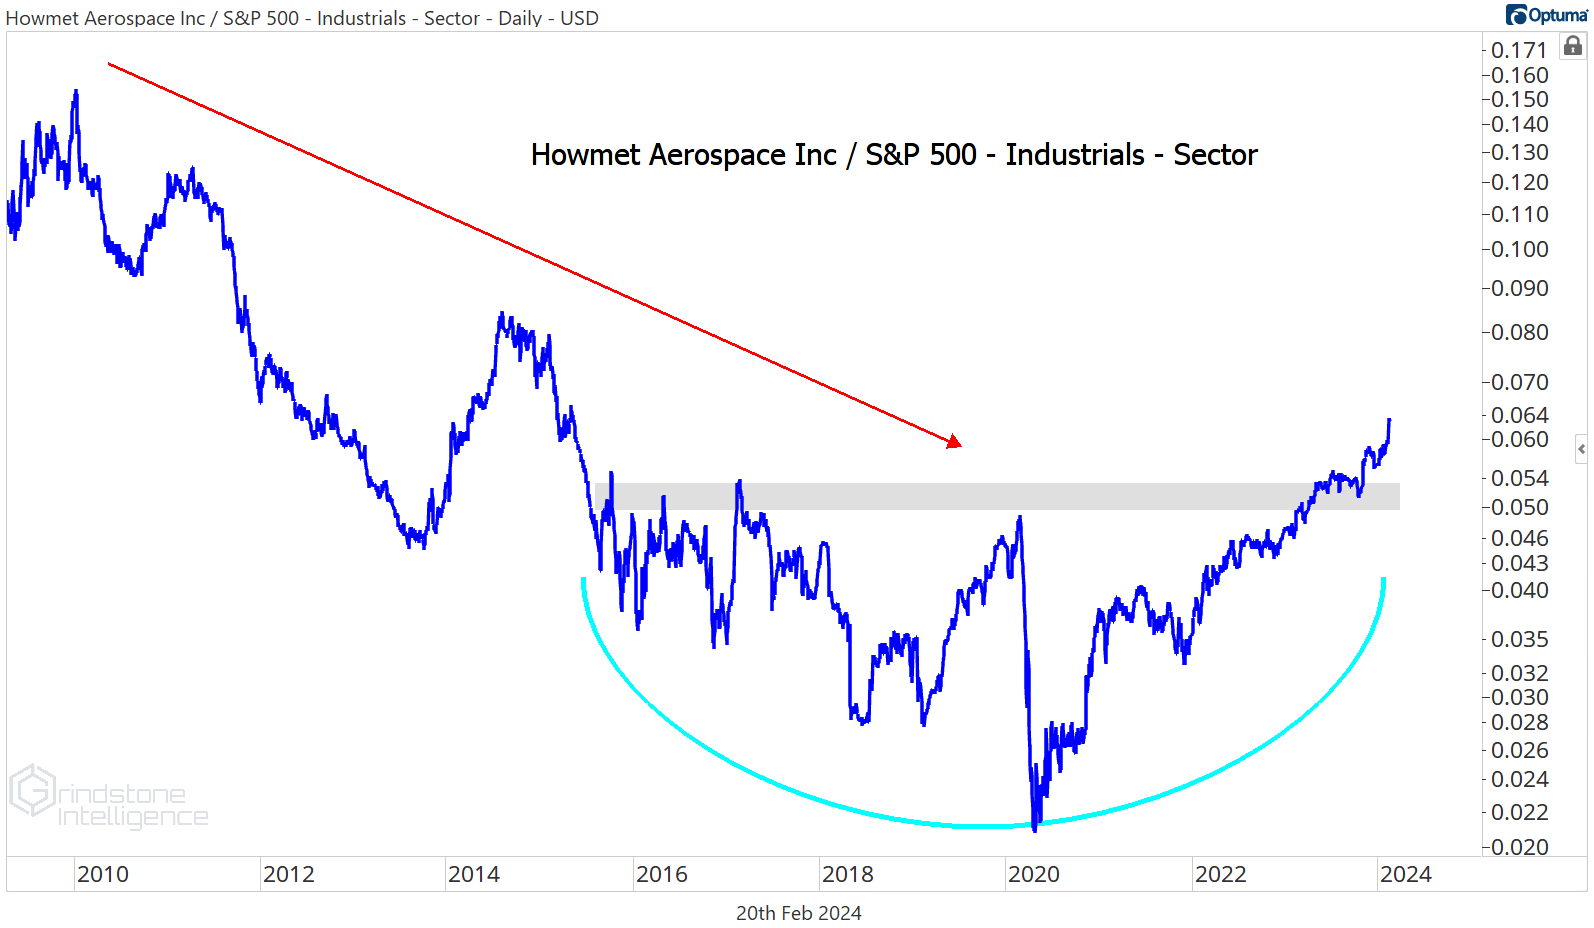
We’ve been big fans of Howmet Aerospace ever since it broke out of this huge, 15-year base early last year, and it’s still trekking toward our long-term target of $70.
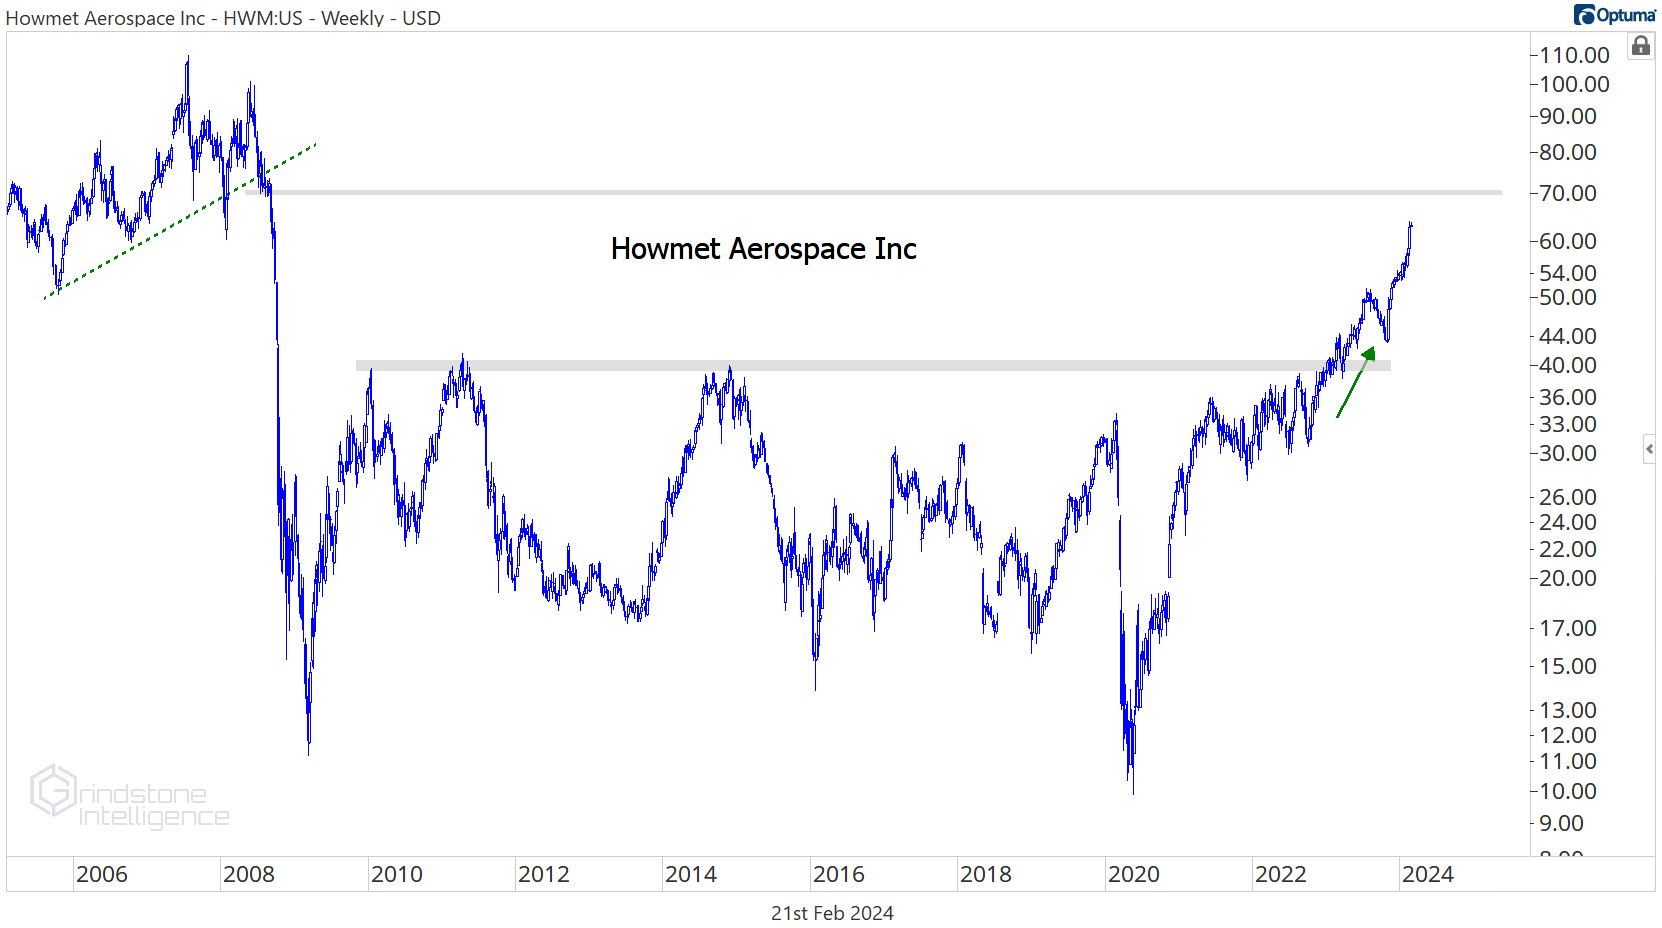
What impresses us most is the relative strength in Howmet. After being a serial laggard from 2008 to 2022, HWM is now setting multi-year highs relative to the rest of the Industrials space.
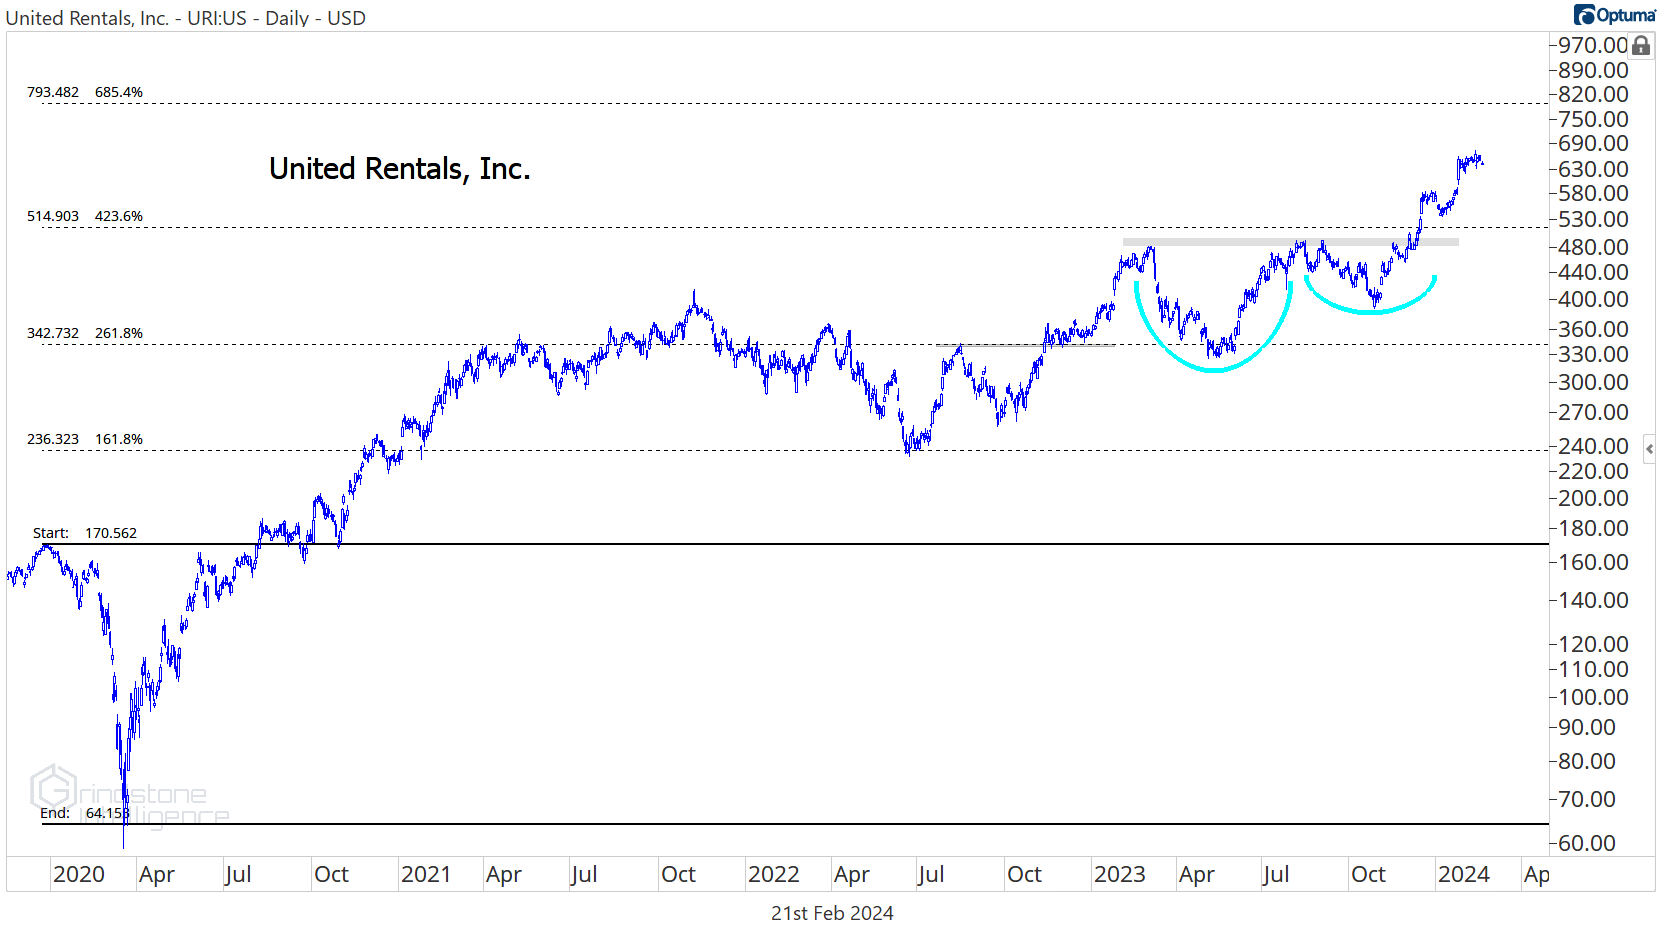
United Rentals is another favorite that continues to show relative strength.
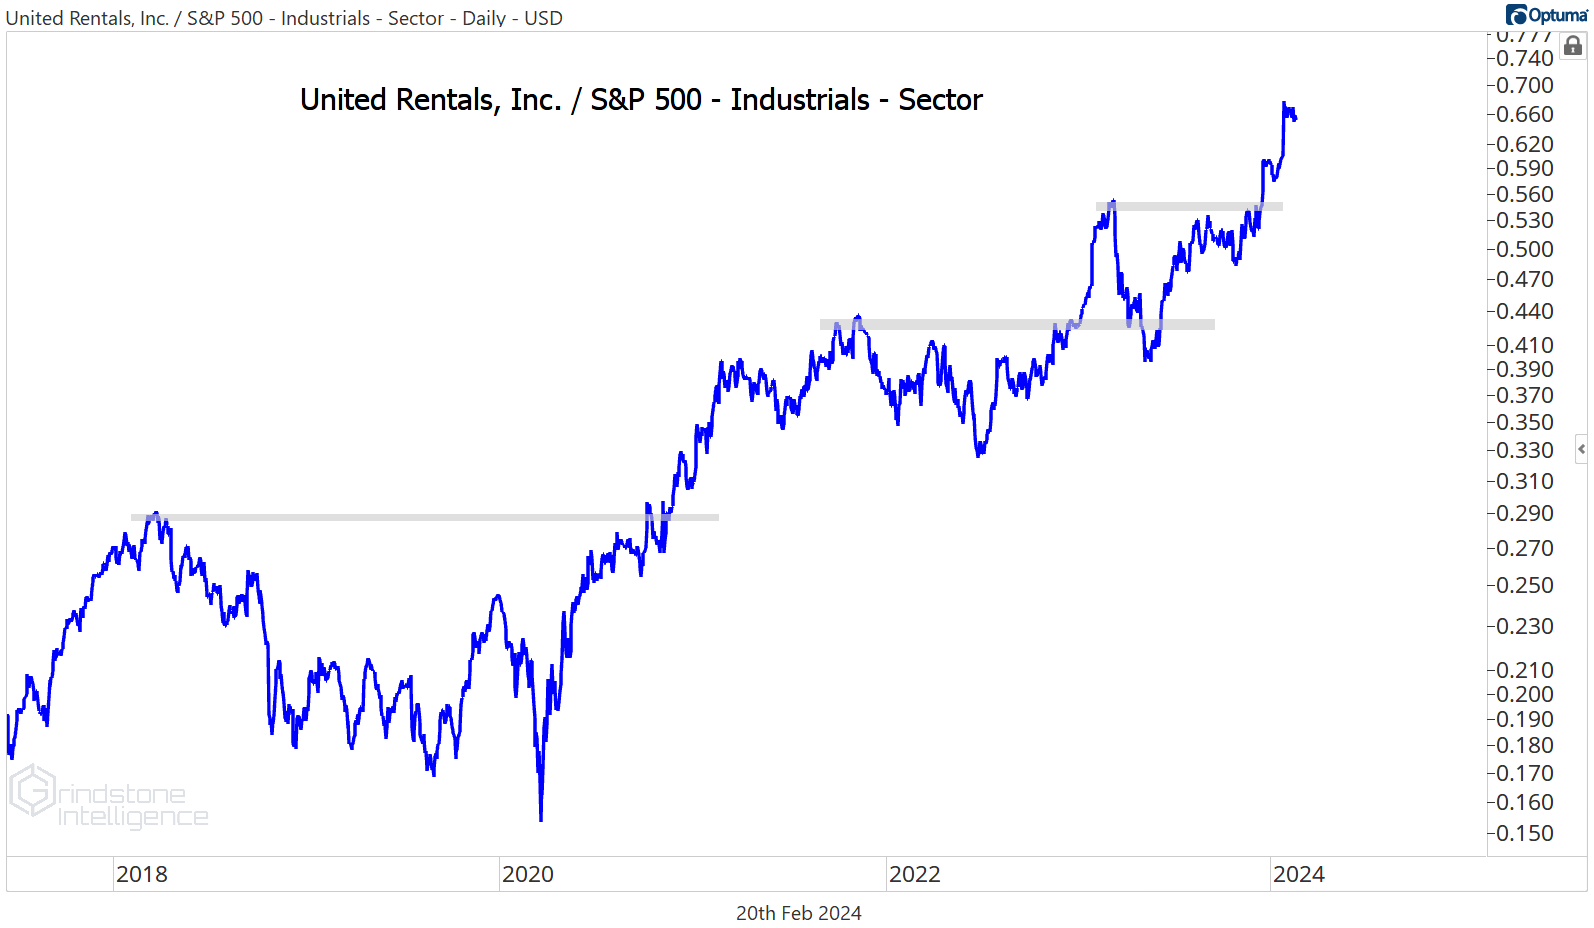
Our target is still $800.
Losers
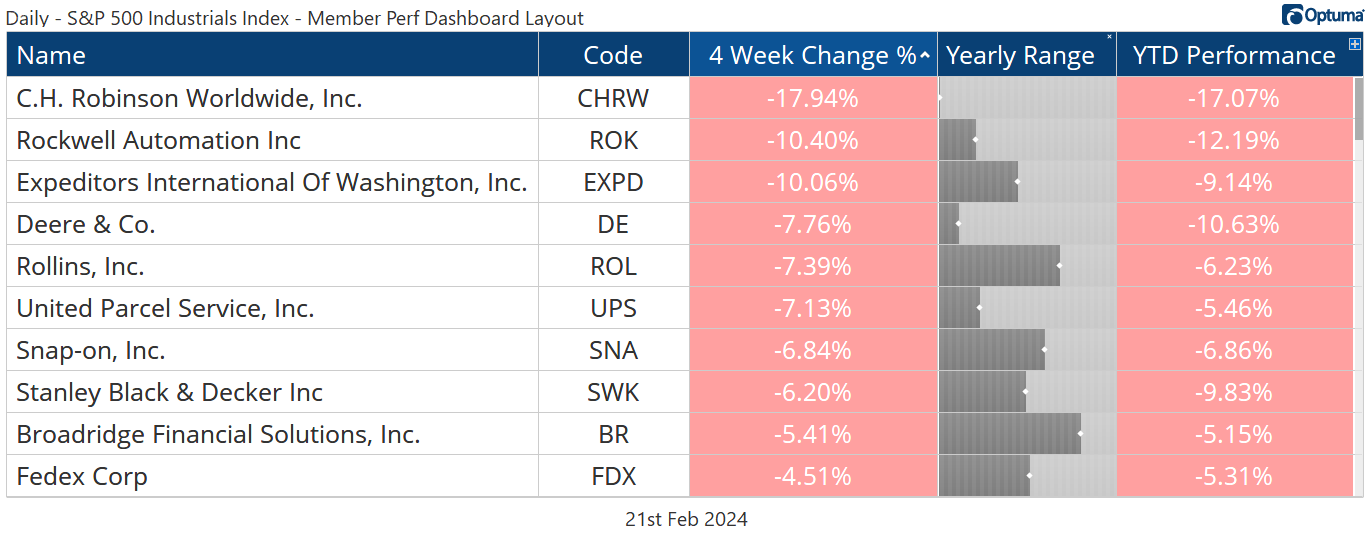
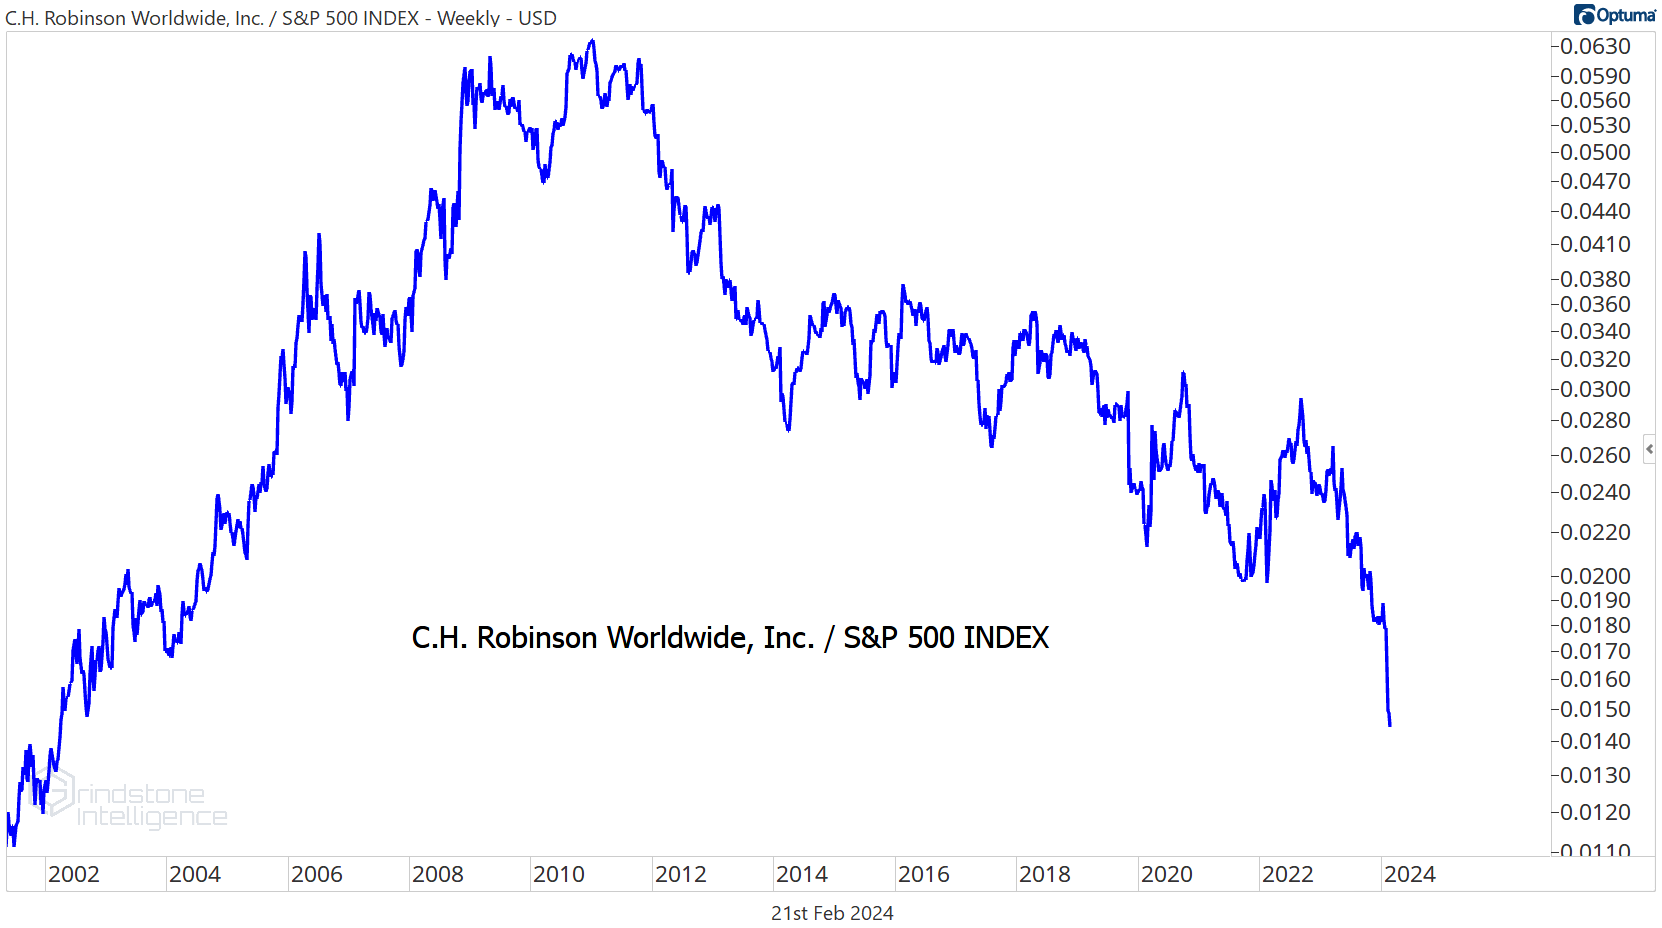
The opposite of relative strength is CH Robinson. It’s setting 20-year relative lows.
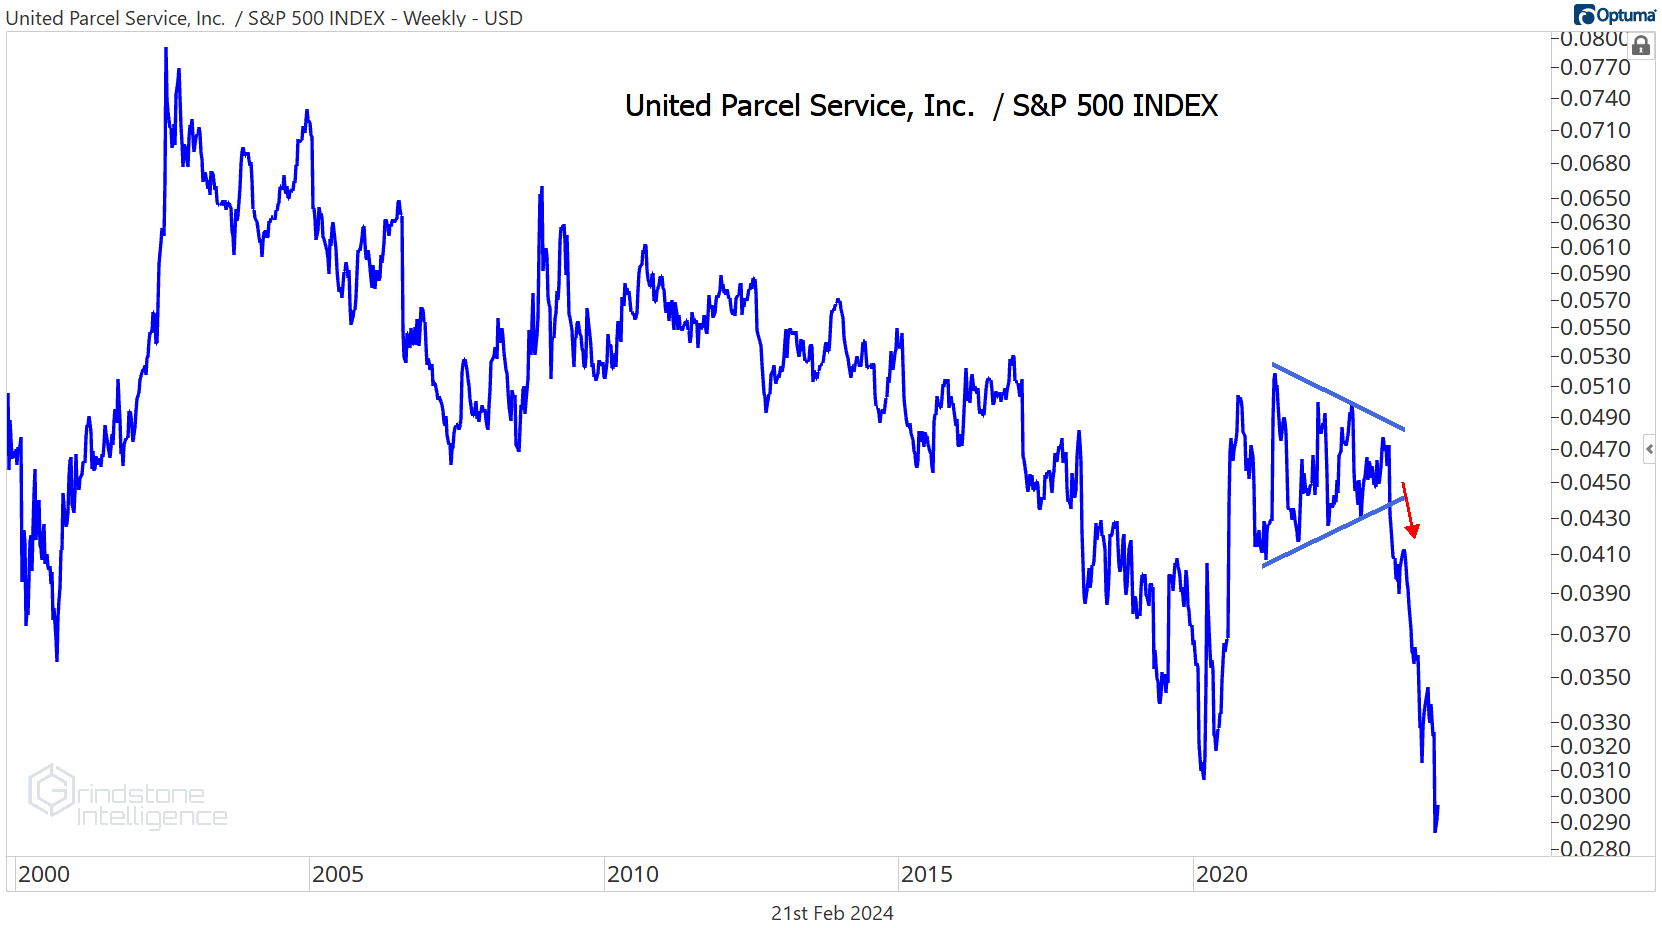
UPS is even worse. It just hit its lowest level ever compared to the rest of the market. These are the types of stocks we want to avoid. Let falling knives hit the floor and stop spinning before you try to pick them up.
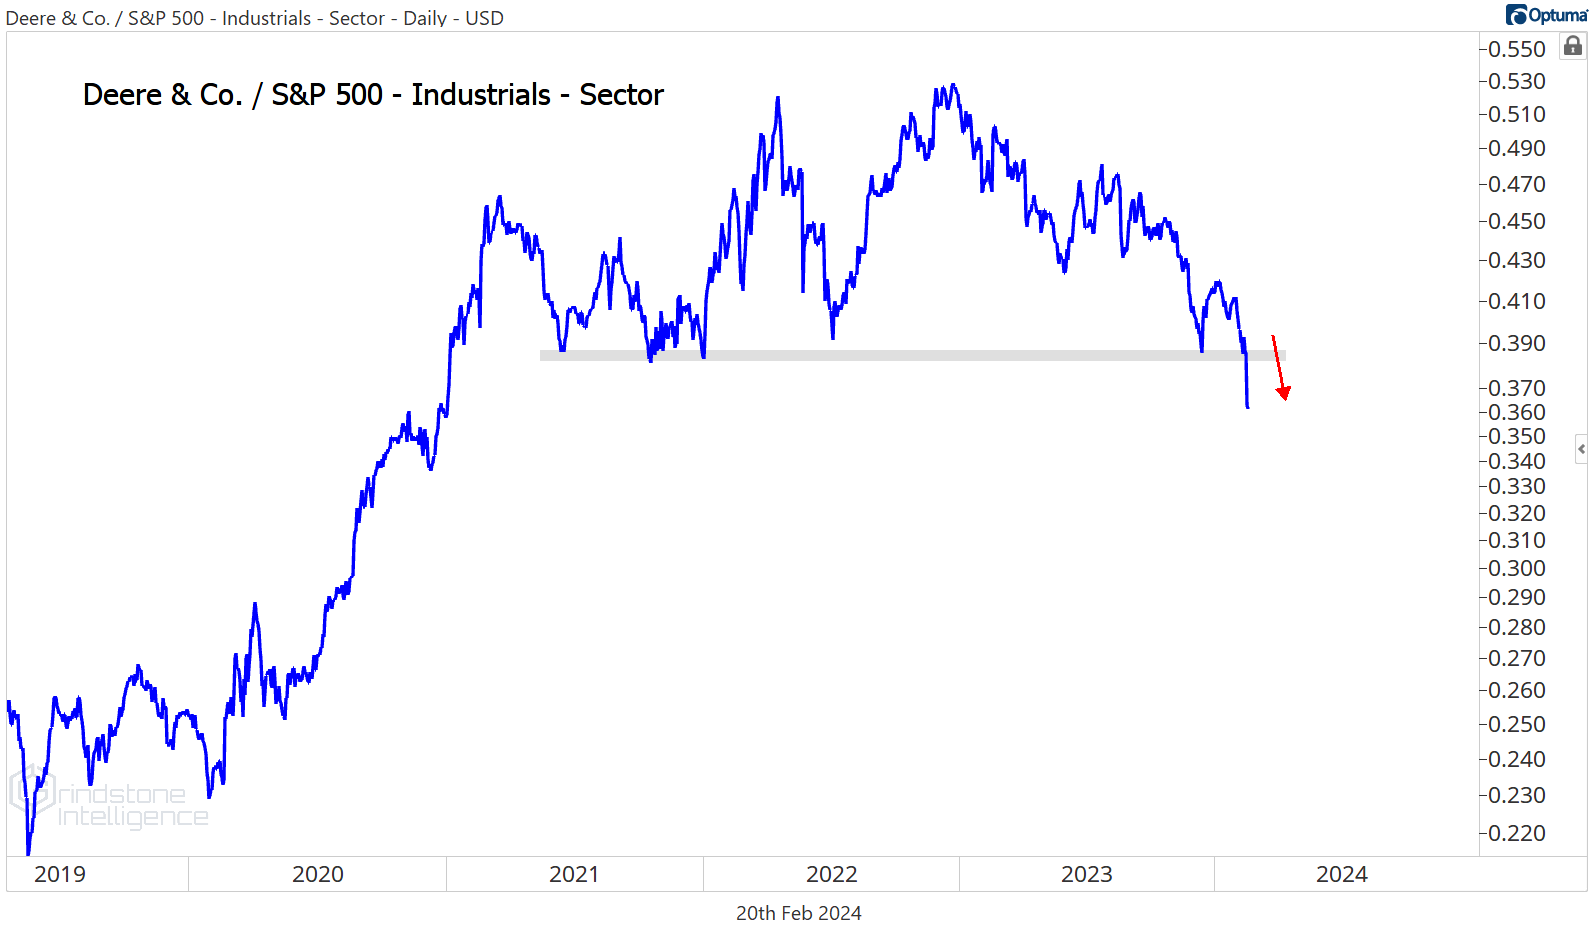
This breakdown in Deere is pretty ugly, too. Deere was a good one from 2019 to the end of 2022, when it was outperforming the rest of the Industrials sector, but no trend lasts forever. DE is guilty until proven innocent, now, and we want to focus our attention elsewhere.
More charts to watch
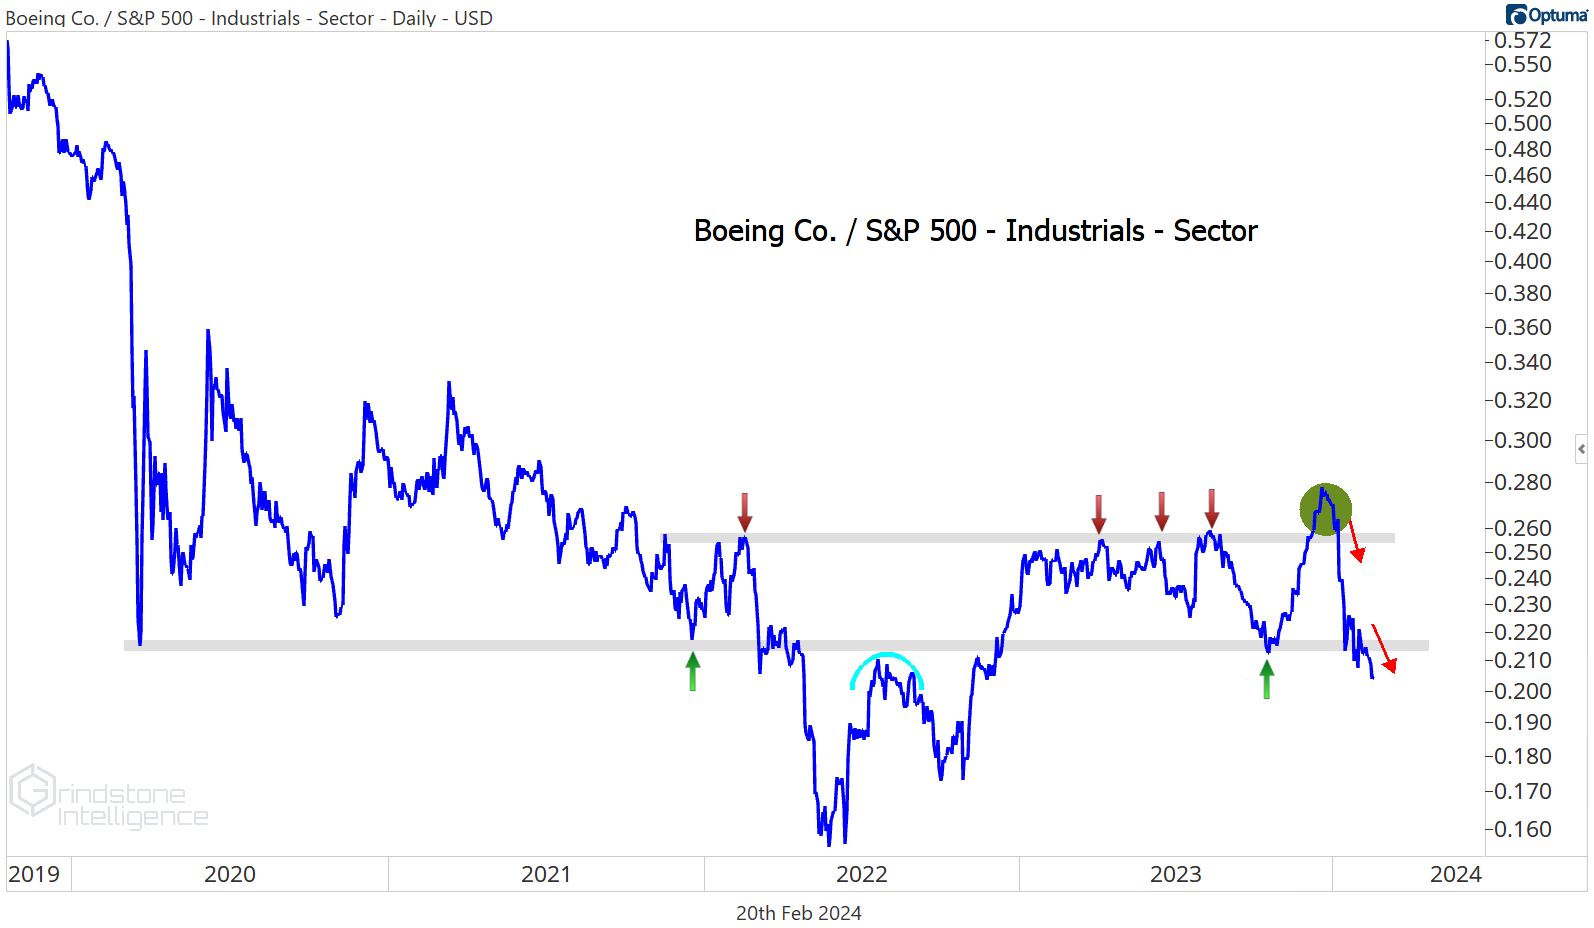
Boeing is the same way. We loved the December breakout for Boeing relative to the rest of the sector, but then a door blew off a plane because people apparently forgot how to use a ratchet. Now the stock is hitting new 52-week relative lows. There’s just no reason to be involved from the long side.
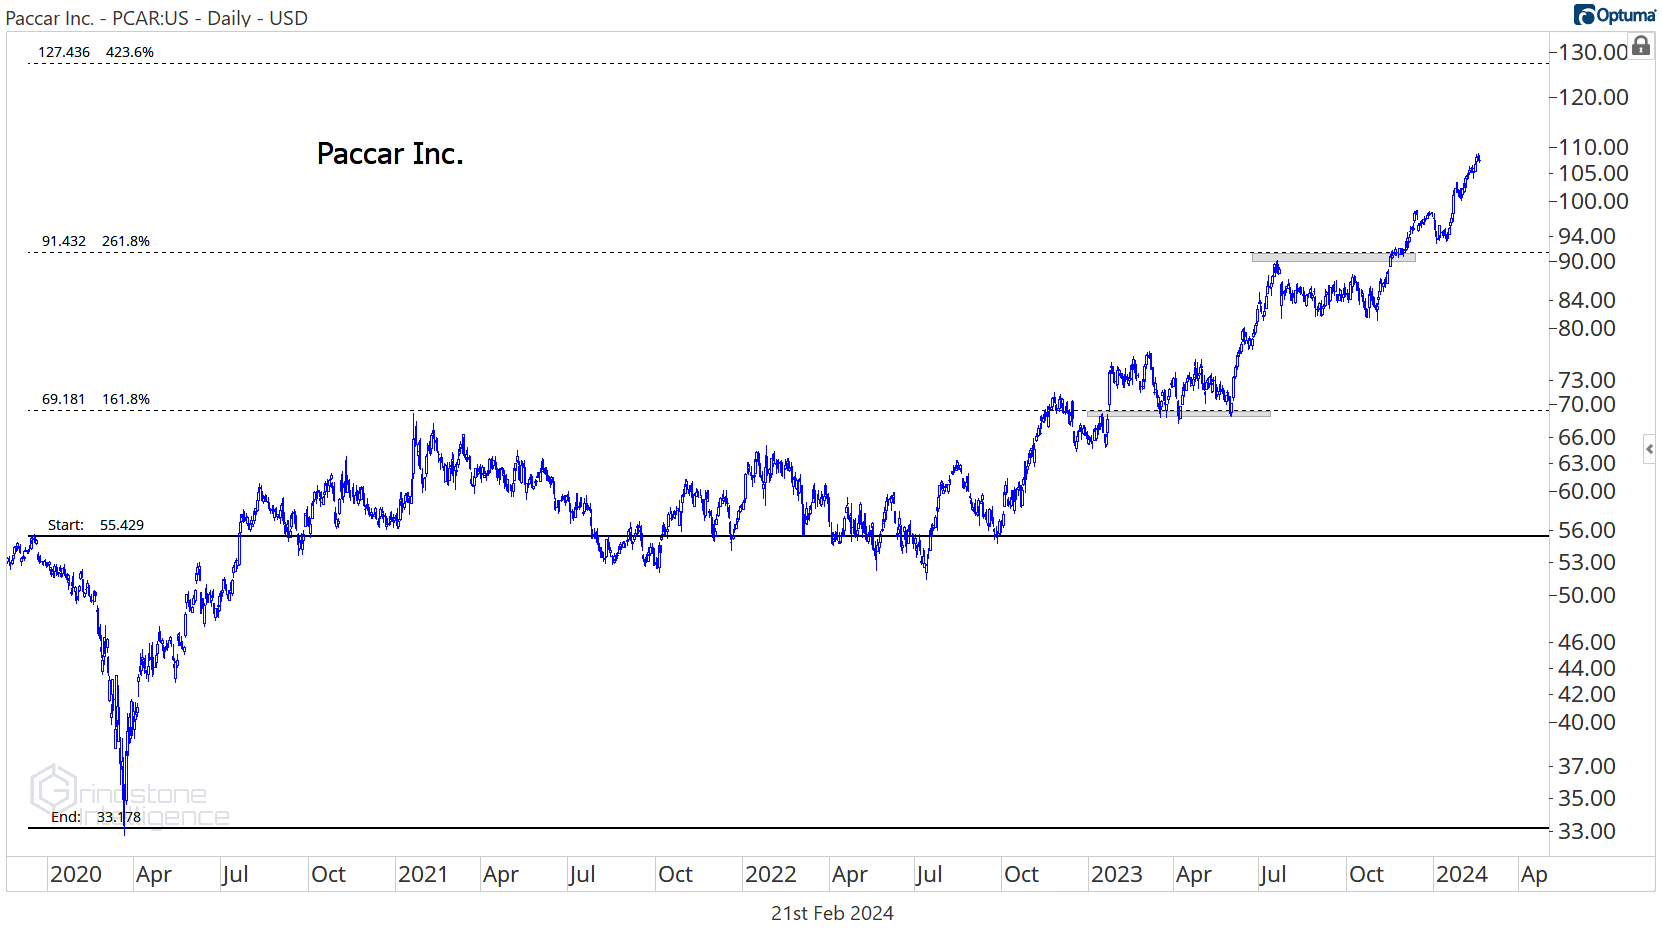
Relative weakness tends to beget more weakness, which is why we focus instead on the stocks showing relative strength. Like Paccar. It’s setting new highs compared to the rest of the Industrials.
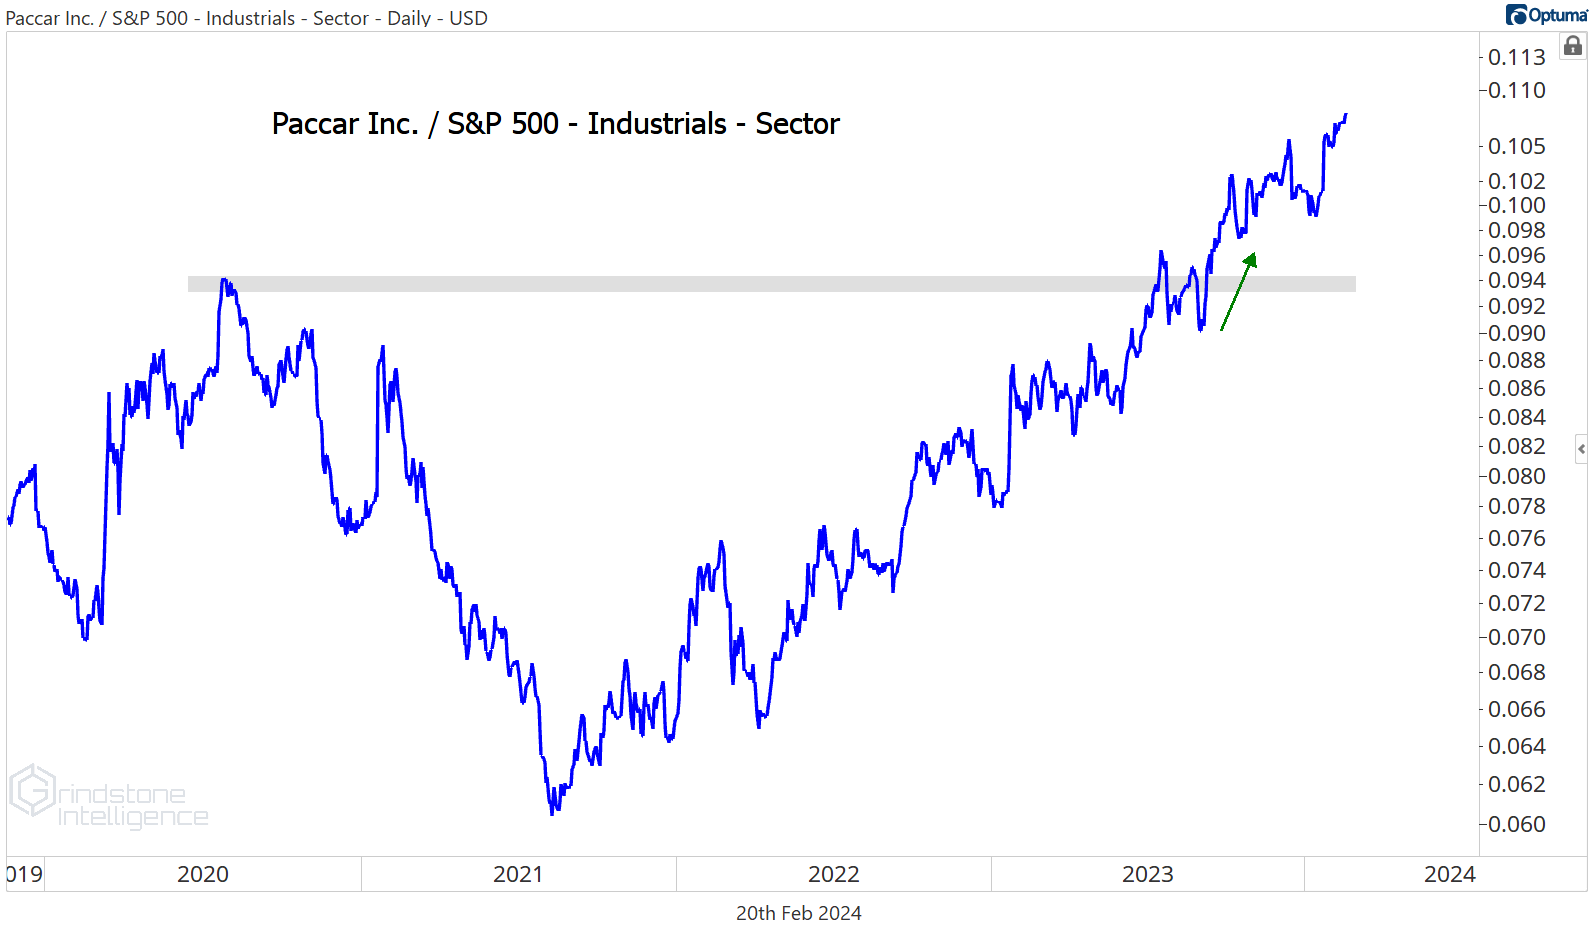
We want to be buying this relative strength in PCAR on any pullbacks toward $92 (which is the 261.8% retracement from the 2019-2020 decline) with a target at the next key Fibonacci retracement level at $127.
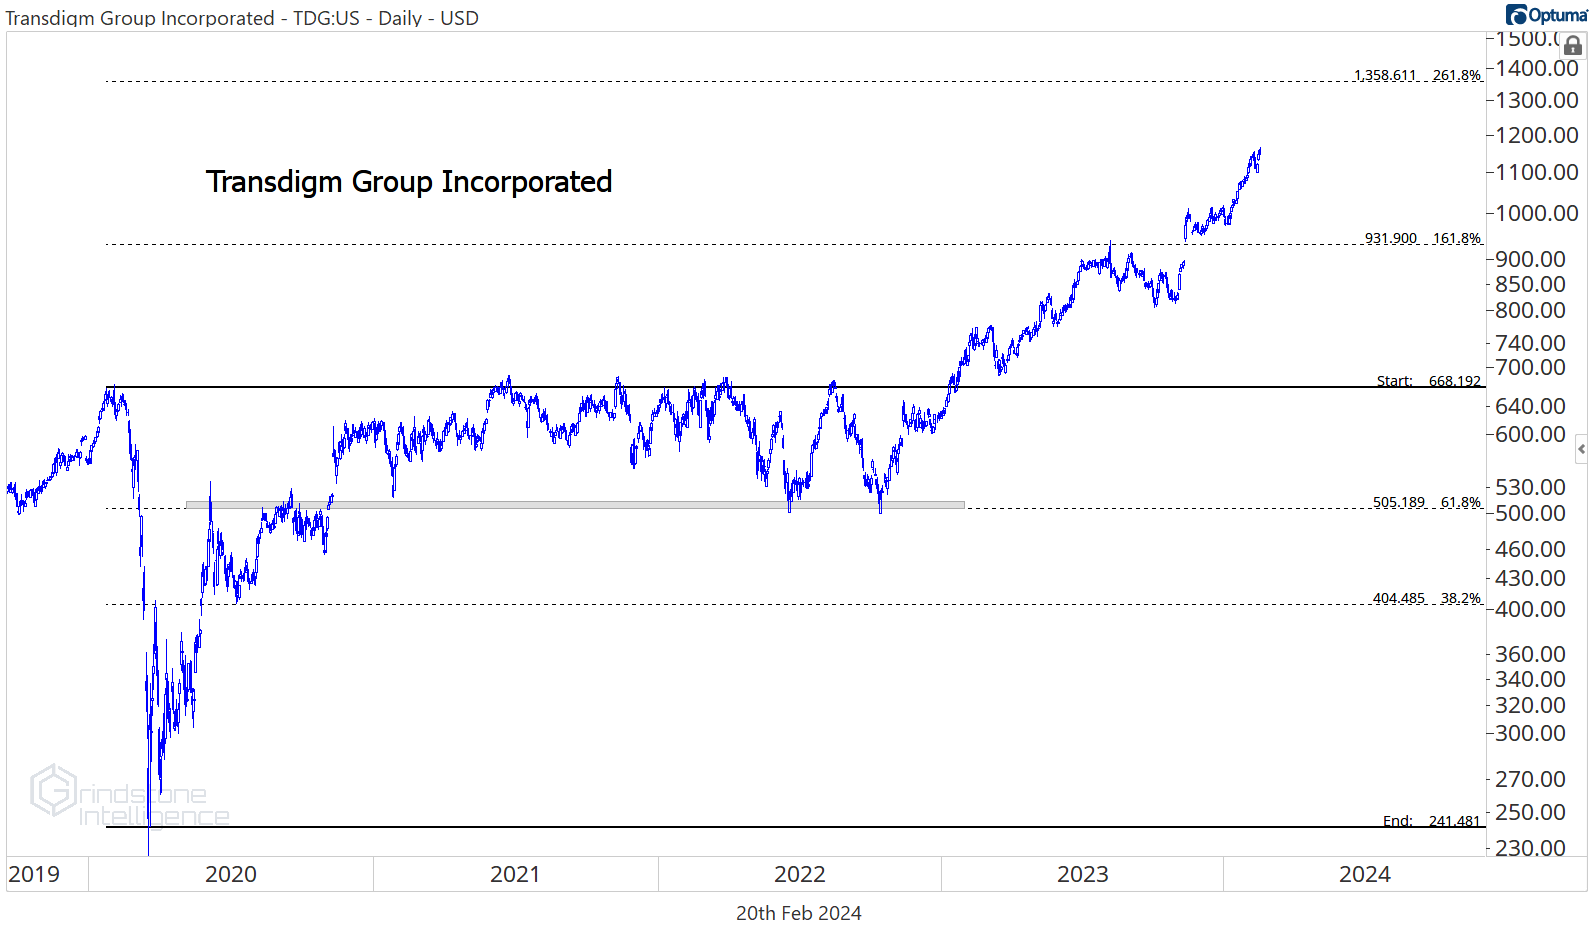
The same thing goes for Transdigm. It’s halfway to our target of $1300, but if the whole market comes under pressure, we want to take advantage by buying pullbacks towards support at $930.
Grainger hit our target or $970, and now we’re in wait-and-see mode.
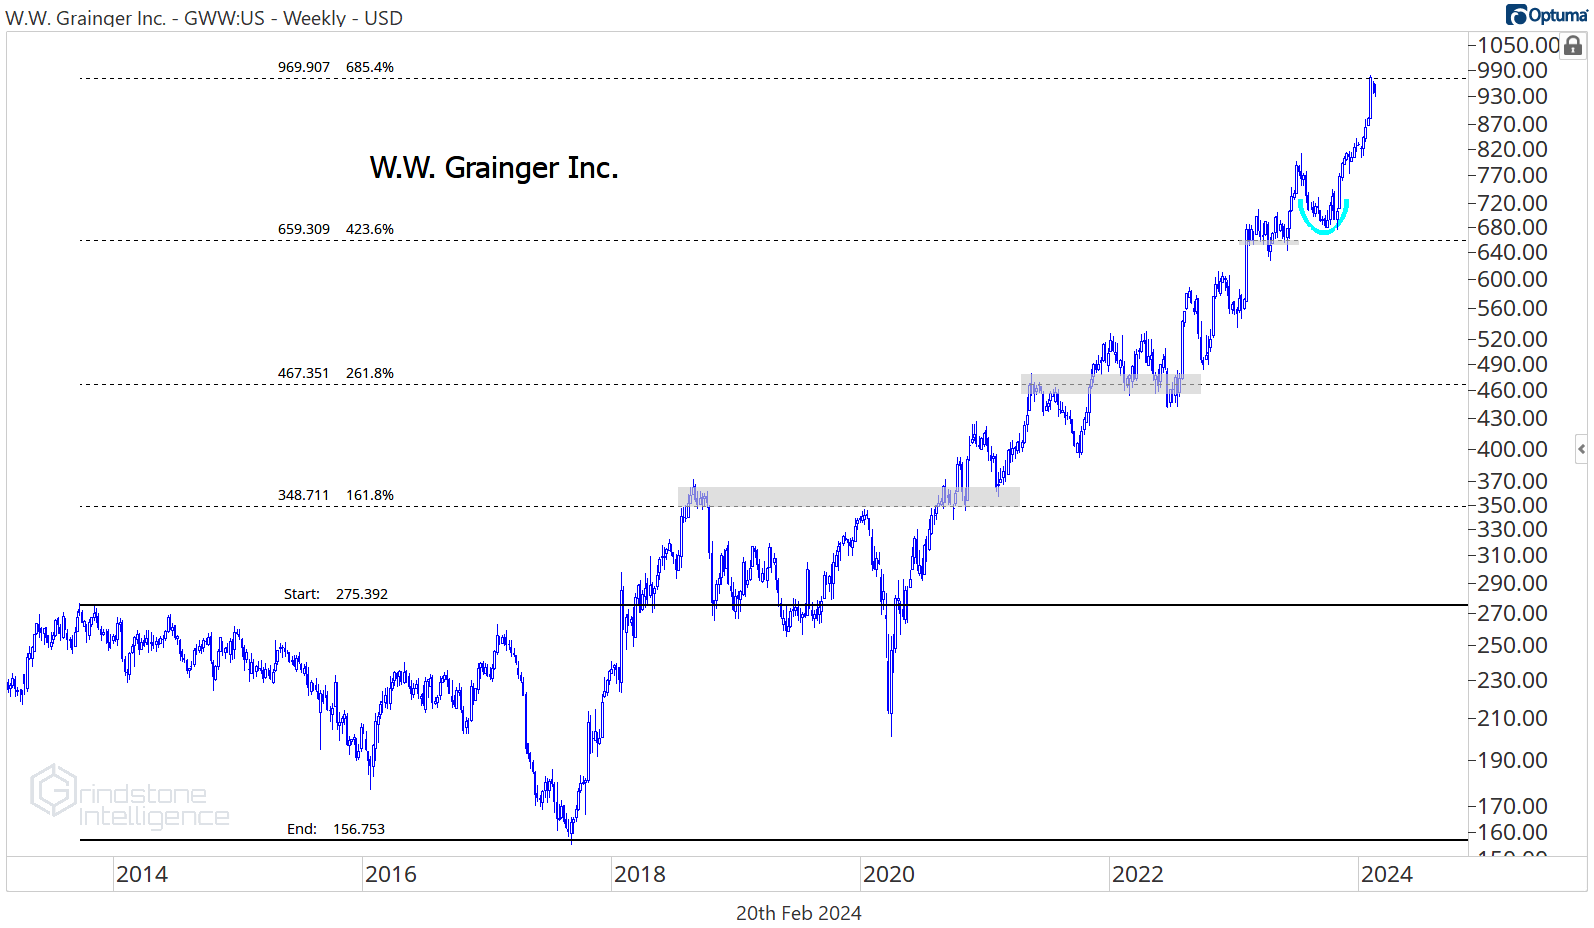
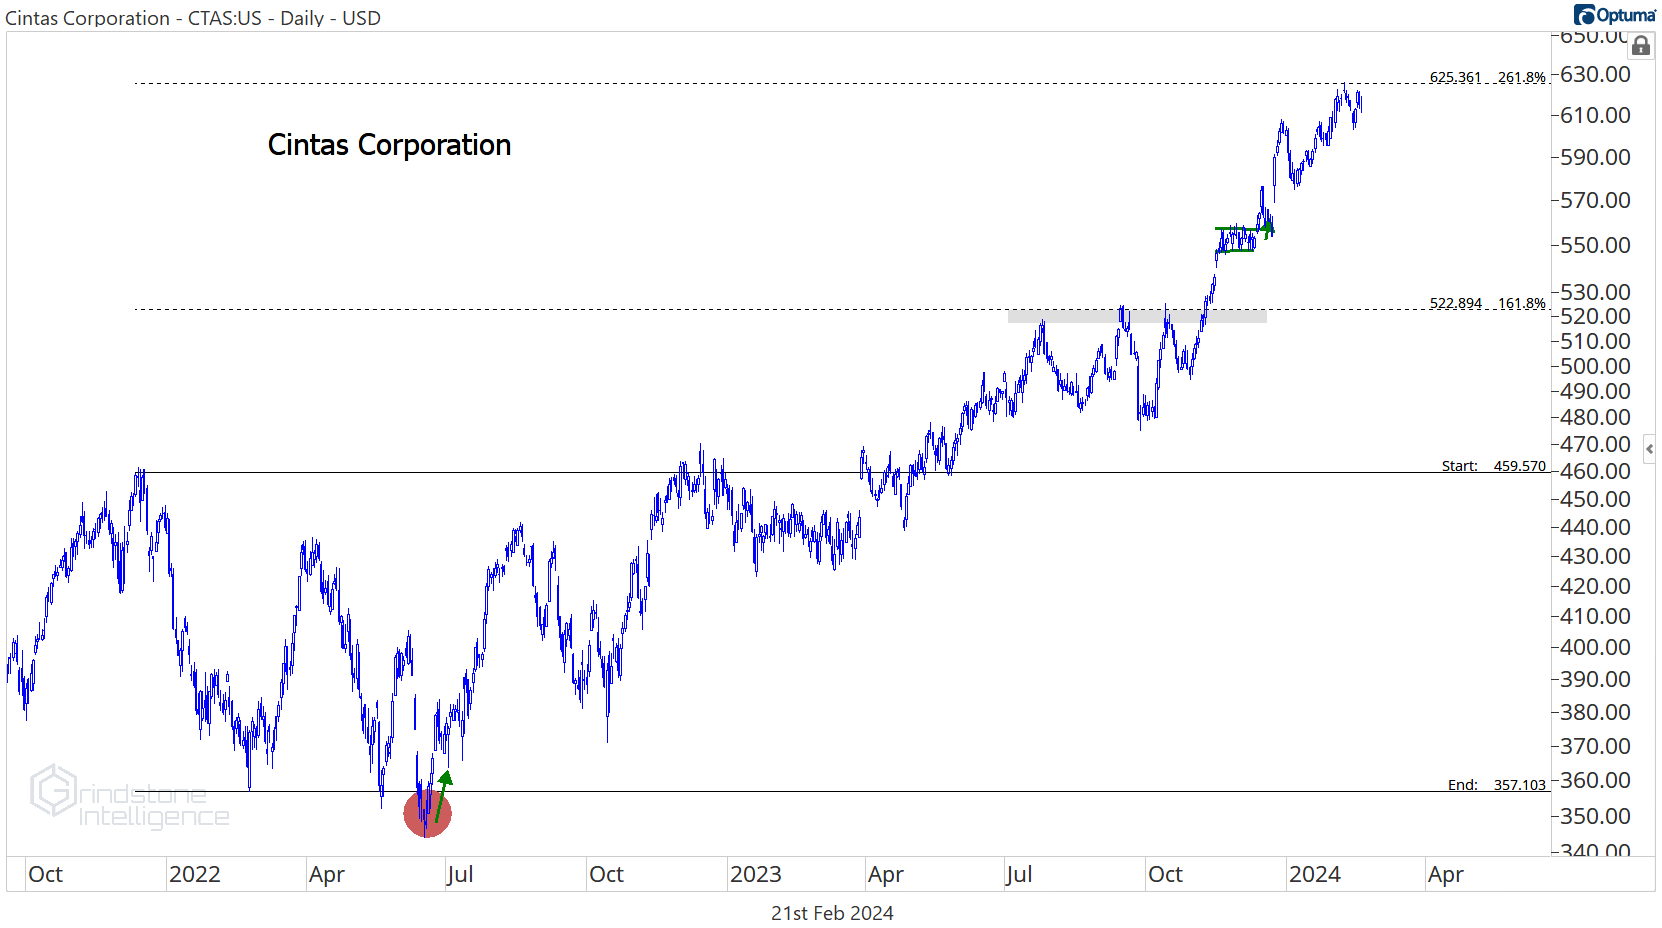
The same goes for Cintas. Both GWW and CTAS are still in long-term uptrends and they’re still showing relative strength, so we definitely don’t want to be betting against them. But we want to see how they handle these potential areas of resistance before initiating new buys.
Trane is very much the same, with one small difference. TT is consolidating above our former target.
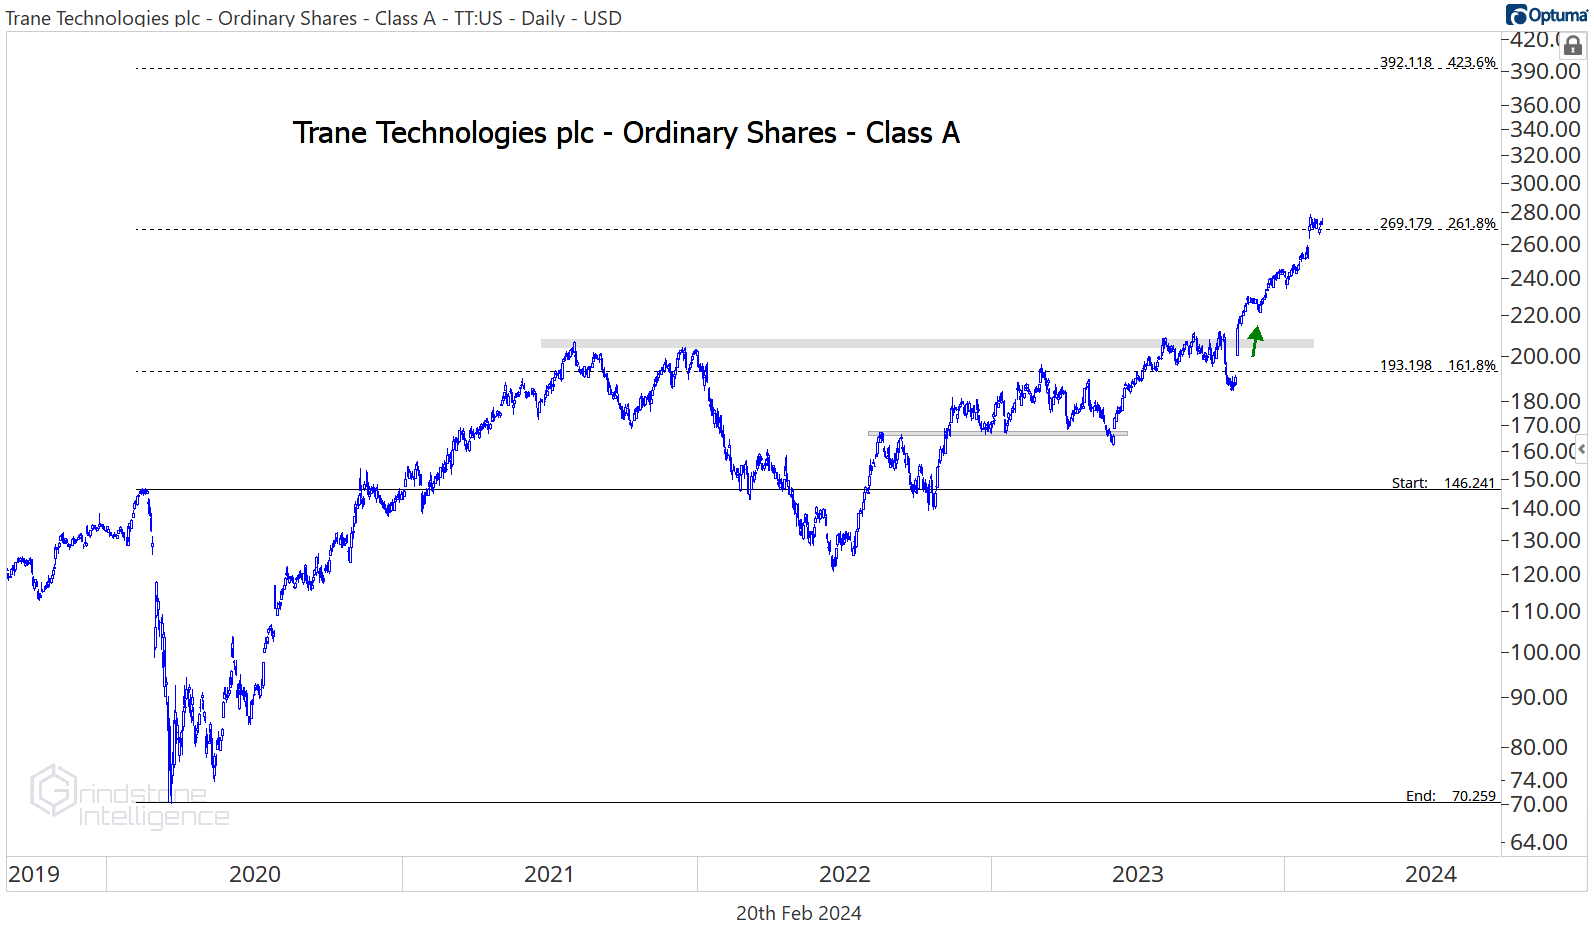
The risk/reward here is skewed in our favor. We can be buying Trane above $268 with a target up at $390. But we only want to be long above $268.
Until next time.