Bullish Momentum Divergences vs. a Bear Market
Stocks rallied from 12-month lows to turn in their best week in over a year. The momentum helped May to end on a positive note, with the S&P 500 closing higher than it did in April even after equities fell for 7 straight weeks. The question at top of mind for many investors is this: Was that the bottom for stocks, or just a bottom?
I don’t know the answer, of course, and neither does anyone else. But I can say that last week’s rally took place at important levels for a variety of industries, and momentum has shown significant improvement.
Within Information Technology, the index’s largest sector, Software stocks successfully tested their September 2020 highs. It may not look like much on the chart below, but September 2, 2020 was a major turning point – it’s the day Growth peaked relative to Value. Software holding that level is a big deal, and doing so while 14-day RSI stayed out of oversold territory is a helpful sign for price stabilization.
The Electronic Equipment, Instruments & Components industry has shown similar momentum improvement, and prices are holding above the 161.8% Fibonacci extension from the COVID selloff. Notice that this group peaked at the 261.8% extension of that decline. The market respects these levels, so this is a logical place for the current selloff to find some buyers.
Similarly, IT Services put in a bullish momentum divergence at the 161.8% extension from its 2018 selloff. That’s a level that caused reversals in 2019 and 2020, and again earlier this year.
Hotels didn’t get oversold earlier this month while testing their January 2018 highs. The area near those highs was trouble during the post-COVID advance and worked well as support during successive backtests in the fall of 2020. It’s a logical level for the industry to find support again.
Internet Retail briefly erased all of its gains from the past 3 and a half years. The industry is rebounding from the 8200 level, which was the peak in 2018 and 2019. By no means is this group out of the woods, but holding support is an important first step.
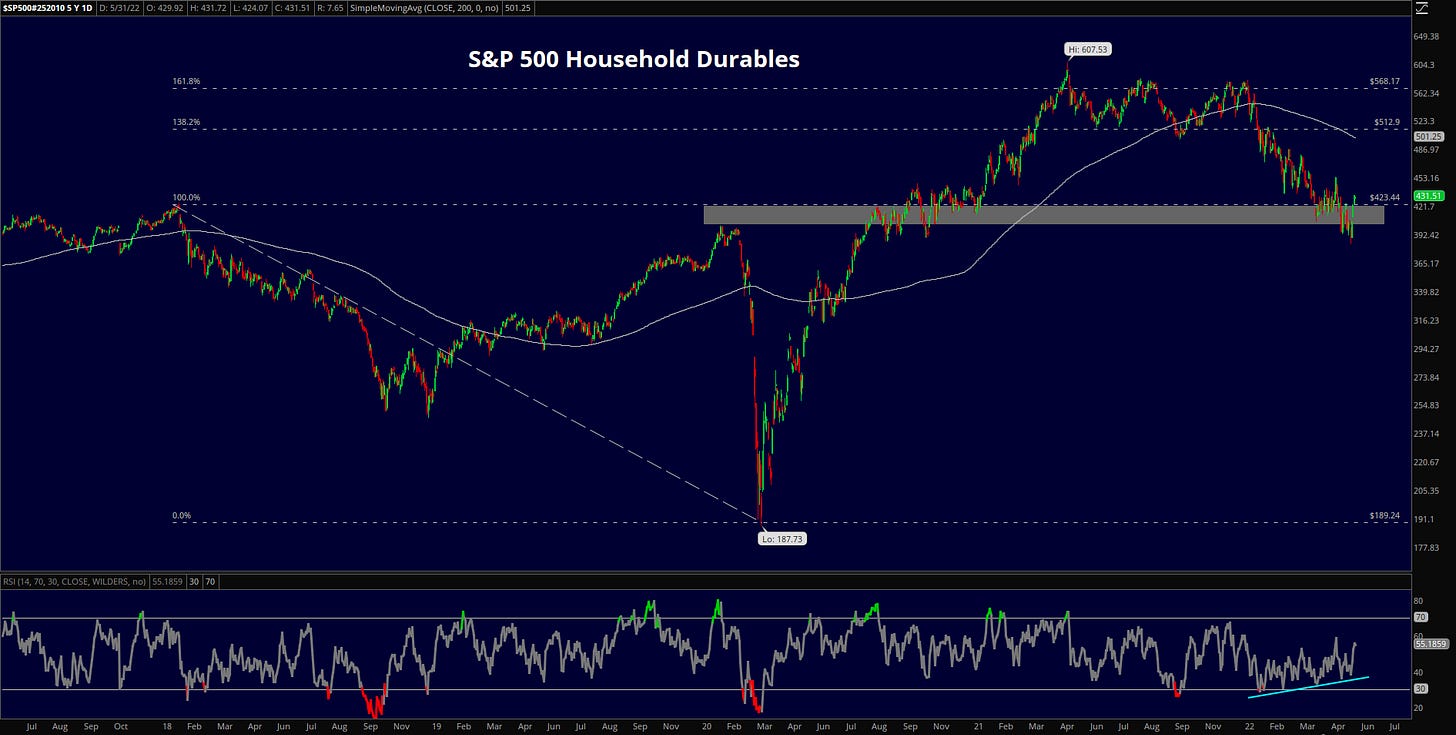
Momentum for the Household Durables industry has been improving for most of the year. This is a great example of why it’s important to wait for confirmation before getting too excited about bullish divergences – prices have continued to fall. The January 2018 and February 2020 highs could be the base that’s needed for buyers to step in.
Those pre-pandemic highs are important for Auto Components, too. The 14-day RSI stayed out of oversold territory when prices were hitting new 52-week lows in early May. After last week’s strength, though, the industry finds itself in back above support. As the saying goes, from failed moves often come fast moves in the opposite direction.
The Banks have one the messiest charts out there. This group can’t seem to get anything going, even though rates have been on the rise and that’s supposed to be a good thing for margins. But prices seem to have finally found some support at the 61.8% retracement of the 2018 selloff, and momentum stayed above 30 for the entire month of May.
Within the Health Care sector, Life Sciences, Tools & Services is responding to the 423.6% extension from its 2018 decline. That level worked nicely as rotation in the back half of 2020 and would make sense as a level to advance from again.
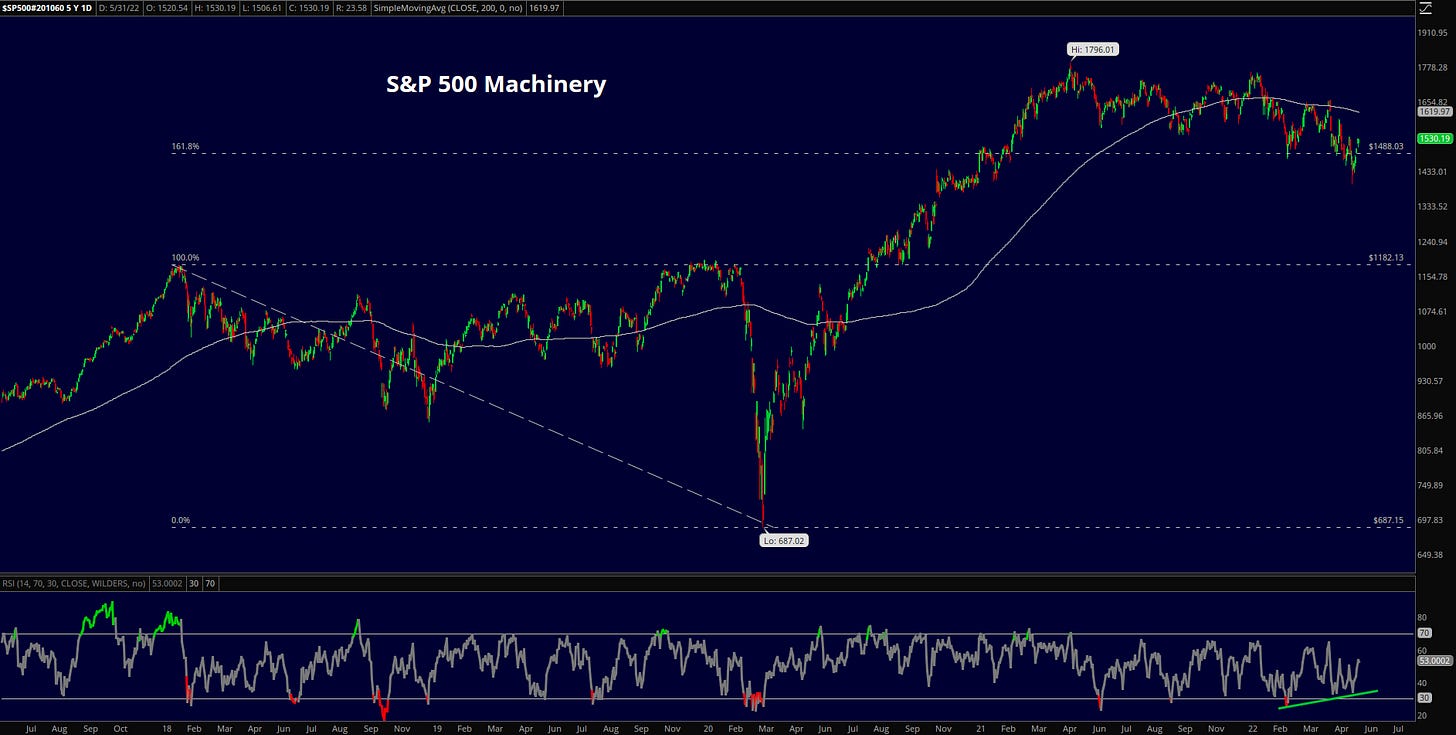
For Machinery stocks, keep an eye on the 161.8% extension from the 2020 collapse.
And for the Personal Products industry, the pre-COVID peak is the level to watch.
Improving momentum wasn’t limited to stocks – Bitcoin rallied yesterday from support at 30,000. Bitcoin has been a relatively good indicator for risk appetite in recent years, so seeing the cryptocurrency rebound and confirm the improvement in 14-day RSI is a positive sign for stocks. The area near 40,000 will likely act as resistance – both technically and psychologically – on further gains in the near term.
So do all these positive developments mean we’ve seen the lows for stocks this year?
Maybe.
Momentum divergences can signal major reversals. But trends are called trends for a reason, and the trend is still down. Don’t believe me? Scroll back through the charts above. In each case, price is below a downward sloping 200-day moving average. And despite positive momentum divergences, momentum is still in a bearish range (RSI isn’t reaching oversold territory on advances).
Rallies sparked by momentum divergences are mean reversions until they’ve proven otherwise.
Nothing in this post or on this site is intended as a recommendation or an offer to buy or sell securities. Posts on Means to a Trend are meant for informational and entertainment purposes only. I or my affiliates may hold positions in securities mentioned in posts. Please see my Disclosure page for more information.
The post Bullish Momentum Divergences vs. a Bear Market first appeared on Grindstone Intelligence.


