Defining a Downtrend
I spend a lot of time on this blog talking about trends. The word ‘Trend’ is in the name, after all.
Charles Dow wrote about price trends at the turn of the 20th century, and his market musings form the cornerstone for much of modern-day technical analysis. Though ‘Dow Theory’ is most often associated with his observation that the Industrial and Rail averages should confirm each other, Dow’s contributions are more broad. His widely read works describe the most basic aspects of price trends.
Uptrends are marked by higher highs and higher lows, and downtrends the opposite. The market has three trends at all times – the primary, secondary, and minor – and each has three phases, accumulation, public participation, and distribution. Most importantly, a trend is in effect until we have definitive signs that it has reversed.
We work to identify trends for a very simple reason: as Mr. Dow posited, they tend to continue more often than not. Thus, knowing the underlying direction of those trends can give us an edge in investment decision-making. The hard part is accurately identifying reversals.
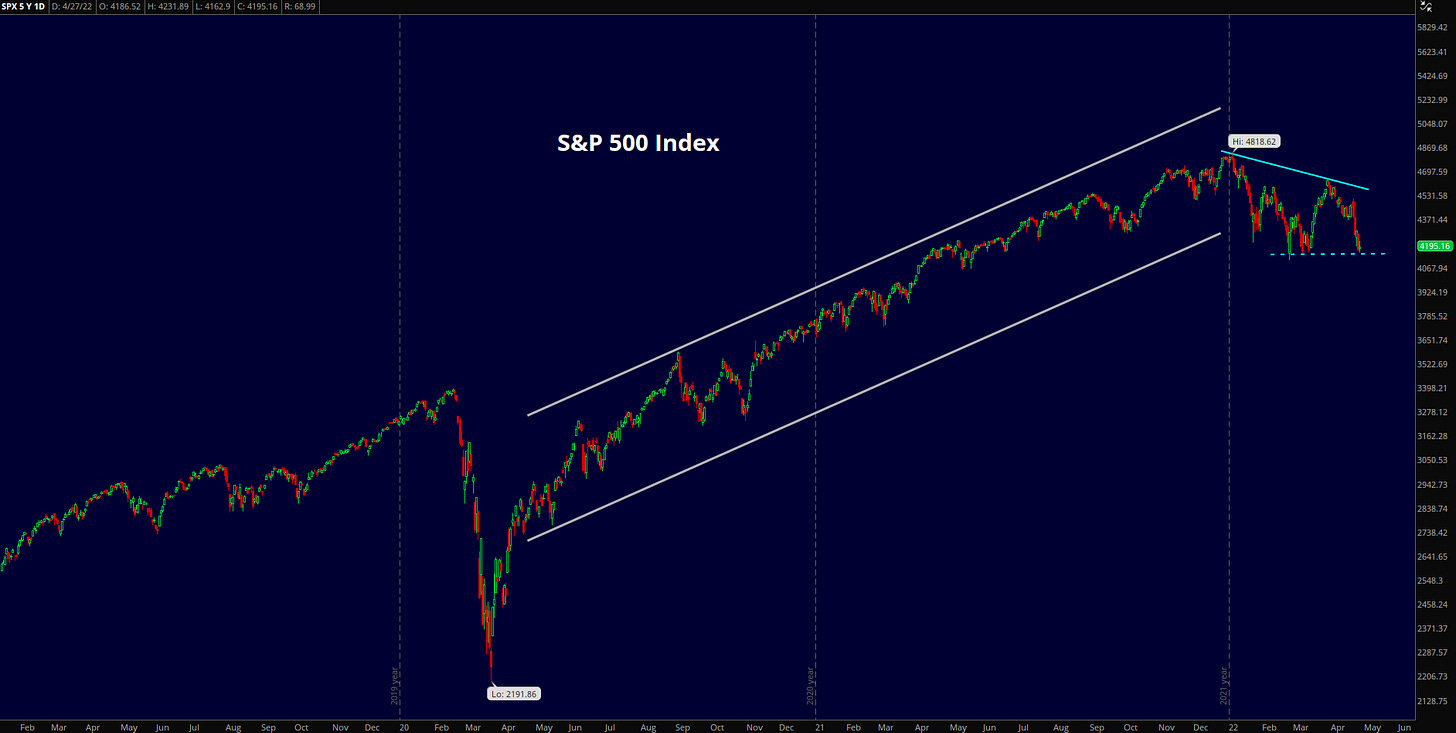
From the 2020 lows, there’s no doubt that U.S. stock indexes were in an uptrend. Each pullback held above previous lows, and each successive rally pushed prices to new highs. The picture is a little less clear today.
Since setting a peak at year-end, the S&P 500 index has drifted steadily lower. It clearly set a lower high at the end of March. Now the question is whether we see a definitive lower low. With the index testing support at 4150, we may have an answer before the week is up.
The Nasdaq Composite has been moderately worse than the U.S. large cap benchmark. It already set a few lower lows and sits near the worst level in over a year. If the Nasdaq manages to find support here at the March 2021 trough, then Dow might call this the end of a secondary downtrend that lasted a few months. The primary trend – one that lasts for years or more – would still be upward.
If the Nasdaq follows the example of small caps, though, this selloff may have more room to fall.
The Russell 2000 failed to participate in most of the 2021 rally – prices weren’t moving lower, but they weren’t moving up either. Despite the lack of progress, Charlie Dow’s tenets indicated the uptrend was intact throughout the year, because there was no definitive evidence of a trend reversal.
Evidence arrived in 2022. The Russell 2000 broke the 2021 lows within the first few weeks of the new year and broke down further this week.
With major indexes sending mixed (or perhaps just incomplete) signals, it helps to look below the surface. After all, it’s not a stock market. It’s a market of stocks.
We also have a few more tools than Uncle Charlie did in his day. That means we can look for more than just higher highs to evaluate trends.
One easy way to categorize trends is to use moving averages. A stock above a moving average is generally considered to be in an uptrend, especially if that moving average is also rising. Today, more than 80% of stocks are below their 20-day average and well over half are below their 200-day. That’s not a positive sign for stock market bulls.
The damage is most severe in growth-oriented sectors. Defensively oriented sectors, namely Consumer Staples and Utilities, have held up a bit better.
The cumulative Advance-Decline line for NYSE stocks stopped rising almost a year ago. This index calculates the difference between the number of advancing and declining issues each day, then adds the difference to the previous day’s value. During a healthy market advance, we should expect more stocks to be rising than falling, causing the A/D line to rise, too. Instead, the A/D line stalled last year while large cap indexes rallied for several more months.
And now, the A/D line is setting new lows.
New highs are another useful trend gauge. They can only result from rising prices, and they’re much easier to count than Dow’s higher highs and higher lows. Unfortunately, new 52-week highs have been completely overshadowed by new 52-week lows. The Russell 3000, which includes the vast majority of publicly traded U.S. equities, has seen more than 500 stocks set new lows on 3 distinct occasions this year. The number could easily top 1000 if stock indexes break their March lows.
The uptrend that began at the COVID lows is under attack. How worried should we be? Are U.S. stocks in a downtrend?
Nothing in this post or on this site is intended as a recommendation or an offer to buy or sell securities. Posts on Means to a Trend are meant for informational and entertainment purposes only. I or my affiliates may hold positions in securities mentioned in posts. Please see my Disclosure page for more information.
The post Defining a Downtrend first appeared on Grindstone Intelligence.


