Energy Sector Outlook
A breakout we can't ignore
Is this finally the time for Energy stocks?
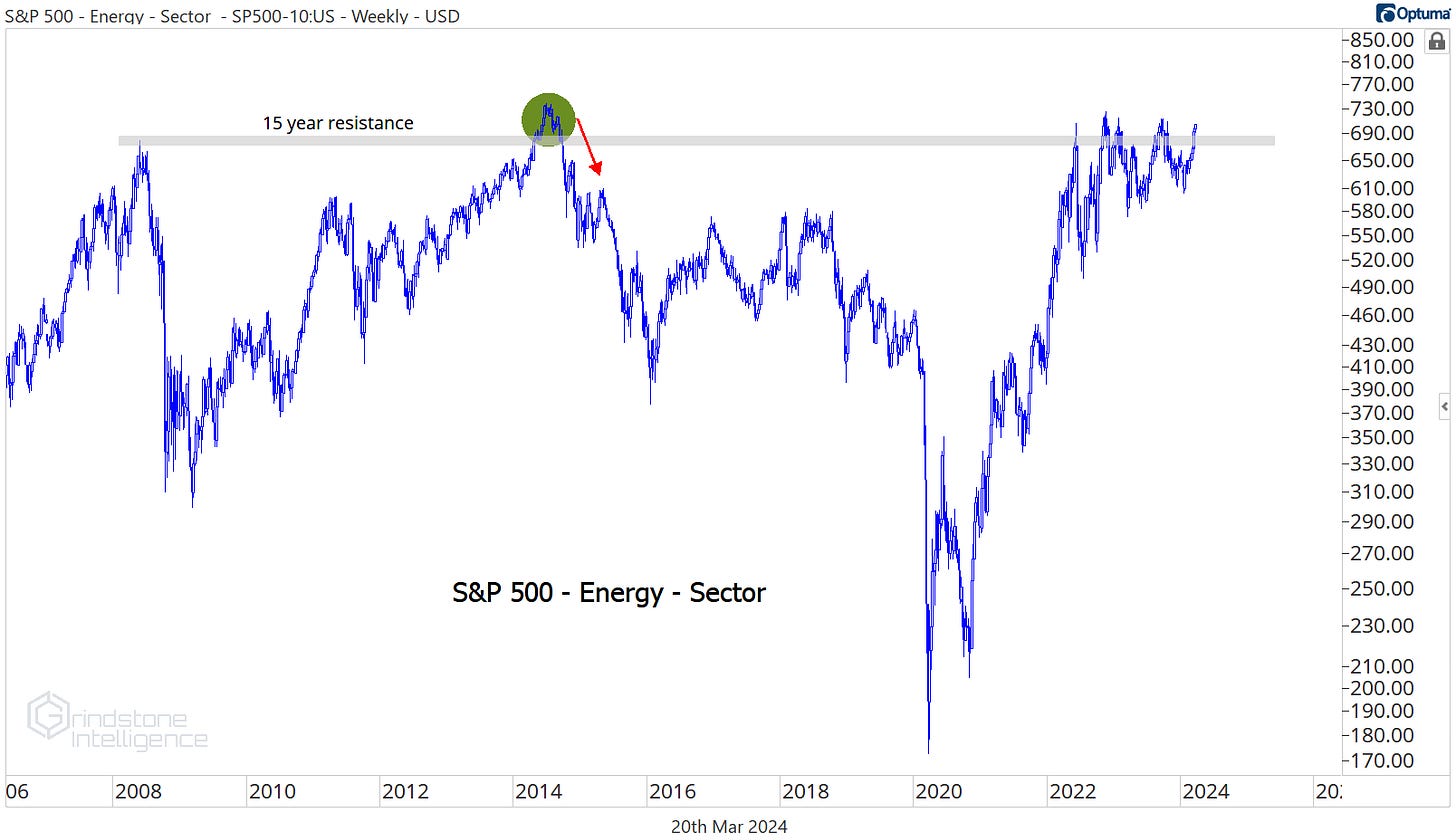
We’ve been dealing with stiff resistance at the 2008 and 2014 highs for the better part of the last 2 years, and while the bulls haven’t been able to gain any ground, the bears haven’t been able to capitalize, either.
Over that period, we’ve been better off avoiding Energy stocks. No, the sector hasn’t been falling apart, but the rest of the market has been off to the races. There’s opportunity cost in owning something that’s stuck in the mud during a bull market. Since stocks bottomed back in October 2022, Energy’s 14% gain has been tripled by the benchmark S&P 500 index. Only the Utilities sector has been worse.
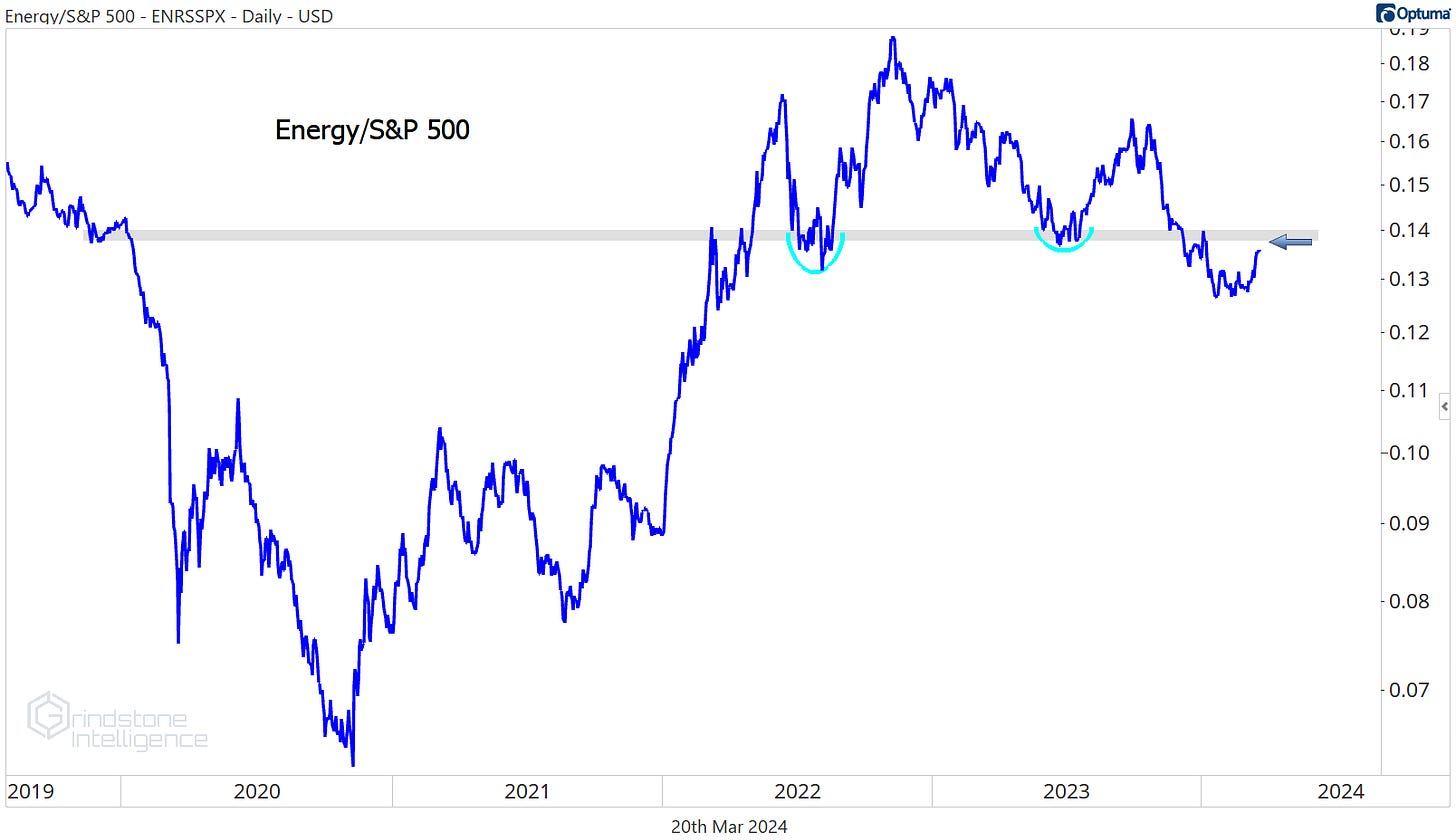
That relative weakness pushed the Energy/S&P 500 ratio below support from its summer 2022 and 2023 lows - a level that also sparked a major downside acceleration in early 2020.
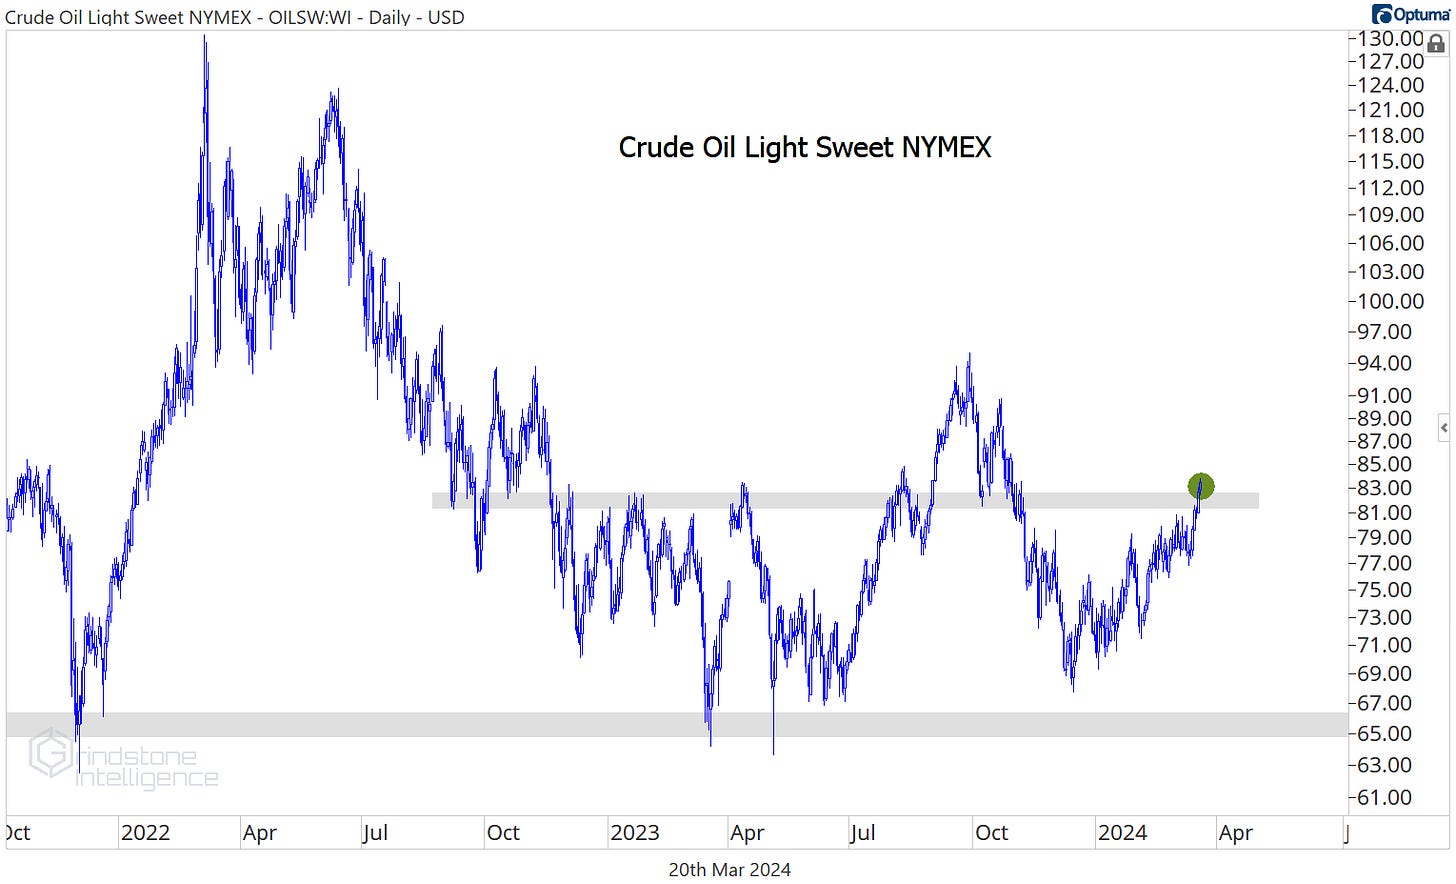
Over the last two weeks, though, we’ve started to see a shift in market leadership. Not only have the growth-oriented sectors begun to stall out, commodity prices are surging. Crude oil is back above a key rotational level at $82.
We can no longer attribute crude’s year-to-date rally to fluctuations within a trading range. This is a breakout we have to respect. And as long as crude oil is rising, Energy stocks are likely to follow.
Here’s a closer look at the sector over the last few years. In our mind, this is pretty simple. If XLE is above $93, we need to be betting on higher prices for Energy stocks.
Seasonality couldn’t be more favorable right now, either. Energy has outperformed the rest of the market on average in February, March, and April since 1990. In April, Energy’s best month, the Energy/S&P 500 ratio has risen an average of nearly 2%, and climbed in two-thirds of all observations.
The strength is broad, too. 96% of all S&P 500 Energy stocks are above their 50-day moving average - the best mark of any sector. On a 100 and 200-day basis, only the Financials are showing more underlying strength.
Check out the equally weighted Energy sector compared to the equally weighted S&P 500 on the daily Relative Rotation Graph below, and the shift is clear. Energy didn’t even reach the ‘Lagging’ quadrant on the most recent pullback.
The stars are lining up. We’ve got a tailwind from commodity prices, favorable seasonality, and bullish breadth. The question now isn’t really how much we like the Energy sector, but which stocks in Energy we like the most.
Let’s dive in.
Digging Deeper
The refiners have undoubtedly been the place to be over the last year. They’ve climbed 50%, far outpacing the gains of the Energy sector overall.
It’s not just the refiners that have done well, though. In fact, every sub-industry but one (we’re looking at you Integrated Oil & Gas) has outperformed the sector as a whole. The one that really catches our eye is this move in Oil & Gas Storage & Transportation. We’re still waiting for the XLE to break out to new highs, but these guys are already there.
The setup in ONEOK is really interesting as it challenges the 2019-2020 highs. This is a huge base, and we love stocks coming out of big bases. If OKE is above $78, we want to be buying it with a target of $118, which is the 161.8% retracement from the 2020 selloff.
Leaders
Marathon Petroleum is a whisker away from hitting our target of $200, which is the 261.8% retracement from the 2018-2020 decline. This isn’t the place to be initiating new positions, as we watch and see how it responds to this potential area of resistance.
That doesn’t mean we’re kicking MPC to the curb completely, though. Few stocks have shown more relative strength than this one - it just hit new all-time highs compared to the S&P 500.
Strength tends to beget strength. We still want to be looking for ways to get long MPC, we just want to do it in a way where we can manage the risk. That happens on a sustained move above $200. If prices are consolidating above our former target, we like it long with a new target of $312.
Sticking with the refiners. Phillips 66 (PSX) already hit our target of $150. But Valero is just getting started. Here it is coming out of a 5 year base relative to the rest of the Energy sector.
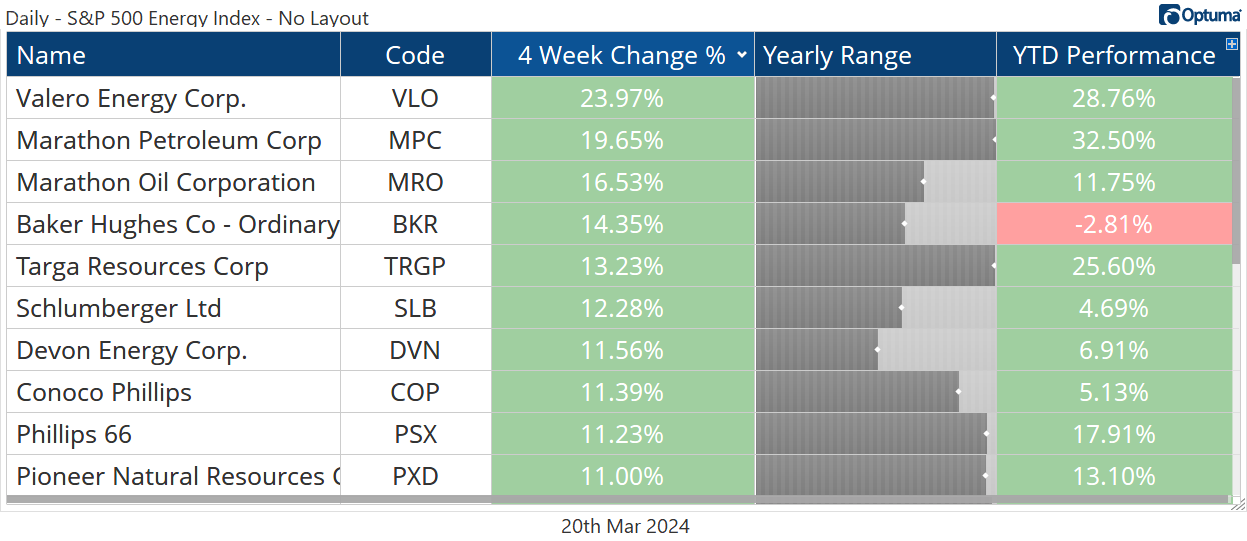
The 24% rally in VLO over the last 4 weeks sent this one to all-time highs, and the risk/reward setup isn’t too clean right now. We want to take advantage of any pullbacks towards the breakout level near $150, though, with a target up near $175.
Targa, meanwhile, continues to be one of our favorites. This is a perfect example of why we focus so much on relative strength. Early in the year, we were pointing out that Targa was holding up better than the rest of the Energy sector, which meant it was likely to outperform if Energy stocks as a whole started to rise. That’s exactly what we got.
After a few days of consolidation above our initial target of $96, which allowed us to set a new risk/level and target, TRGP began another leg higher. We still think it goes to $120.
Losers
Only one Energy stock failed to gain ground over the last 4 weeks. EQT dropped 0.5%.
No, that’s not a catastrophic decline. But remember, stocks have been rallying over that period. And that relative weakness pushed EQT to new 52-week relative lows.
Chevron could be the next to break down. Compared to the rest of the Energy sector, CVX is approaching its lowest level since 2018.
This isn’t us saying we want to be shorting Chevron. The stock on its own is doing just fine since finding support at the 2022 lows.
And in all likelihood, CVX is going to rise along with the rest of the Energy sector if oil prices continue to rise. But we don’t want to just be buying things that are poised to rise. We want to focus on the things that are likely to rise the most. And that means the ones showing relative strength.
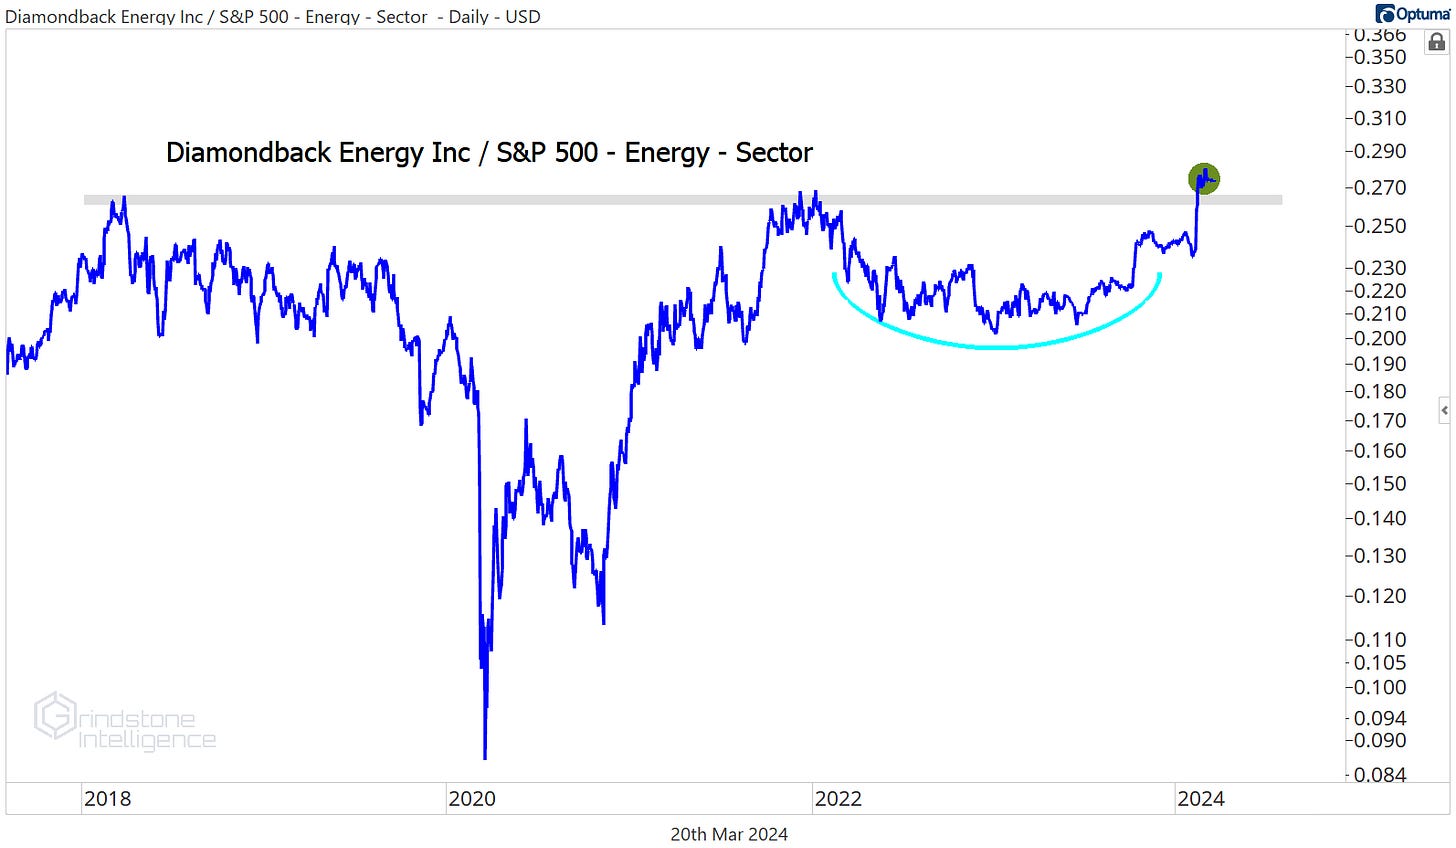
Like Diamondback Energy. Check out this beautiful 5 year base breakout for FANG vs. Energy.
FANG is approaching the 161.8% retracement from the 2022 decline, which could act as resistance. We want to see it absorb any potential selling at that level first, but then we like it long above $200 with a target of $250.
One more to watch
More often than not, trends continue rather than reverse. That doesn’t mean trends never reverse. Look at Williams Cos relative to the rest of the sector. From the 2020 highs, WMB was a textbook example of a downtrend - lower highs and lower lows, stuck below a falling 200-day moving average. Today, the opposite is true.
We really like the setup here as WMB tries to break out of a 2 year base. We want to be buying that breakout when it comes, and owning the stock above $38 with a target of $44.
That’s all for today. Until next time.


