Everything That Glitters - 1/23/2024
Checking in on commodities
We’ve been waiting on the breakout for months, and it still hasn’t come.
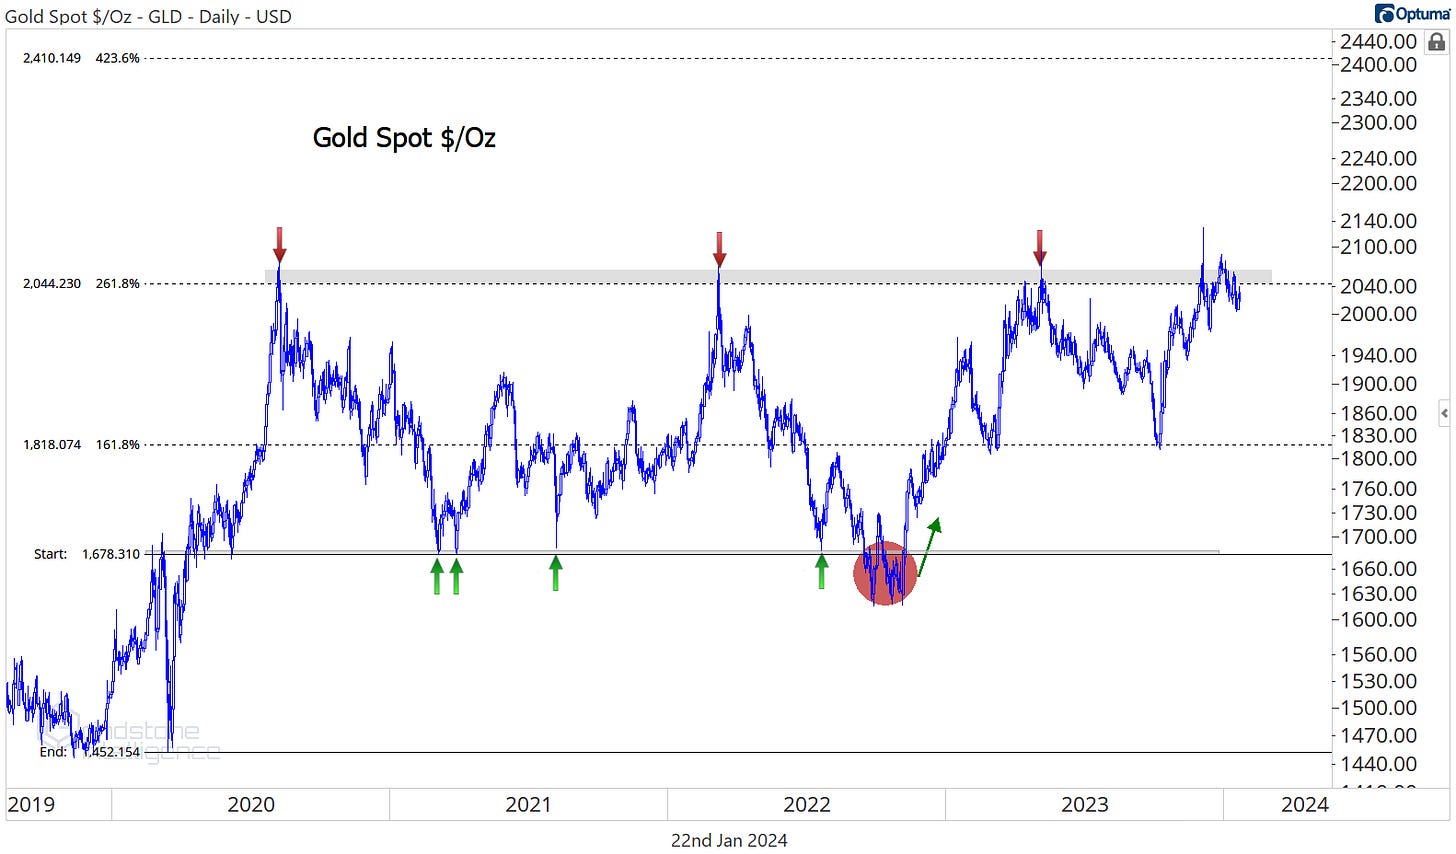
For the last three and a half years, gold prices have been stuck below $2,050, a level that is also the 261.8% retracement from the COVID selloff in March 2020. Between those pre-COVID highs at $1,680 and resistance at $2,050, the yellow metal has bounced back and forth, digesting the gains from 2015 to 2020 and generally frustrating everyone that has been involved.
Eventually a resolution must come, though, one way or the other. And now that we’re testing the upper band of this trading range for the fourth time, the likelihood of a bullish outcome has never been higher. On a break above $2,050, we want to be buying gold with an initial target of $2,400.
That initial target, derived from the 423.6% retracement of the 2020 decline, would be a welcome development for the bulls, but it’s a rather conservative outcome from a big picture point of view. We’re eying $3200 longer-term. That’s the 1794% Fibonacci retracement from the 1990s decline. Prices have respected these retracement levels all the way up: The hiccups in 2006 and 2008 occurred near Fib levels, the ceiling from 2013-2019 was the 684.4% retracement, and right now, were stuck below the 1109% retracement. It would make a lot of sense to go up and touch the next one. Even $3200 might be a conservative expectation – prices rallied a lot more after the 2004 breakout.
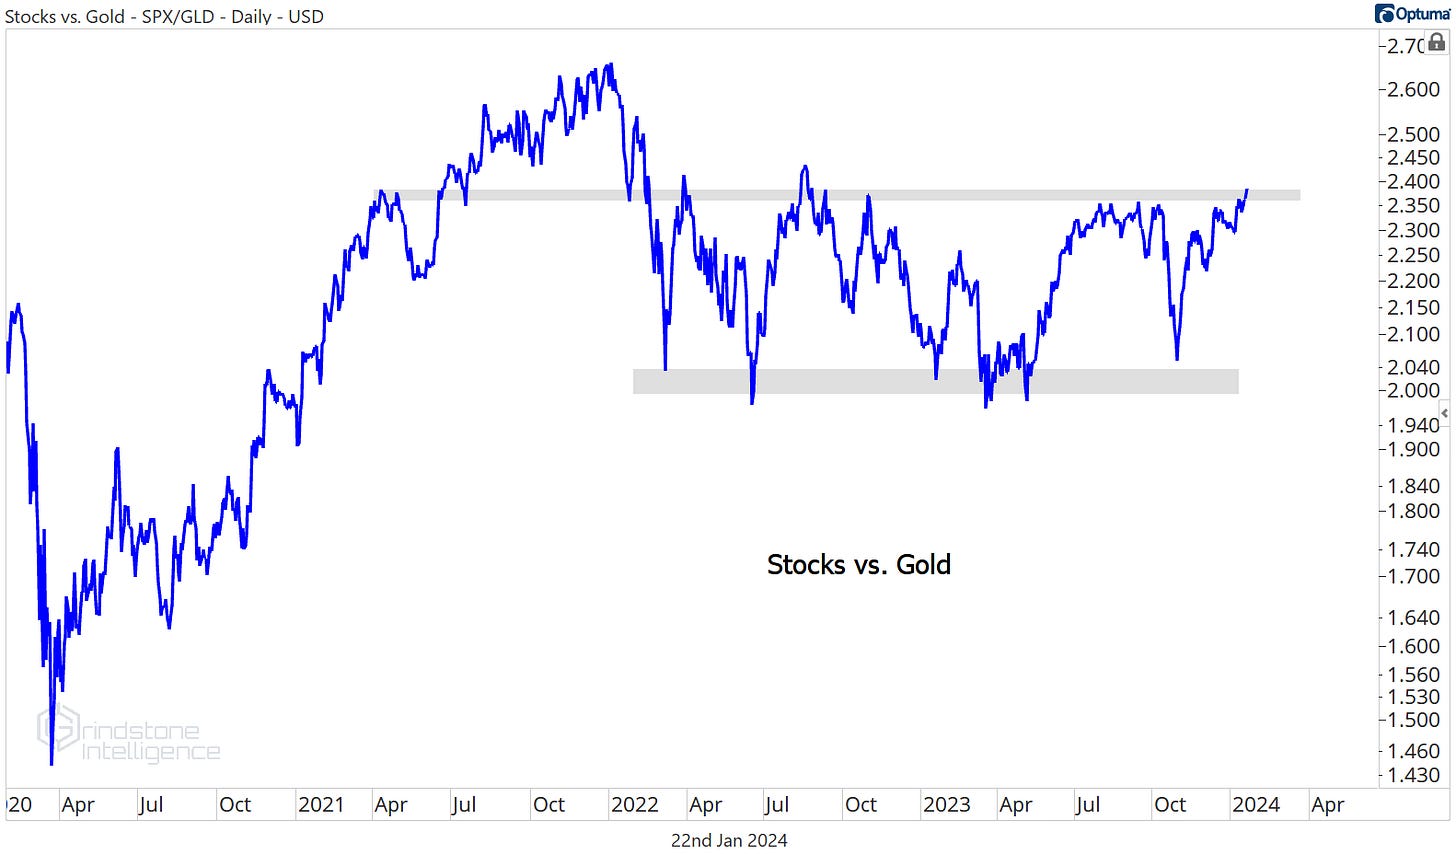
Still, the opportunity cost of holding gold while we’re waiting for the breakout is growing. There’s been no harm in owning gold for the last few years - if the alternative option is to own stocks, there’s been no incremental benefit to holding the S&P 500 instead. The S&P 500 vs. Gold ratio has gone nowhere since early 2021.
Stocks just touched new 52-week relative highs, though, and they’re threatening to resolve higher from that multi-year consolidation range. In that scenario, we definitely need to be favoring stocks over gold.
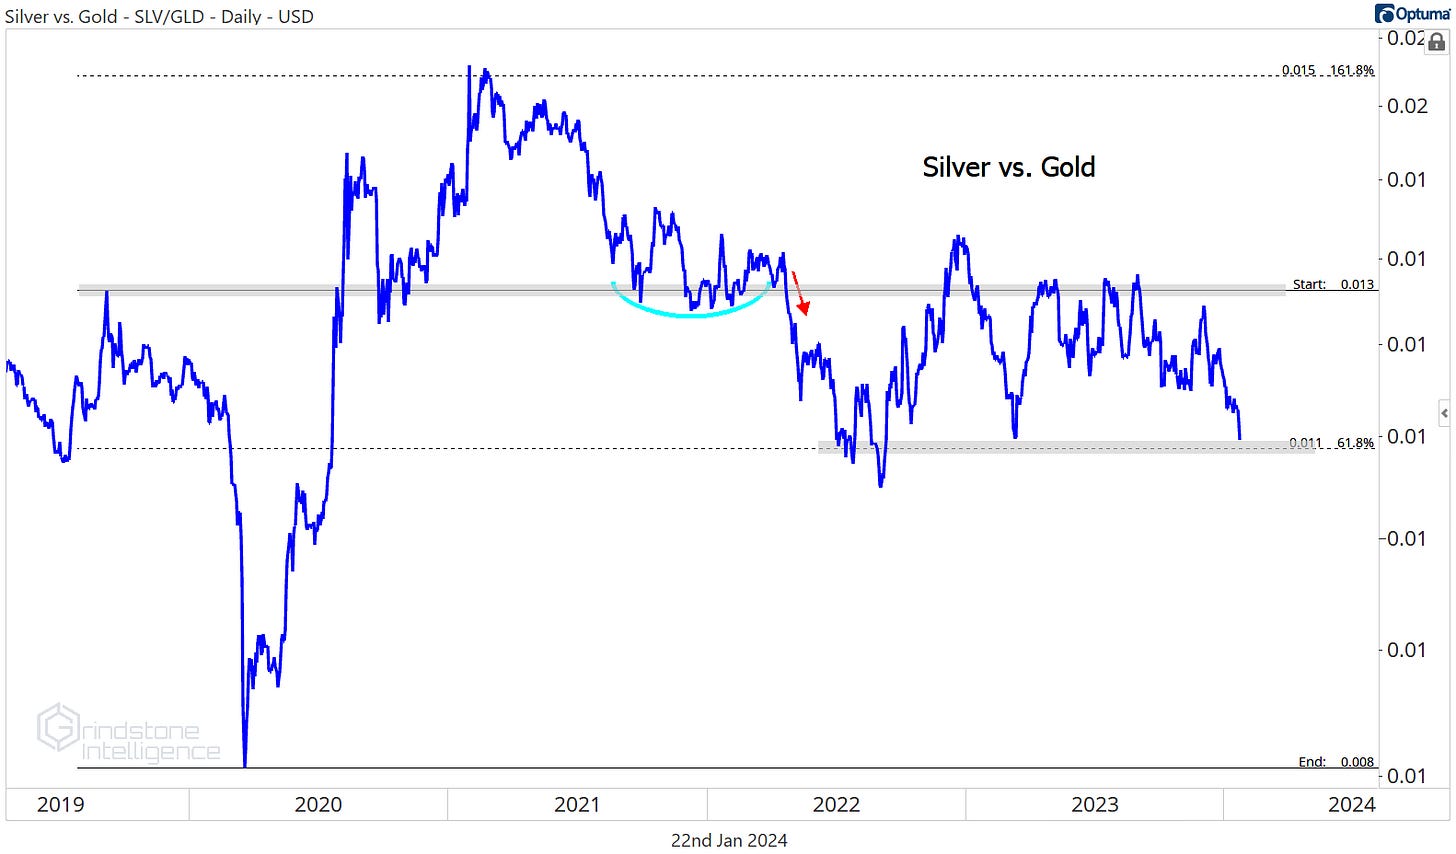
What would it take to turn the tide back in favor of gold? More participation from silver. Prices for silver and gold tend to be highly correlated, but silver tends to move in greater magnitudes. As such, when precious metals are rising, we expect silver to outperform. That’s what we’ve typically seen during gold’s best runs.
In the chart below, which compares the price of silver to the price of gold, silver leadership would mean a line moving up and to the right. Instead, silver has been a laggard for most of the year - right now the ratio is threatening to break down to multi-year lows.
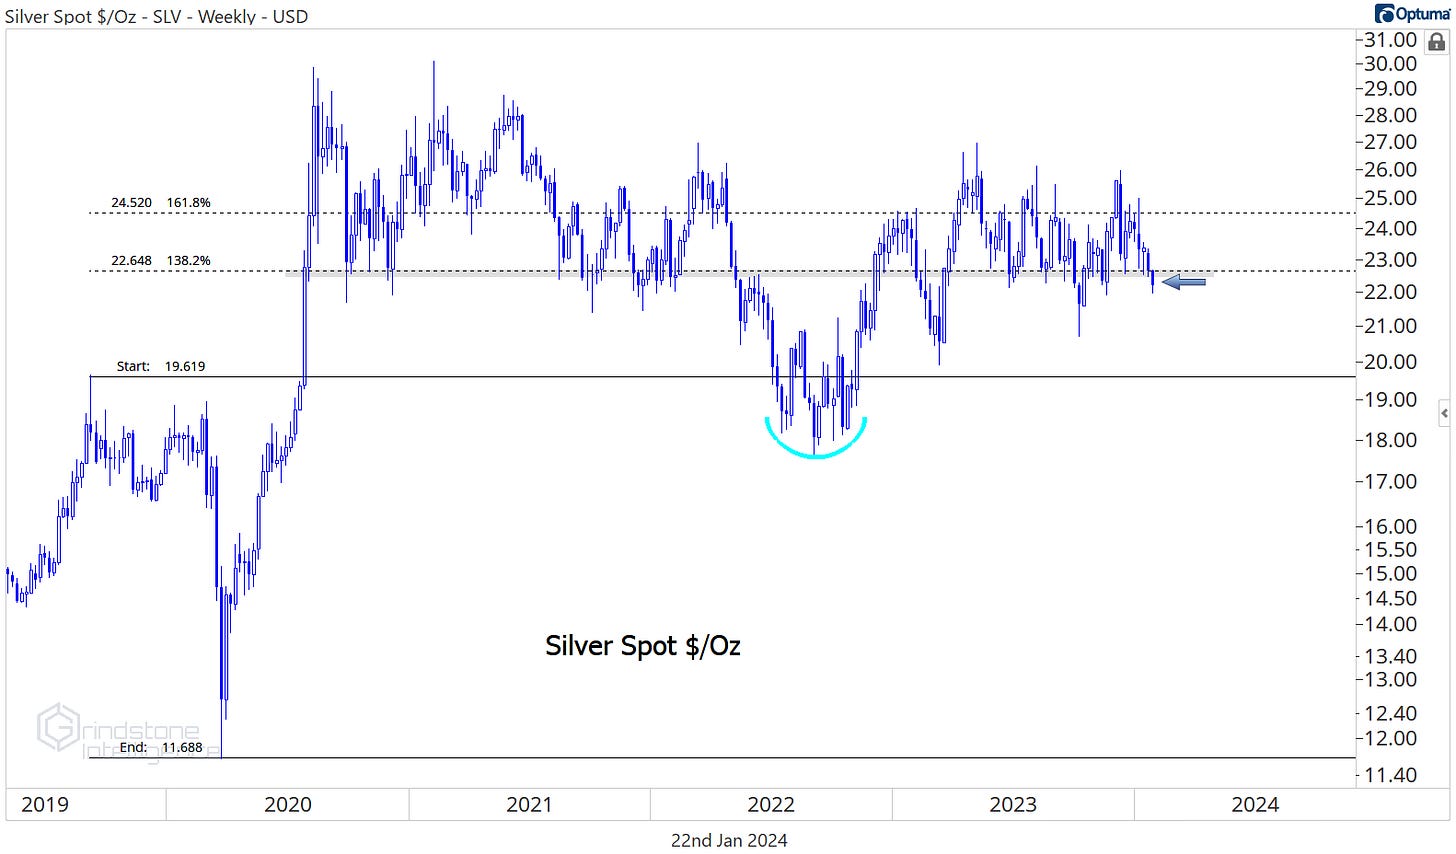
On its own, silver is already breaking below a key support level, the 138.2% retracement from the 2020 decline. That doesn’t bode well for gold’s continued attempt to set new highs. We want to see silver buyers step in here and reclaim that former support level. And sooner rather than later.
Perhaps we shouldn’t lament the lack of strength in precious metals - the base metals are way worse. DBB just broke an 18-month area of support and dropped to 3-year lows. We don’t want any part of that.
If it’s not gold, what about ‘new gold’? Earlier this month, the SEC put years of drama to bed and finally approved the first US-listed ETFs to track the price of Bitcoin. Whether ETF approval proves to be a watershed demand moment or a big nothing burger is really not our concern - we’ll let that debate stay between the Crypto Cult Corp and the Bitcoin Bashing Bros.
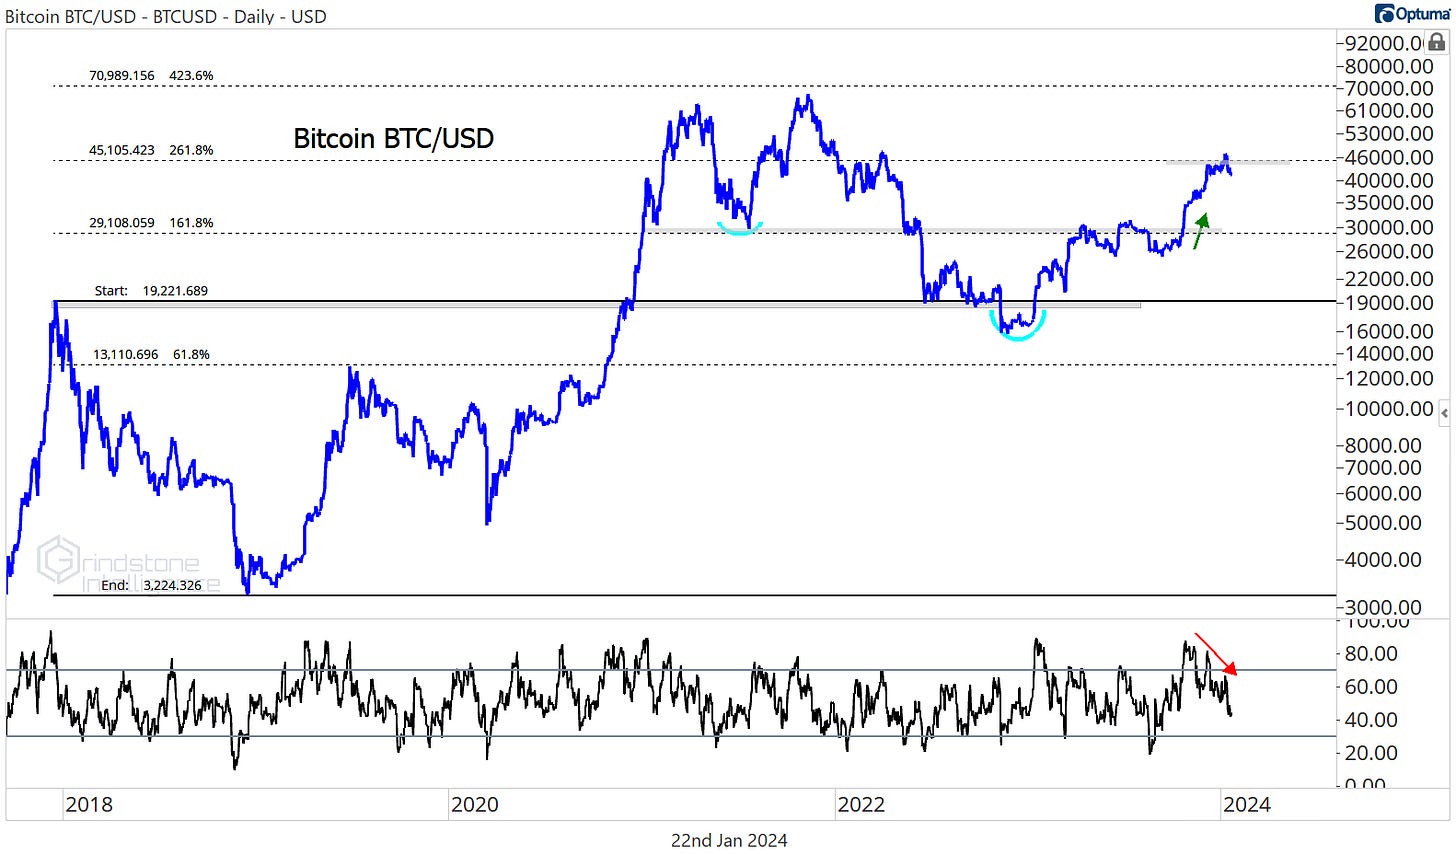
What we do care about is this 45,000 level. Bitcoin ran into resistance at the 261.8% retracement from the 2017-2018 decline back in early December, and we’ve been on the sidelines ever since, watching to see how prices responded to that key level. This isn’t a downtrend that we want to be shorting by any means, but for now, the uptrend has run its course. Momentum failed to reach overbought territory on the latest rally, and it’ll most likely take some time to work off that divergence.
We only want to be buying Bitcoin on a move back above 45,000, and then we’ll have a target at the next key Fibonacci retracement level up near 70,000. In the meantime, it’s not unreasonable to expect a pullback towards 30,000.
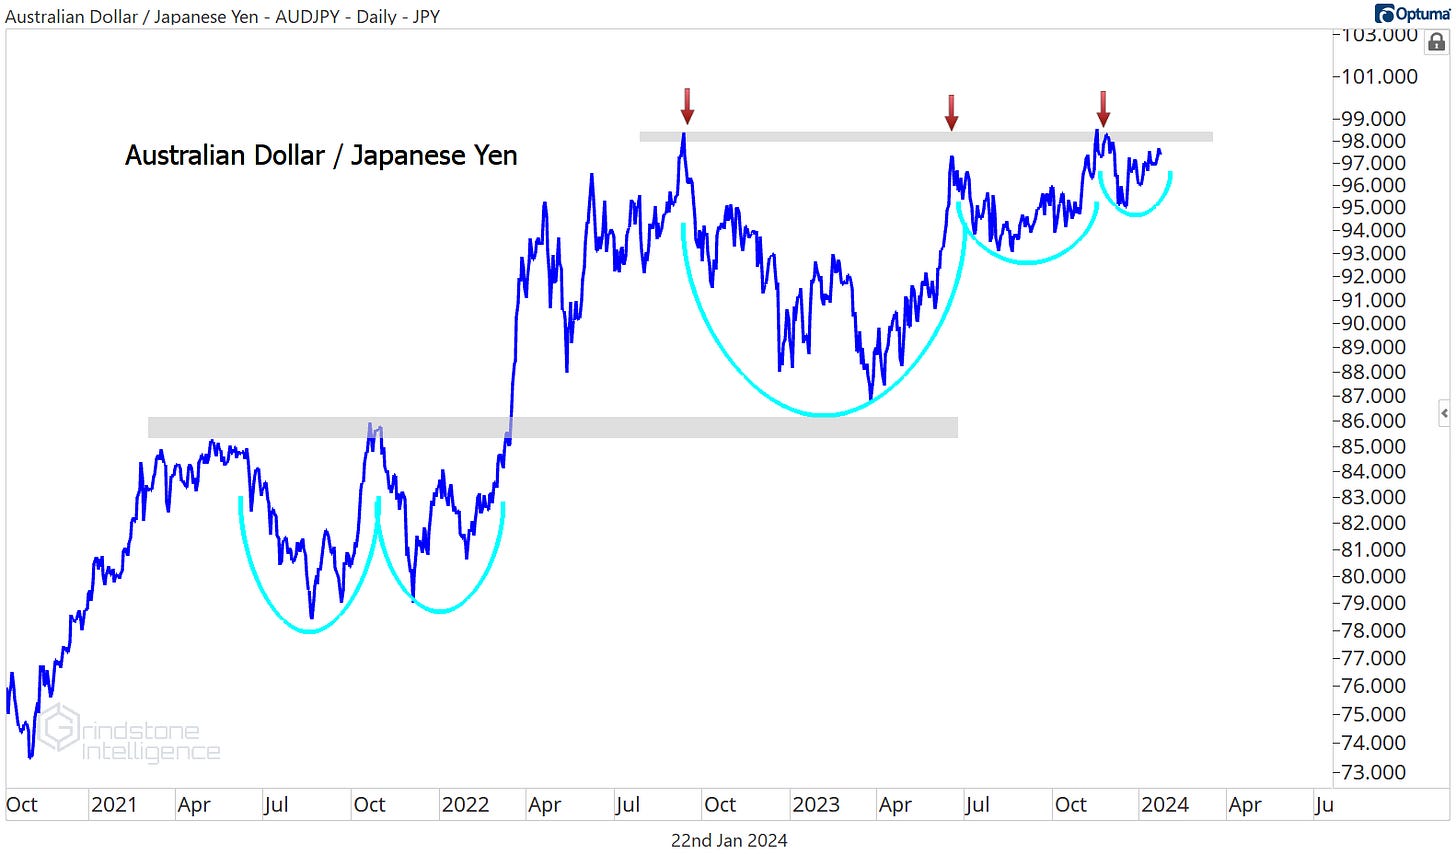
When it comes to the rest of the commodities space, we’re intrigued by this ongoing consolidation between the Australian Dollar and the Japanese Yen. The AUD is considered a risk-on commodity currency and the Yen a safe haven. As such, this cross tends to move with global commodity prices.
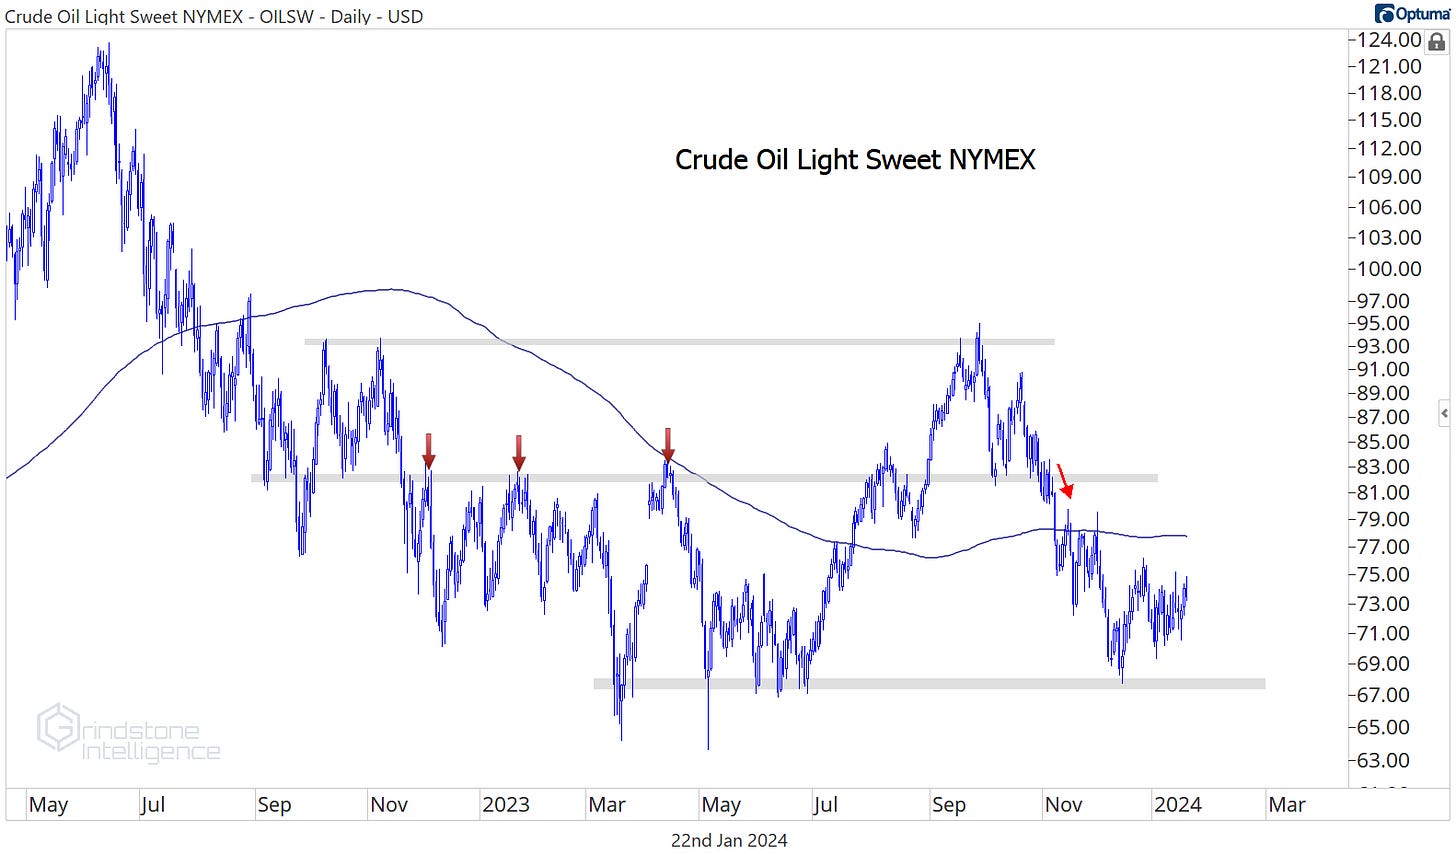
A resolution higher might coincide with some strength in metals and maybe even a failed breakdown in DBB. It might also signal some strength in crude oil, which is stuck in the middle of no-man’s land for now.
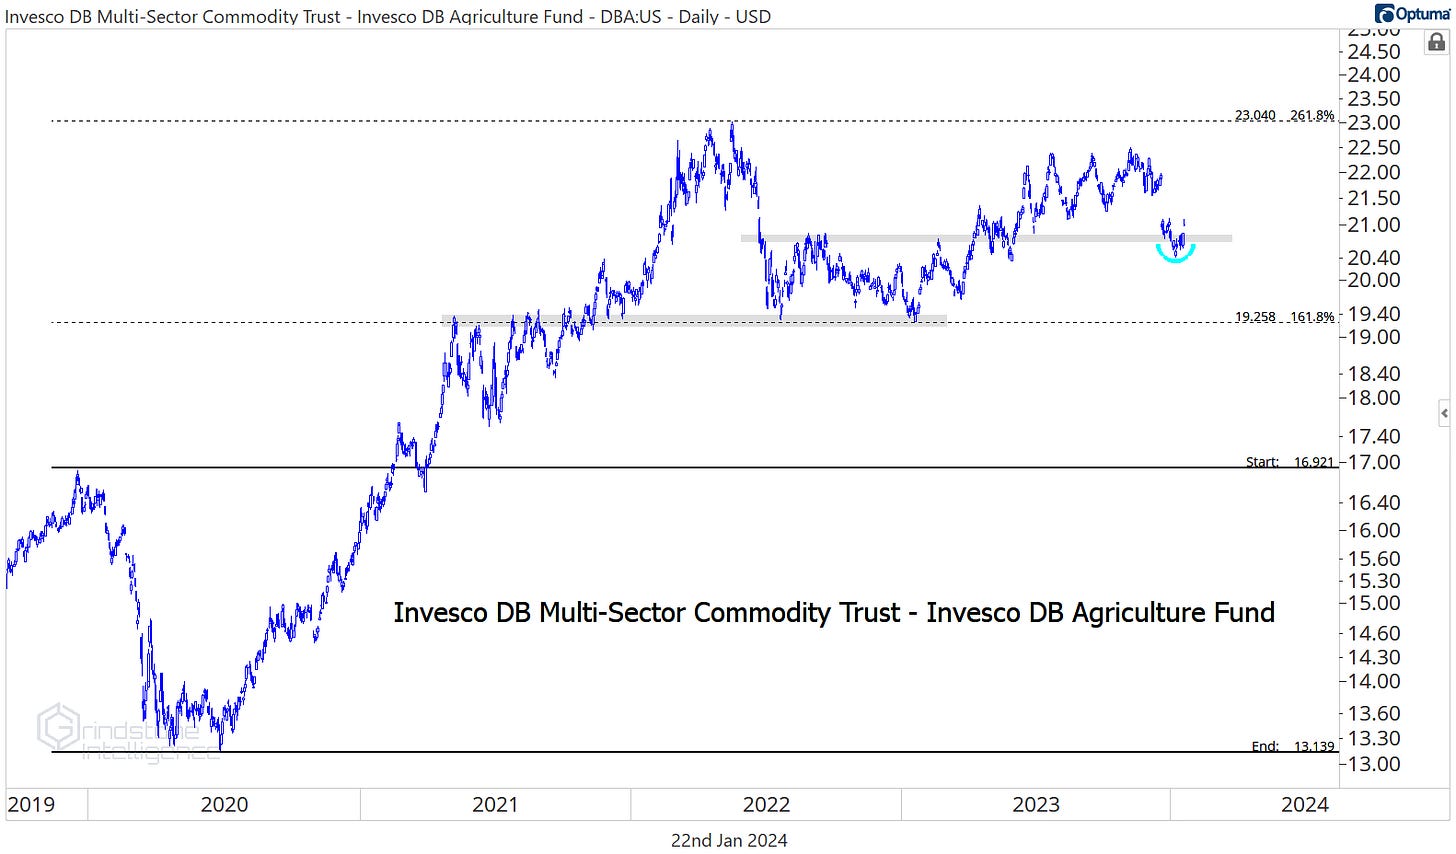
The agriculture commodities ETF - DBA - is trying to find support at $20.75, a level that acted as resistance in the second half of 2022. This one’s in the midst of a long-term uptrend, so we like the idea of buying it at support with a target back at the former highs of $23.
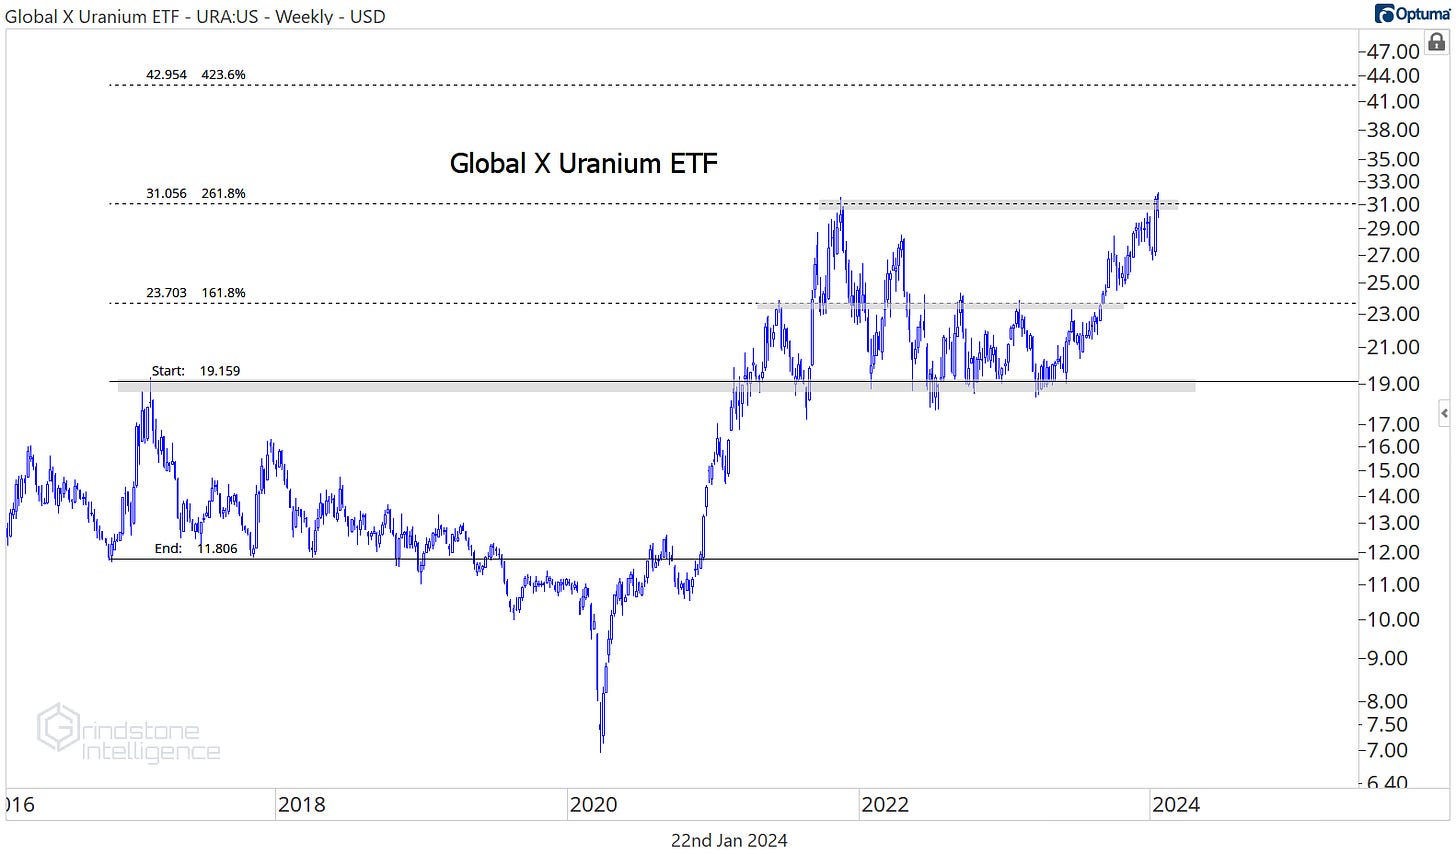
Uranium has been a big winner, but now we need to take a wait and see approach on the space. We put a $31 target on URA last summer, and it went up and kissed those former highs last week. Prices could continue right on past this level, but some digestion here makes more sense. With some time, a breakout above $31 would have us targeting a move to $43.
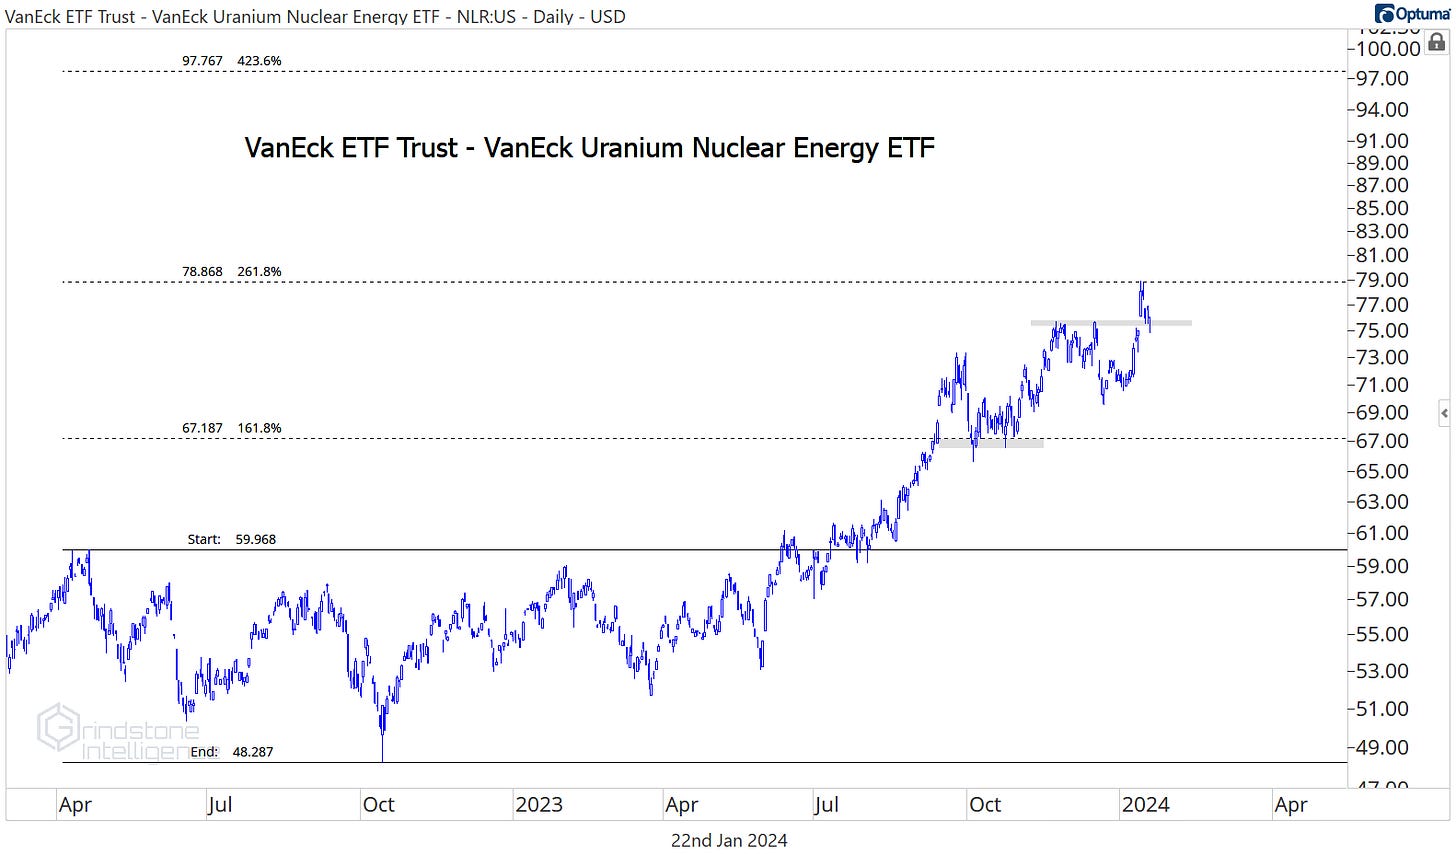
The same goes for NLR, which has been a holding in our model equity portfolio for the last few months. It just ran into the 261.8% retracement from the 2022-2023 trading range, and now we want to see how prices respond. This is definitely not a downtrend, and eventually we think NLR goes to $97. But we’d like to see it above $79 first.
That’s all for today. Until next time.


