U.S. Interest Rates: False Breakdown or False Alarm?
Interest rates in the United States have been falling for longer than I’ve been alive. Now I may be closer to spring chicken than over the hill, but any trend that lasts for more than a quarter century is nothing short of impressive. Let alone one that’s continued for nearly 39 years. But that’s exactly what long-term interest rates have done, sliding steadily lower since reaching a peak of more than 15% in 1981.
For years, it’s seemed a major reversal was inevitable – with the 0.0% lower bound, interest rates could only go so low, right? Of course, that antiquated line of thinking was shattered by the Bank of Japan, and later the European Central Bank, as they pushed lending rates into negative territory. But that doesn’t mean rates here at home are on a preset course for sub-zero levels. For one, Federal Reserve members have been adamant that negative rates are not an appropriate policy in the United States. In addition, price action may be setting up a move higher.
Treasury yields fell from 3.25% in November 2018 to a low near 1.50% by early September 2019. They spent the next few months digesting the rapid decline, briefly threatened to move back higher in December, but then collapsed in early 2020, bottoming near 0.60% in March. Another few months of consolidation followed, and another failed move higher. Recent history looked set to repeat itself, and indeed it did – until it didn’t. Bond yields set a new low in July, but instead of collapsing, they halted their decline and reclaimed the key area of support. Meanwhile, weekly momentum improved even as rates were setting new lows.
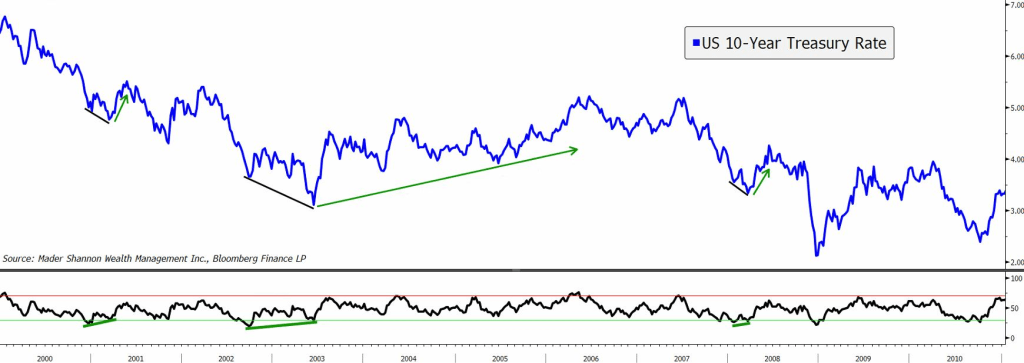
So could this failed breakdown and bullish momentum divergence be the long-awaited catalyst to end a generational bull market in bonds? It certainly could, but let’s not get ahead of ourselves. Momentum divergences and reversal rallies have been a hallmark of the long-term trend. Take a look at each decade over the last 40 years:
The ’80s saw a handful of divergences between price and momentum, some larger than others. The first must have been especially interesting at the time. After all, 1981 marked the end of a 30-year uptrend in yields, and no one at the time could have known for sure it was the peak . The bullish divergence in 1982-1983 certainly looked like the catalyst that would spark a resumption in a multi-decade trend, but, alas, the ensuing rally lasted less than 2 years.
Only two such divergences occurred in the ’90s. Each produced a rally, but rates resumed their steady march lower. Of note, one of the largest rallies of the decade was not preceded by improving momentum.
And in the ’00s, 3 more momentum divergences. The largest sparked a 3-year rally that began in 2003, but that rally couldn’t even bring yields back to where they’d been in 2002, just a year before the rally started.
The last decade has been more of the same.
Each of the prior 11 bullish momentum divergences resulted in higher yields, but none had the stamina needed to put an end to the long-term decline. On the other hand, none of the others have occurred this close to the zero lower bound.
Interest rates have been on the rise this month. The only question is, how long will it last?
Nothing in this post or on this site is intended as a recommendation or an offer to buy or sell securities. Posts on Means to a Trend are meant for informational and entertainment purposes only. I or my affiliates may hold positions in securities mentioned in posts. Please see my Disclosure page for more information.
The post U.S. Interest Rates: False Breakdown or False Alarm? first appeared on Grindstone Intelligence.


