Financials Sector Outlook
Top charts and trade ideas
It’s been more than a year since the collapse of Silicon Valley Bank sparked a panic that nearly upended the entire banking industry. Last March, everyone was scrambling to become experts on the accounting intricacies of held-to-maturity securities and the extent of unrealized losses on bank balance sheets. Even now, there are widespread concerns about the lasting impacts of the ongoing collapse in commercial real estate values.
Despite all that, the ‘crisis’ was over almost as soon as it began. From the March 17th, 2023 lows to today, the Financials have tracked the S&P 500 nearly step for step.
Beneath the surface, they’ve been even better. Here’s the equally weighted S&P 500 sectors since those March 17 lows - the Financials are among the leaders, right up there with the Industrials, Tech, and Energy.
So are the Financials going to continue leading?
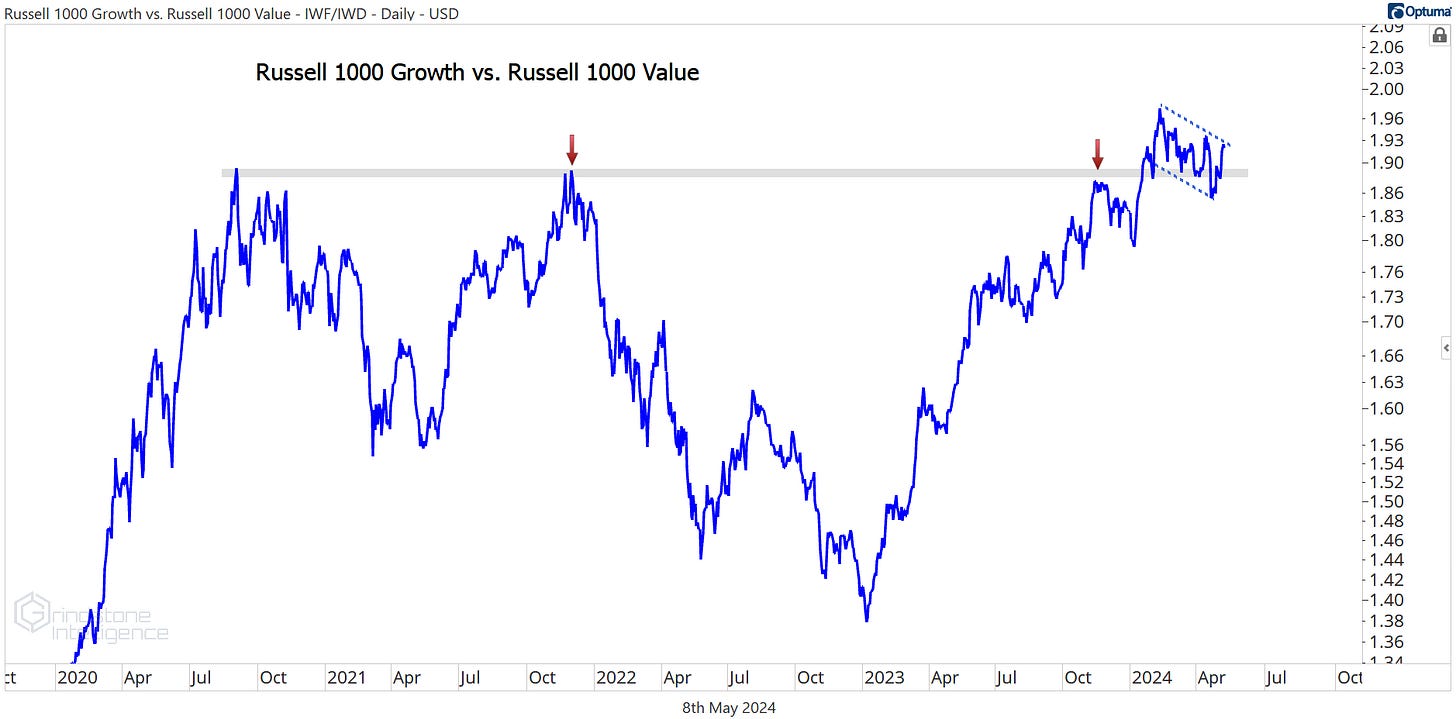
We think that depends on the outcome of this ongoing retest of the 2020-2021 highs for the Russell 1000 Growth to Value ratio. A successful retest here would mean we should put renewed attention on AI and mega-cap growth names that have dominated the bull market thus far.
A failure, though, and we could find ourselves at year-end talking about the dominance of Energy and Financials stocks in 2024.
The latter would fit with what we’re seeing for the Financials relative to the S&P 500. The ratio below is above its 200-day moving average and spent the first few months of the year consolidating above a key, one-year rotational level. Then it hit new 52-week highs in April. This is an uptrend until proven otherwise.
And we know that uptrend breadth is strongest in the value-oriented cyclical sectors of the market. The Financials sector has more of its constituents trading above a rising 200-day moving average (81%) than any other group. Energy (75%), Materials (73%), and Industrials (68%) aren’t too far behind.
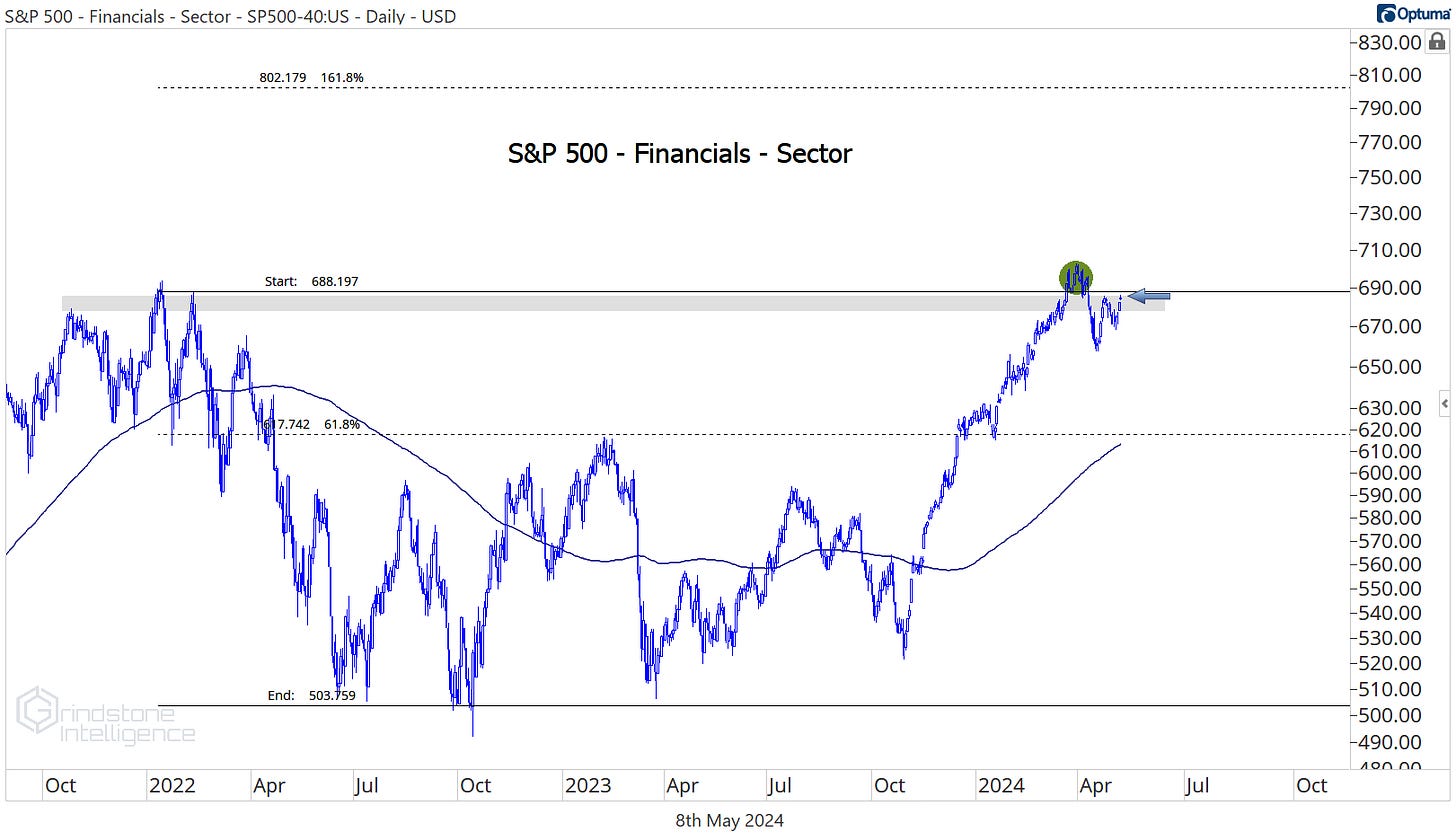
What’s the biggest headwind for Financials sector bulls? It’s the January 2021 highs, which are once again acting as overhead supply after a failed breakout earlier this year.
Sometimes failed breakouts are the beginning of trend reversals. Other times it just marks a false start, one that requires some time for all the ‘racers’ to regain their footing and get ready for the real race. The weight of the evidence says we’re still in a bull market, and that means the latter is the more likely outcome.
We’re betting on higher prices for Financials stocks.
Below, we highlight our favorites.
Digging Deeper - Top Charts and Trade Ideas
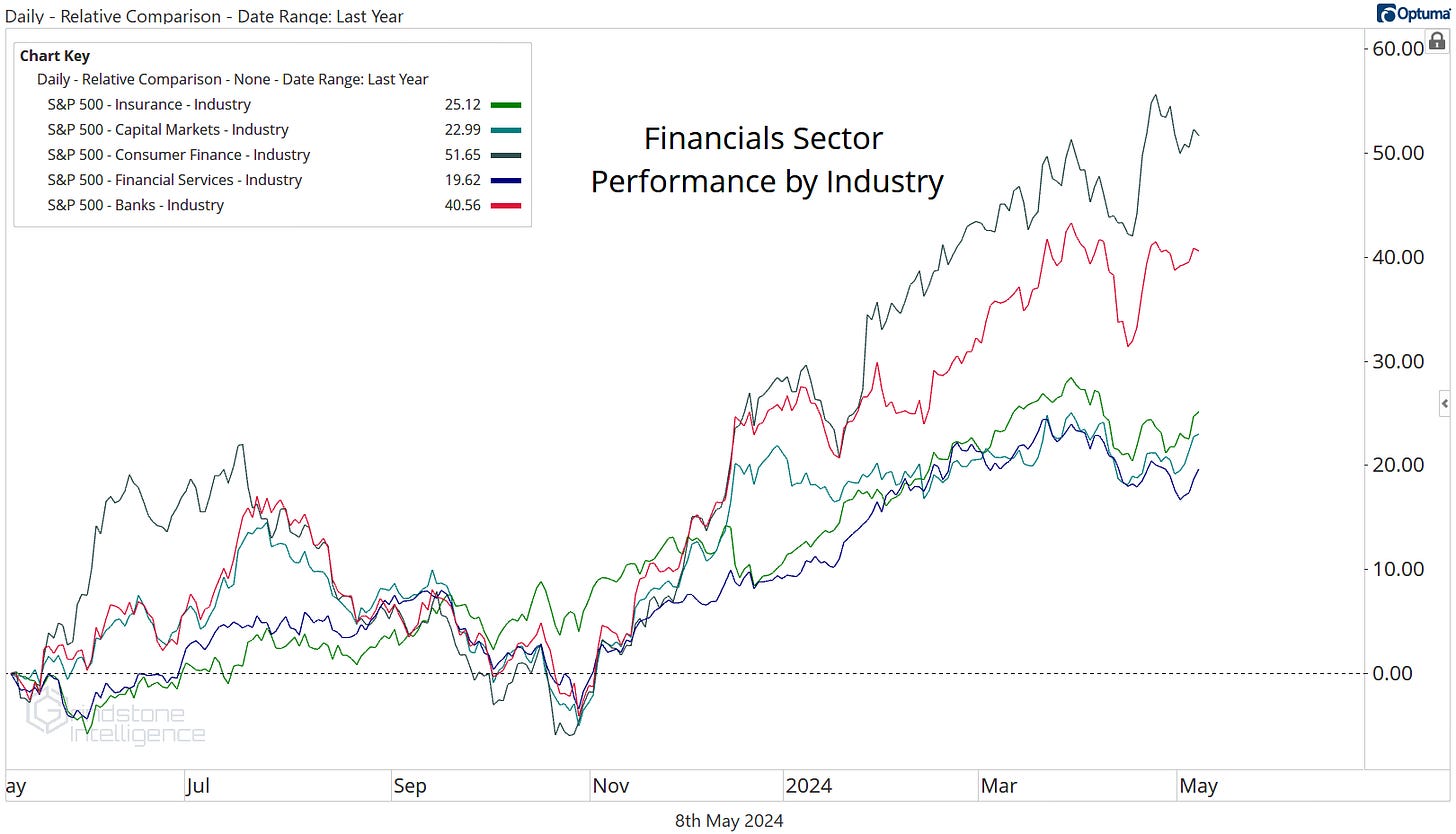
As we mentioned above, no sector has stronger breadth characteristics than the Financials, and you can see what that means at the industry level. The weakest industry is still up nearly 20% over the last year.
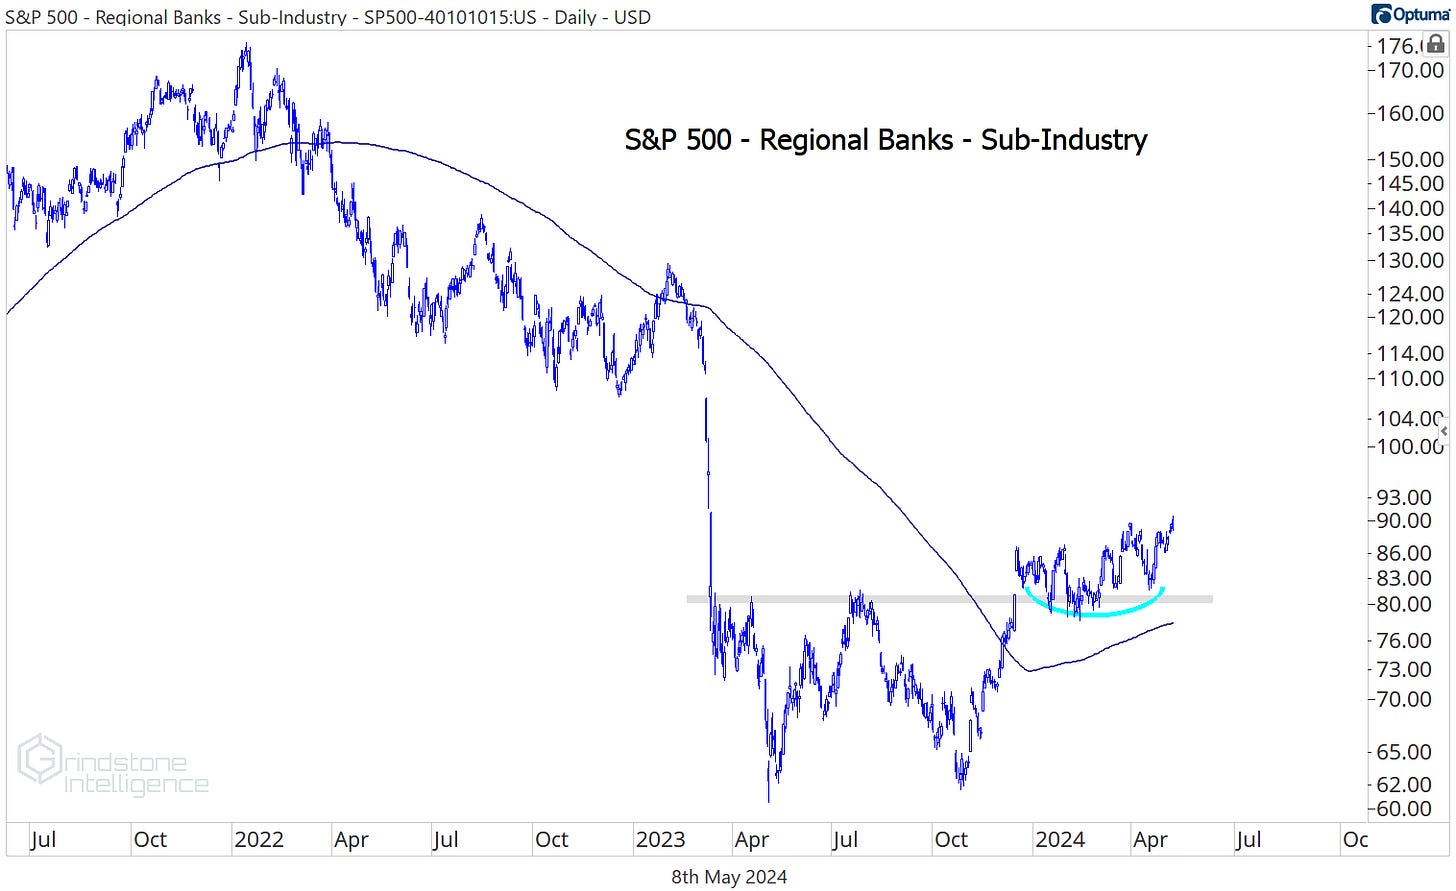
The banks are what interest us the most right now. First, take a look at the Regional Banks sub-industry, where last year’s failures were located and where the ongoing risks from CRE are most acute. The group just hit new 52-week highs.
That doesn’t necessarily mean we need to be buying them - and in this case, we don’t, because they still aren’t showing any relative strength compared to the rest of the sector.
But the fact that bears can’t even keep down the worst areas of the market tells us a lot about the type of environment we’re in. Knowing that the bulls are in control should give us more confidence in buying the areas that are showing relative strength. Like the big banks.
Bank of America (BAC) just broke out to new 52-week highs versus the rest of the sector.
So did Citigroup (C).
And so did Wells Fargo (WFC).
These are the types of themes we want to be looking for. It’s one thing for a stock to be breaking out. It’s another thing altogether for a stock to be breaking out while it has a stiff industry-wide tailwind.
WFC has the best setup of those three as it breaks out of this 9-year base. We can be buying it above support at $58 with a target of $81.
Did you really think we’d ignore the best of the best, though? Those other banks are all successfully reversing relative downtrends. JPMorgan was just setting new ALL-TIME highs vs. the Financials sector. There’s relative strength, and then there’s relative strength.
We still want to be buying JPM above $180 with a target of $275.
Leaders
Goldman Sachs was the top-performing stock in the sector over the last month, and that leadership has it threatening to break out of a massive, decade-long base relative to the rest of the sector.
If that breakout comes, we could easily be talking about several years of outperformance going forward. Our initial target on GS is $580, which is the 261.8% retracement from the 2007-2009 decline.
Insurance stocks continue to rally.
This has been one of our favorite areas over the past year, and we don’t see much to change that.
Progressive still has a solid setup in place. It moved past our former target of $205, and now we’re using that level to manage risk on new entries. We like PGR long above $205 with a target of $265.
Arch Capital Group was one of the best stocks out there in 2022 and 2023, but then it hit our target of $91 late last year and stopped going up. For awhile anyway. Now ACGL is setting fresh highs, and we have a new entry point with a level to manage risk against. We want to be buying it above $90 with a target of $135
Losers
The opposite of relative strength is relative weakness. Losers tend to keep on losing.
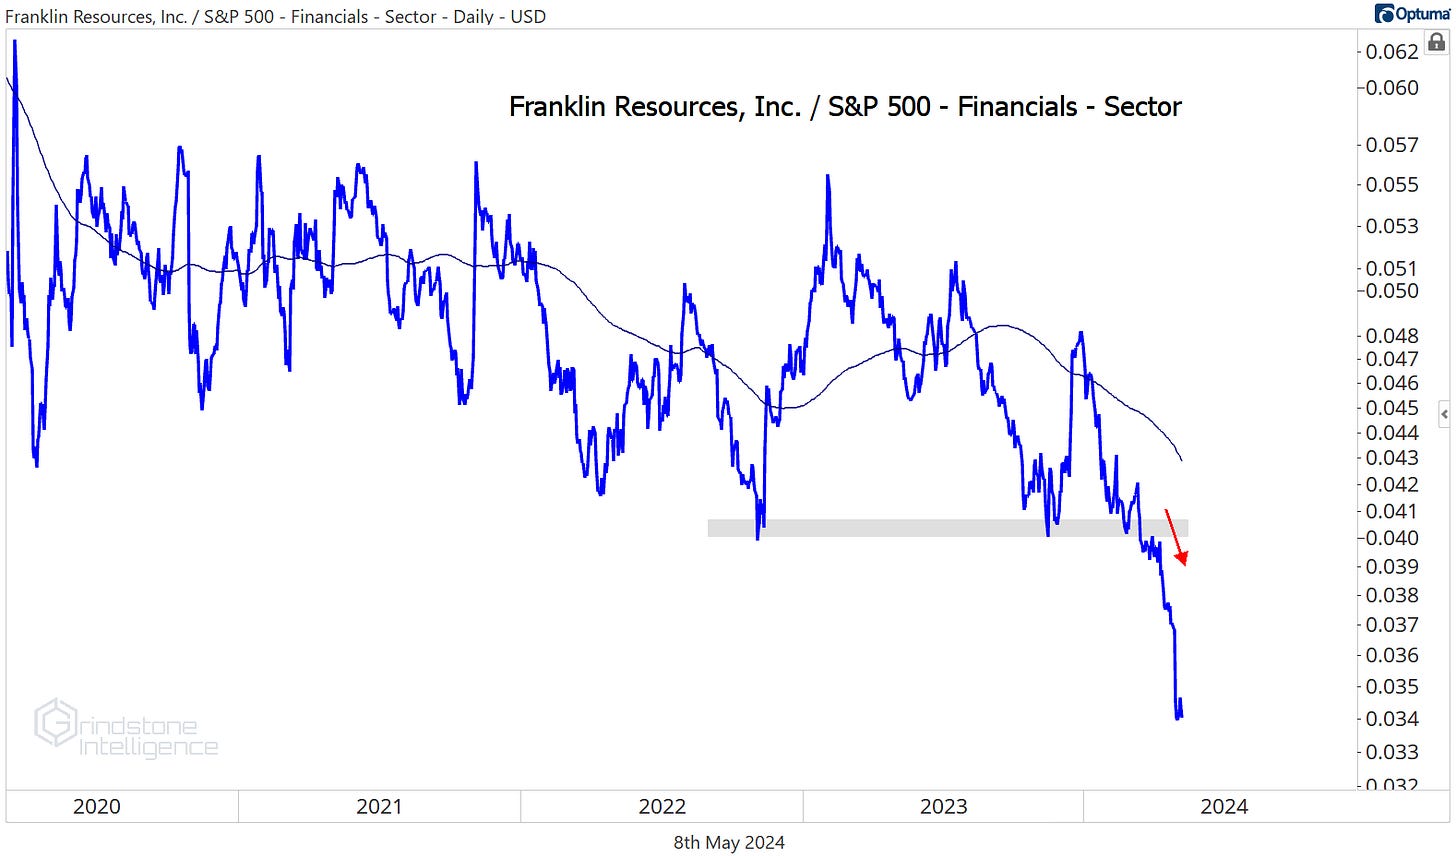
Franklin Resources has lost 85% of its value when compared to the rest of the sector over the last 13 years, and it just hit new 20-year relative lows.
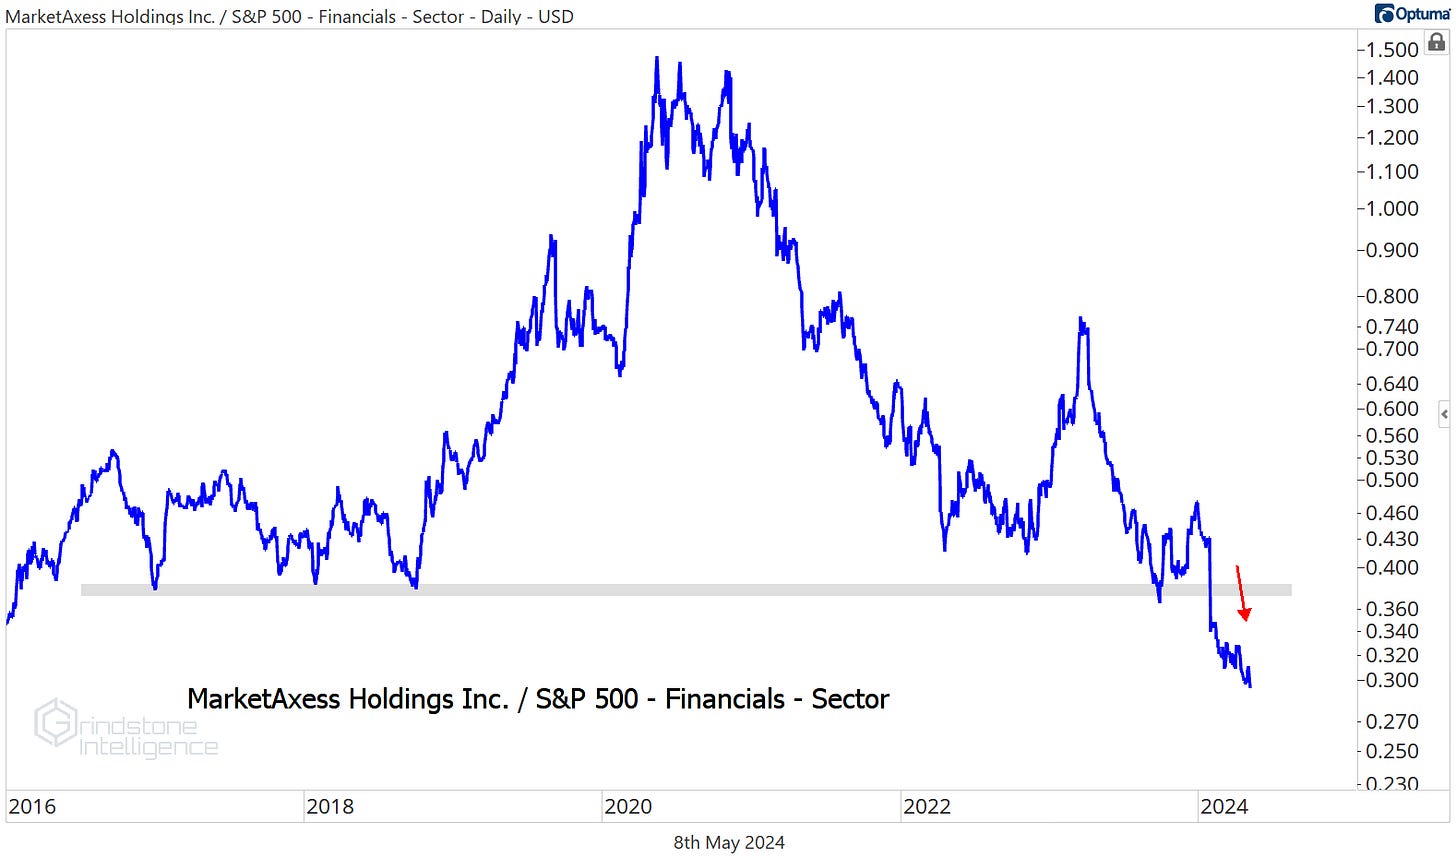
MarketAxess Holdings just broke multi-year relative support. There’s no reason to be involved with this one unless you’ve got a penchant for grabbing falling knives.
More charts to watch
Trends are always more likely to persist than reverse. That’s why we spend most of our time focusing on stocks in uptrends and avoiding the ones in downtrends. But that doesn’t mean trends never reverse. We’re eying a potential downtrend reversal in Fidelity National.
It’s been one of the worst stocks in the world over the past few years, but compared to the S&P 500, FIS stopped going down last fall. The FIS/SPX ratio is further above its 200-day right now than at any point since March 2020. Oh, and it just hit new 52-week highs.
On an absolute basis, the downtrend reversal is even further underway. We continue to like FIS above $63 with a target of $90, which is the 38.2% retracement from the entire 3 year decline. New entries right here don’t make a lot of sense, but it’s one to keep watching.
Fiserv has no downtrend to reverse, though it’s currently stuck below our former target of $155. We still like the relative strength profile of FI longer-term, though, so we don’t want to forget about it. On another break above $155, we want to own it with a target of $205, which is the 261.8% retracement from the 2020 decline.
That’s all for today. Until next time.


