First Quarter Recap – State of the Market
The first quarter of 2022 is in the books. Catch up on what you missed.
Equities
Stocks had their worst non-recessionary start to the year since 1978. The Tech-heavy Nasdaq Composite led to the downside, dropping below rotational support near 14250 in January and falling as much as 22% from its November 22nd peak by March 14th. The end of the quarter saw prices revert to a flat 200-day moving average after putting in a bullish momentum divergence at those March lows.
The highs from Q1 2021 are still near-term resistance – a failure here could mean a retest of the lows or even the September 2020 highs, which marked a peak in Technology stocks relative to the S&P 500.
Small cap stocks continued to struggle after spending most of 2021 stuck in a tight trading range. The Russell 2000 fell to new 52-week lows to start the year, and has struggled to recapture the trading-range lows.
Communication Services was the weakest sector of the quarter. It peaked in August of 2021 at the 261.8% extension from the COVID collapse, and even after a bullish momentum divergence and bounce, remains well below a downward-sloping 200-day moving average price. The trend for this group is lower until it proves otherwise.
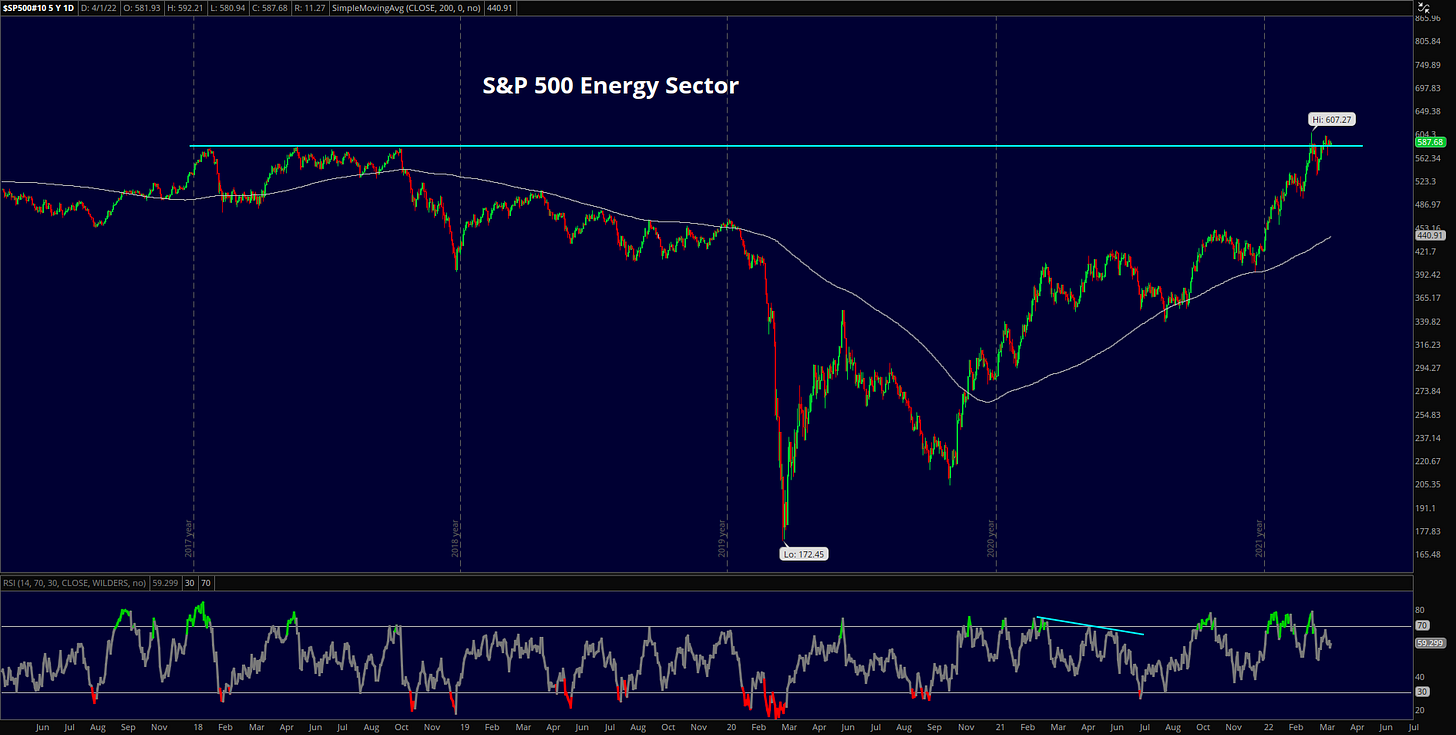
The opposite is true for Energy, which led all sectors in 2021 and again in the first quarter. Prices have stalled near the 2018 highs, a logical area of resistance for a group that is stretched relative to its 200-day. A potential bearish momentum divergence is shaping up, too, raising the odds for a near-term pullback. Still, it will take more than mean reversion to end this multi-year uptrend.
Utilities have shown surprising strength in recent weeks, and finally surmounted resistance from the pre-COVID peak. It’s no surprise perhaps that Utilities are outperforming on a relative basis in this weak tape, but ‘safety’ sectors tend to do so by falling less than the index, not by ripping to new all-time highs.
Fixed Income
Bonds prices fell as interest rates spiked in the first quarter. Yields on long-dated maturities rose the most in a quarter since 2016, and the rate on short-dated maturities climbed faster than at any point since 1984. The moves were supported by rising inflation expectations and a Federal Reserve that has (finally) shifted its policy approach in response. In January, market participants broadly expected between two and three 25 basis point hikes from the FOMC by year-end. Wall Street now expects the equivalent of more than eight such moves, in addition to the start of quantitative tightening. The Fed started things off with a quarter-point move in March.
Trouble With the Curve?
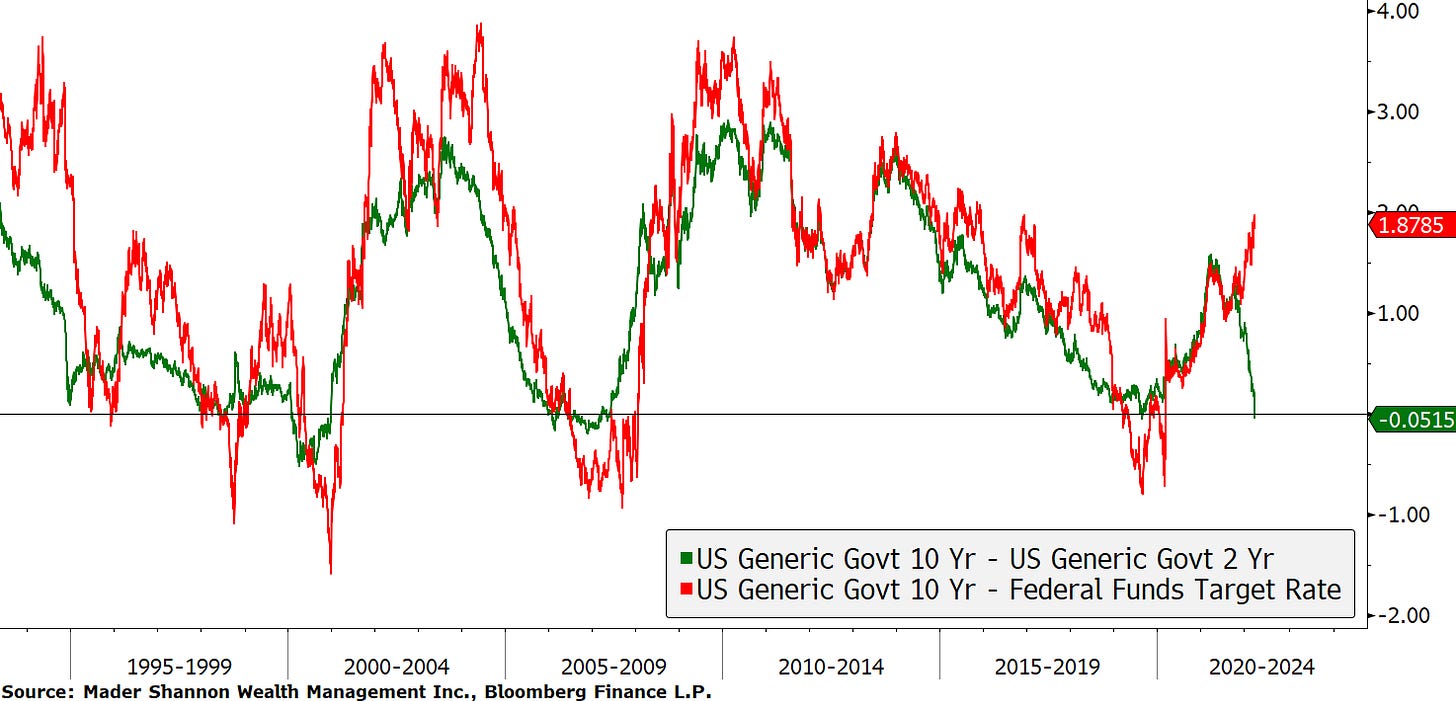
The move higher in rates was overshadowed by an inversion in the yield curve – the rate on 2-year U.S. government bonds exceeded that of 10-year Treasuries in the final days of March. Yield curve inversions matter because each of the last 6 occurrences has been followed by a recession. The problems with the indicator are many. First, there’s disagreement about which terms to use. According to surveys, the majority of financial market participants believe the 2s-10s curve that inverted last week is the most important. However, The Conference Board’s index of Leading Economic Indicators uses the Federal Funds rate in place of the 2-year Treasury. Normally the two move together, but they’ve diverged dramatically in recent months, sending very different recessionary signals.
Another problem is that inversions are poor timing tools. Equity peaks tend to precede recessions by several months, yet stocks usually continue rising even after inversions. On average over the last 35 years, they’ve continued on for more than a year and climbed more than 30%.
Several leading economists at the Federal Reserve and elsewhere have downplayed the importance of the yield curve and its predictive power in recent years. They argue that quantitative easing in the aftermath of both the financial crisis and the pandemic have altered the fixed income landscape such that term premiums don’t adequately reflect financial conditions. Moreover, they argue, while the 2020 recession was preceded by a yield curve inversion in 2019, it was caused by lockdowns in a response to a global pandemic, not by credit conditions. That inversion/recession relationship was a coincidence.
They’re right, the yield curve did not predict COVID. But people seem to have forgotten how precarious the economic environment was in 2019 and early 2020, even before the pandemic struck. Global trade was under attack from tariff spats and activity was slowing. The labor market was showing signs of weakness. It’s quite possible that a recession would have occurred in 2020 even without the pandemic. In any case, it’s unwise to completely discount an indicator with such a strong historical track record.
If recession is coming, we’ll likely see warning signs in credit spreads. Credit spreads tend to widen when economic activity slows, and we’ve seen that happen to some degree over the last few months. For now, though, the rise is comparable to the increase seen in late 2018. The 2011 European debt crisis, 2014 oil collapse, and 2015 manufacturing slowdown each saw spreads widen much more than they have so far in 2022, but none of those resulted in economy-wide recessions.
Commodities
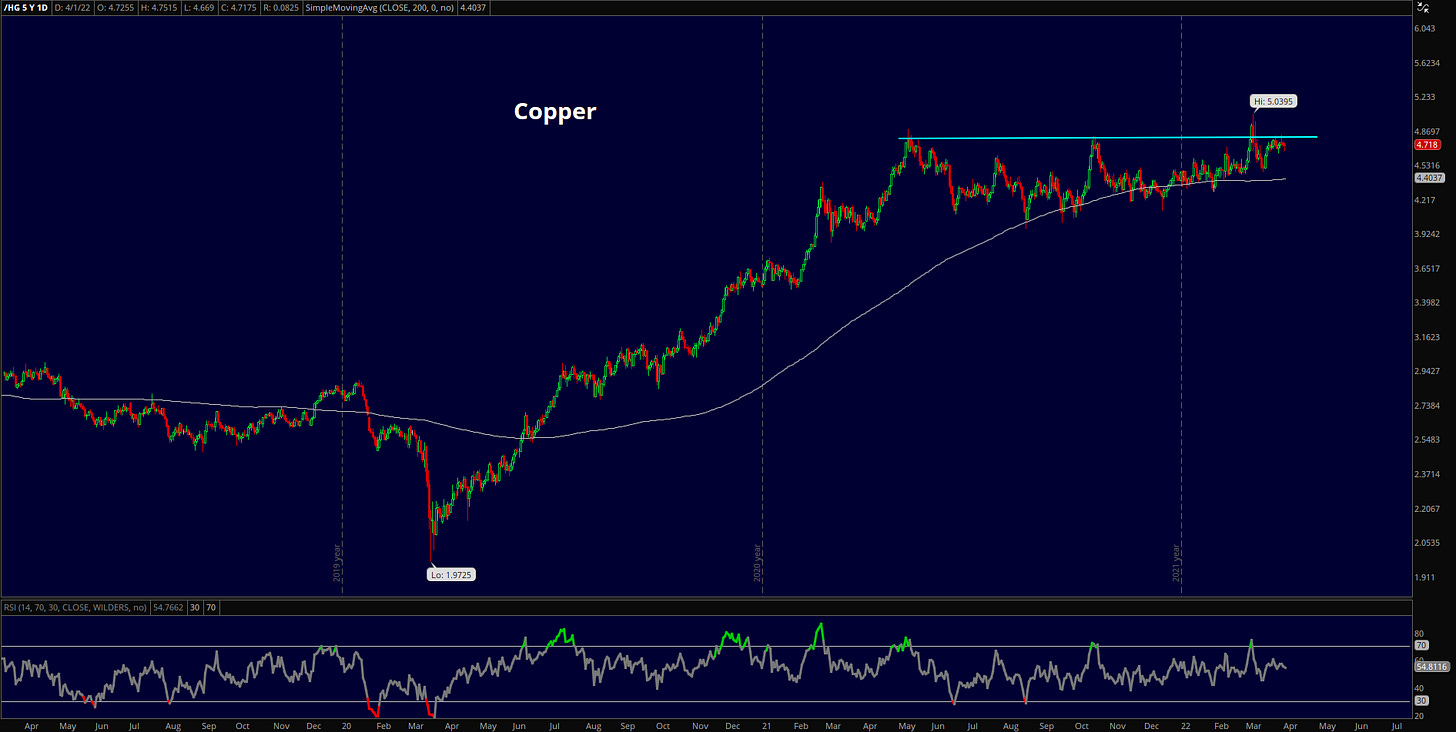
Copper, the commodity said to have a PhD in economics, is pointing to a resurgence in economic activity as it tests highs. After an impressive run-up from the 2020 lows, prices have consolidated for most of the last year above their 200-day moving average. We should expect consolidations to resolve in the direction of their underlying trend, which, in this cases, is up. A failure to break out would add fuel to the recession narrative that’s followed the yield curve inversion.
Oil prices skyrocketed to $130 and their highest level since 2009 after Russia invaded Ukraine. They’ve since stabilized near $100, respecting overhead resistance from the 2011-2014 highs. Much like price action in the Energy sector, this is a logical place for a pause and maybe even a near-term pullback. The trend, though, is higher until it’s not.
Gold had a constructive few months to start 2022. It’s still below the peak set in 2020, but has so far held support from swing highs set in 2021. With the longer-term uptrend intact, we should still expect this multi-year consolidation to resolve higher. That said, the chart gets messy for Gold bugs below 1900.
Everything Else
Normally, the Japanese Yen is considered a safe haven during times of turmoil. That relationship hasn’t held up so far this year. The Yen has fallen relative to the USD at the fastest rate since 2016, and is challenging 7-year highs.
Tech stocks in China continue to face pressure. The Nasdaq Golden China index fell as much as 76% from its spring 2021 peak. The index is well off its lows, but still well within a downtrend. The weakness has weighed on Emerging Market baskets.
Latin American markets have bucked that trend, outperforming U.S. stocks on a year-to-date basis. The strength has pushed the MSCI Latin America index back above the 1999 lows. After more than 10 years of underperformance, what better catalyst for leadership than a false breakdown at multi-decade lows?
If Latin America is going to outperform, Brazil may take a leadership role. Relative to the S&P 500, the Ibovespa has recovered the 2016 lows it lost in late-2021 and is set to challenge multi-year highs.
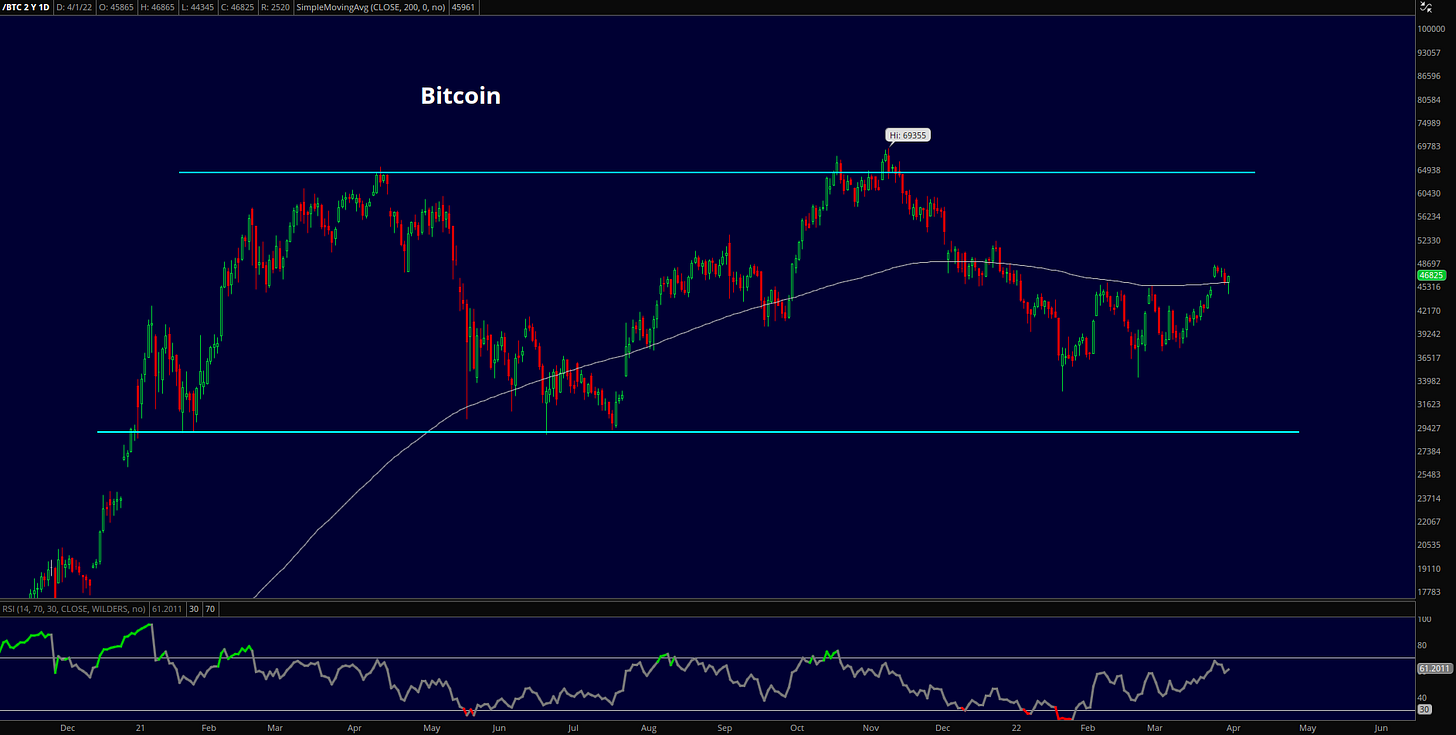
In the land of cryptocurrencies, Bitcoin remains in the middle of a big range, near a flat 200-day moving average. With more than 30% to both the upside and downside of this range, the best bet is that bulls and bears will continue to be frustrated by trend-less price action.
Macro Monitor
In Case You Missed It
The Charts the Defined the Market in 2021
Ten Charts I’ll Be Watching in 2022
There’s Always a Bull Market Somewhere
The Battle Lines are Drawn: Growth vs. Value
Finding Strength in a Weak Market
Interest Rates are Rising. Is it Time to Worry About Home Prices?
Nothing in this post or on this site is intended as a recommendation or an offer to buy or sell securities. Posts on Means to a Trend are meant for informational and entertainment purposes only. I or my affiliates may hold positions in securities mentioned in posts. Please see my Disclosure page for more information.
The post First Quarter Recap – State of the Market first appeared on Grindstone Intelligence.


