Historic Rally for Utilities Stocks
For the first time since 1993, Utilities stocks have closed at a record high for 8 consecutive trading days. The epic breakout comes after a three and a half month consolidation pattern, and has resulted in a rise of 6.25% over a two-week period – the best of any sector. Take a look at the rally so far:
The 261.8% extension from the 2015 decline turned into resistance in August 2019, and initial efforts to break to new highs in October and December failed. But the declines proved short-lived. Prices never got below their 200-day moving average and haven’t gotten oversold since the end of 2018. To the contrary, with a post-breakout 14-day RSI of 84.5, Utilities are now the most overbought since March 1998.
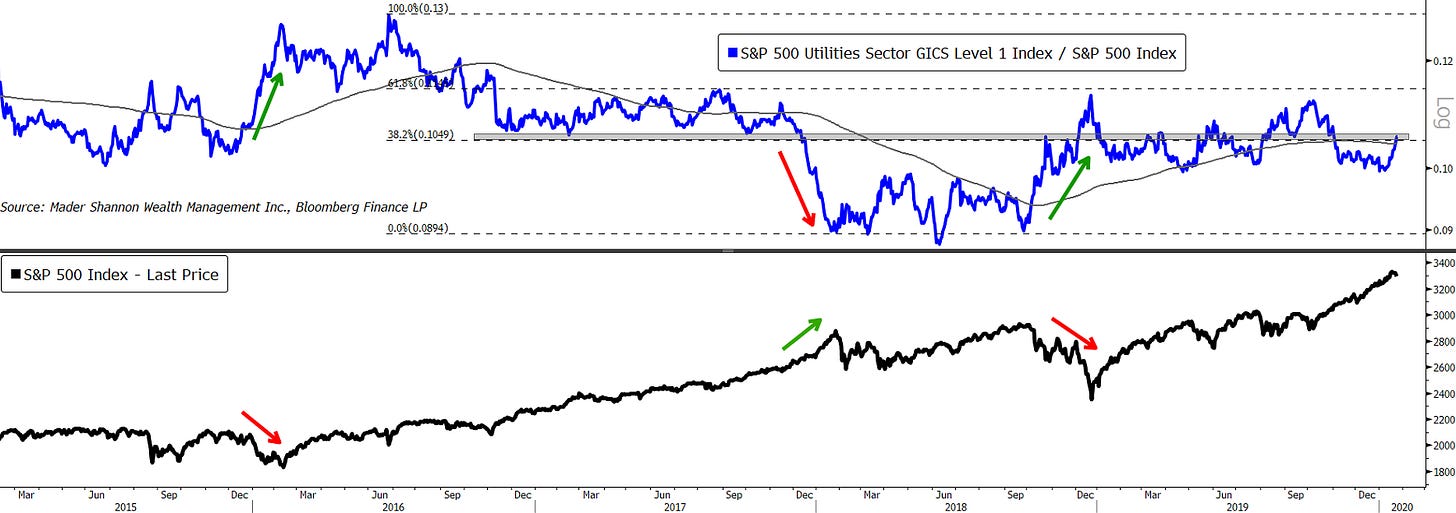
Compared to the S&P 500 index, Utes outperformed by 5.3% over the past 2 weeks. That takes them back to the middle of the relative performance range over the past 1 and 5 year periods. The area near the 38.2% retracement from the 2016-2018 declines has been a good rotational area and is key near-term resistance. Should the sector continue to rally, the 2019 swing high – just below the 61.8% retracement level – could be the next stop.
While the last few weeks of outperformance don’t appear unusual on the chart above, the manner in which they’ve outperformed, is. Traditionally a safe-haven sector, Utilities tend to lead when the broader market weakens, and generally lags when larger, risk-on sectors strengthen. Here’s how the ratio looks when we compare it to the S&P 500.

In that regard, the last fortnight stands out. Utilities outperformed by more than 5%, and the S&P 500 actually rose over the period. In the last 30 years, it’s only happened a handful of times, and the last occurrence was more than a decade ago: December 2009.
At 11 straight days of gains, Utilities are knocking on the door of another 30-year record: the 13-day streak ending July 16, 1992.
The post Historic Rally for Utilities Stocks first appeared on Grindstone Intelligence.


