The Truth About Long-Term Stock Market Returns, Part 2: A History of Dollar Cost Averaging
This post is the second in a series I plan to continue in coming months, where I provide some perspective on historical returns of financial markets, and discuss what it means for investors. In Part 1, I took a look at average returns for U.S. equities over the last 100 years. It provides the backdrop for today’s review of dollar cost averaging, so if you haven’t seen it – or need a quick refresher – I encourage you to read it here.
“Compound interest is the eighth wonder of the world.”
Albert Einstein
If you deposited a penny into your retirement account on January 1st, and then proceeded to double the value of your initial investment each day, you could retire with more than $10,000,000 by the end of the month. That such an astounding level of wealth could grow from such humble beginnings, is the miracle to which Einstein was referring. Compound interest is one of the keys to financial success. Nobody I know is capable of doubling their money for 31 straight days (you’ve got a 0.00000005% chance at the Roulette table), but capturing more modest returns over long time frames has a similar effect: A single dollar invested in U.S. equities back in 1871, and earning just over 9% per year, would be worth more than $450,000 today.
But just as I don’t know someone with the ability to correctly call a coin flip 31 times in a row, I don’t know anyone that will live (let alone invest) for 150 years. Most savers have somewhere between 20 and 40 years from the time they start investing to the time they plan to retire. In addition, most savers are doing just that: saving. They don’t have large sums to invest in their youths, so they invest what they can, when they can.
Enter Dollar Cost Averaging.
The concept of Dollar Cost Averaging is simple enough. Rather than try to time market peaks and troughs, investors buy at a slow and steady pace, on predetermined dates with a predetermined amount. By doing this, they’re guaranteed to buy both the peak and the trough in market prices, as well as everything in between. It’s a sure way to invest without shooting yourself in the foot. After all, emotions can’t wreck your decision-making if there’s no decision to be made.
You’d be hard-pressed to find a more popular and effective strategy than dollar cost averaging. Its virtues have been extolled by everyone from legendary value investor Benjamin Graham, to random walk pioneer Burton Malkiel. And by design, many savers are doing it already – retirement funds are withheld from weekly or monthly paychecks and invested straight-away. But how well has DCA actually worked for U.S. equity investors?
The answer depends on both their luck, and perseverance.
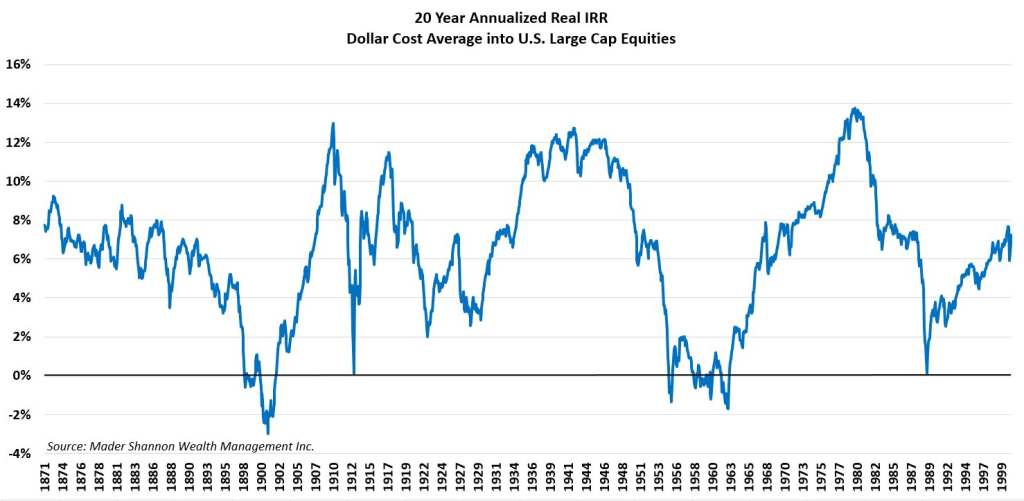
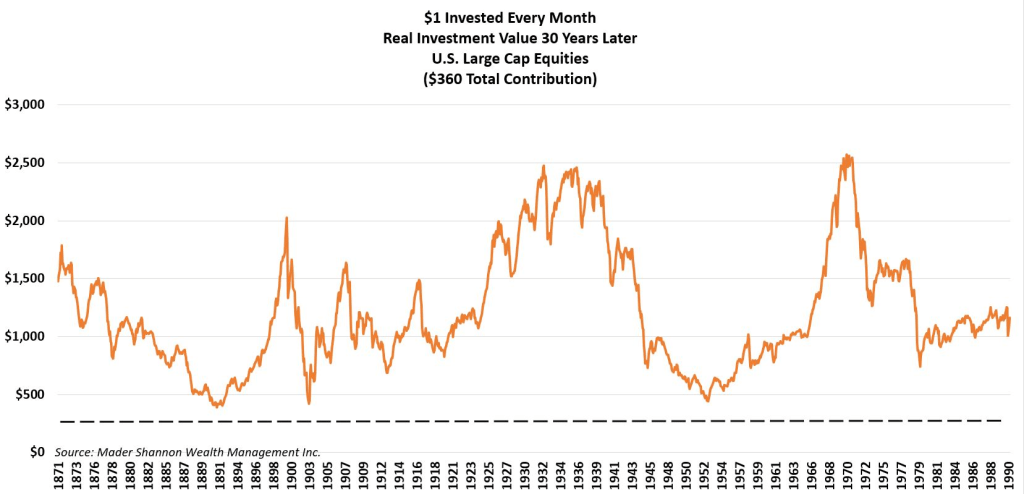
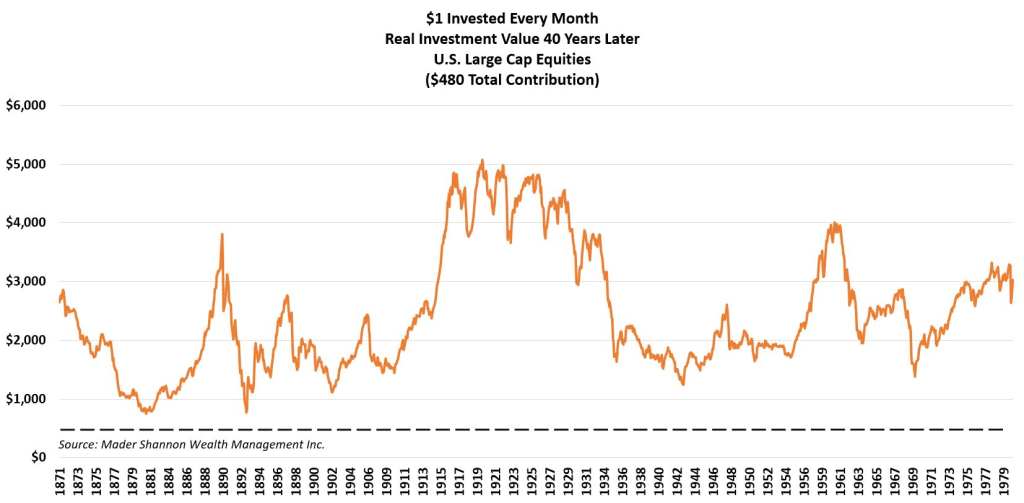
Though equities have risen at a respectable rate over the long-term, their returns are highly cyclical. Prices are prone to rapid advances, staggering declines, and sometimes, years of trend-less volatility. Thus, investing results vary substantially depending on one’s start date. I analyzed the hypothetical inflation-adjusted returns for a saver that invested $1 every month into large cap U.S. equities for 20, 30, and 40 years. Here’s what I found:
After 20 years, the average investor would have ended up with $502, netting a 6.64% real IRR for the period. Not bad at all. But hardly anyone achieved that average. In three distinct periods, investors netted over $1,000. Meanwhile, an investor using the exact same strategy, but with a less favorable start date, could have ended up with less than their $240 total contribution.
In other words, one of the most reputable investing strategies in existence garnered a negative real return for a twenty year period. At other times it achieved over 12% per year. And neither were one-time flukes. In no way should the ‘average’ result be confused with an ‘expected’ result.
For investors that continued to dollar cost average for 30 years, the results are better, but still contain huge disparities in performance results. On average, the $360 total investment turned into more than $1,000. But some investors cashed out at over $2,500, while others ended up with just $385.
And for those hypothetical investors with exceptional fortitude, that started young and stuck to a dollar cost averaging strategy for 40 years, things mostly turned out alright, averaging 6.24%. Excluding the poor souls of the late 1800s that saw 90% of their value destroyed during the Great Depression, real returns exceeded 4% per annum, and reached as high as 9% for those that started between 1915 and 1925.
But again we must acknowledge the great discrepancies between the most fortunate, and the less so. The difference between 4% per year and 9% per year, compounded over 40 years, is 4x. At the risk of being overly repetitive, I’ll say it once more: The only difference between $250,000 and $1,000,000 at retirement could be the day you were born.
In investing, there are no guarantees of success or failure. Whether you’re a long-term investor, trend following speculator, or momentum-chasing day trader, we’re all playing a game of market timing.
Nothing in this post or on this site is intended as a recommendation or an offer to buy or sell securities. Posts on Means to a Trend are meant for informational and entertainment purposes only. I or my affiliates may hold positions in securities mentioned in posts. Please see my Disclosure page for more information.
The post The Truth About Long-Term Stock Market Returns, Part 2: A History of Dollar Cost Averaging first appeared on Grindstone Intelligence.


