July Technical Market Outlook
At the outset of every month, we take a top-down look at the US equity markets and ask ourselves: Do we want to own more stocks or less? Should we be erring toward buying or selling?
That question sets the stage for everything else we’re doing. If our big picture view says that stocks are trending higher, we’re going to be focusing our attention on favorable setups in the sectors that are most apt to lead us higher. We won’t waste time looking for short ideas – those are less likely to work when markets are trending higher. We still monitor the risks and conditions that would invalidate our thesis, but in clear uptrends, the market is innocent until proven guilty. One or two bearish signals can’t keep us on the sidelines.
Similarly, when stocks are trending down, we aren’t looking to buy every upside breakout we see. We can look for those short opportunities instead, or look for setups in other asset classes.
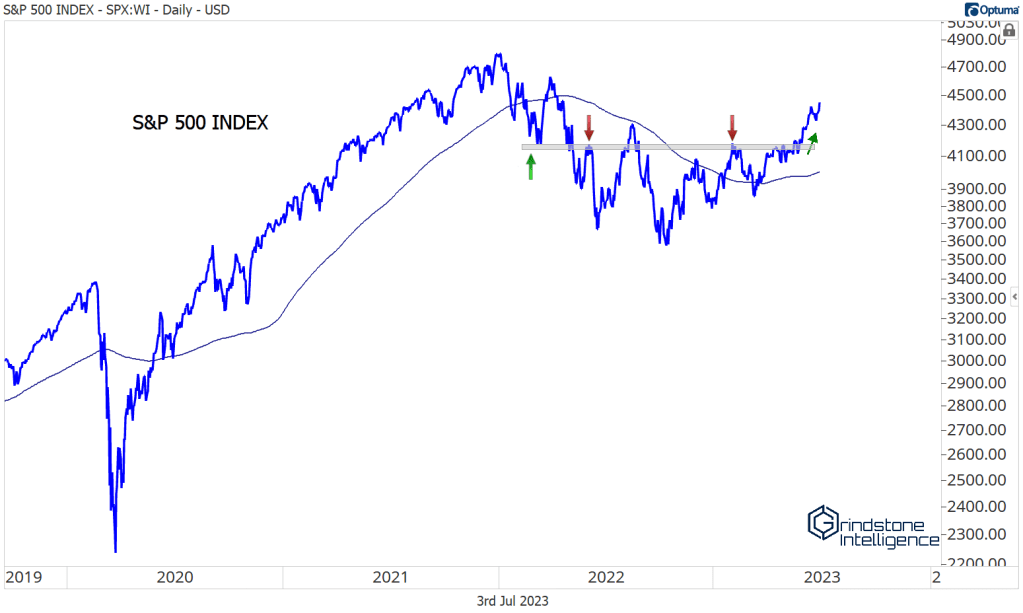
Right now, stocks are in an uptrend, and they have been since the S&P 500 and the NASDAQ broke out above resistance in early May.
The NASDAQ has been especially strong, rising more than 30% this year on the way to its best first half ever. With last summer’s swing highs acting as potential support on any pullback, the NASDAQ Composite is poised to challenge 15,000 again, which is the 261.8% retracement from the COVID selloff, and close to the all-time highs near 16,000.
There’s been plenty to hate about the rally, of course. A restrictive Federal Reserve and recession risks on the horizon have darkened the fundamental landscape, while weak breadth has been the chief concern for technicians.
We cautioned fellow technicians about letting weak breadth keep them on the sidelines in last month’s outlook.
Yes, breadth stinks. Leadership is narrow. The market is top-heavy. But don’t fight the tape.
Poor participation rates can be corrected in one of two ways: the leaders can catch down (bearish) or the laggards can catch up (bullish). Thus, weak breadth alone isn’t a sell signal.
We got the latter correction in June. Growth stocks continued to rise, but the value-oriented Industrials sector became the first to set a new all-time high when it surpassed its 2021 peak. And the S&P 500 Advance-Decline Line ended the month by reaching a new all-time high.
Trends across the index have improved substantially. When we looked at the end of May, more than half of all S&P 500 constituents were below moving averages on a short, intermediate, and long-term basis. Today, the opposite is true.
Uptrend breadth is especially strong within Information Technology, Industrials, Consumer Discretionary, and Communication Services – all sectors associated with increased risk appetite. The weakest sectors are risk-off areas, like Utilities and Consumer Staples, which should lag during a bull market.
The rapid improvement in breadth is a clear example of why we put a discounted value on bearish indicators when the market is in an uptrend. You can always find something bearish. But you need confirmation. For us, that confirmation needed to be further deterioration in the small caps. Instead, the Russell 200 is approaching the top end of its 12-month consolidation range.
The Dow Jones Industrial Average had been a laggard, too, in 2023, but it gapped higher on Friday morning, putting last summer’s swing high in the rearview mirror. Maybe for the last time.
The final nail in the coffin for breadth detractors would be a breakout in the NYSE Composite. If breakouts in the S&P 500, the NASDAQ Composite, and the Dow Jones Industrial Average weren’t enough to convince you that equities are trending higher…
It’s clear that we want to be looking for stocks to buy. So where should we look for the ones that are going to lead us higher? All year it’s been all about growth names. Information Technology, Communication Services, and Consumer Discretionary have been on the leading edge of the returns landscape, far outpacing the gains in other sectors.
That all started back in January, when the Russell 1000 Growth Index put in a bullish momentum divergence relative to the Russell 1000 Value Index. Since then, that ratio has risen 27%. Over the last few weeks, though, the trend has been weakening: Momentum now favors value stocks.
Prices have yet to confirm the change in leadership, but rotation is the lifeblood of a bull market. With Industrials breaking out to new highs, other value-oriented spaces like Financials, Energy, and Materials could follow with outperformance of their own in the weeks and months ahead.
We’ve discussed our favorite ways to participate in our weekly notes to members, highlighted below.
We write about some of our favorite stocks and share other investment ideas each week. Here are links to our most recent sector and asset class reports.
(Premium) Health Care Sector Update – June
(Premium) Utilities Sector Update – June
(Premium) Real Estate Sector Update – June
(Premium) Consumer Staples Sector Update – June
(Premium) Energy Sector Update – June
(Premium) Materials Sector Update – June
(Premium) Industrials Sector Update – June
(Premium) Financials Sector Update – June
(Premium) Information Technology Sector Update – June
(Premium) Communication Services Sector Update – June
(Premium) Consumer Discretionary Sector Update – June
The post July Technical Market Outlook first appeared on Grindstone Intelligence.


