Know What You Own
The sector ETFs aren't what you think
Today’s post isn’t long, but it’s important.
We’ve been seeing some posts floating around on social media about how the Utilities are the best-performing S&P 500 sector in 2024, and we feel like that needs to be addressed.
The Utes have done well this year, but they are NOT #1.
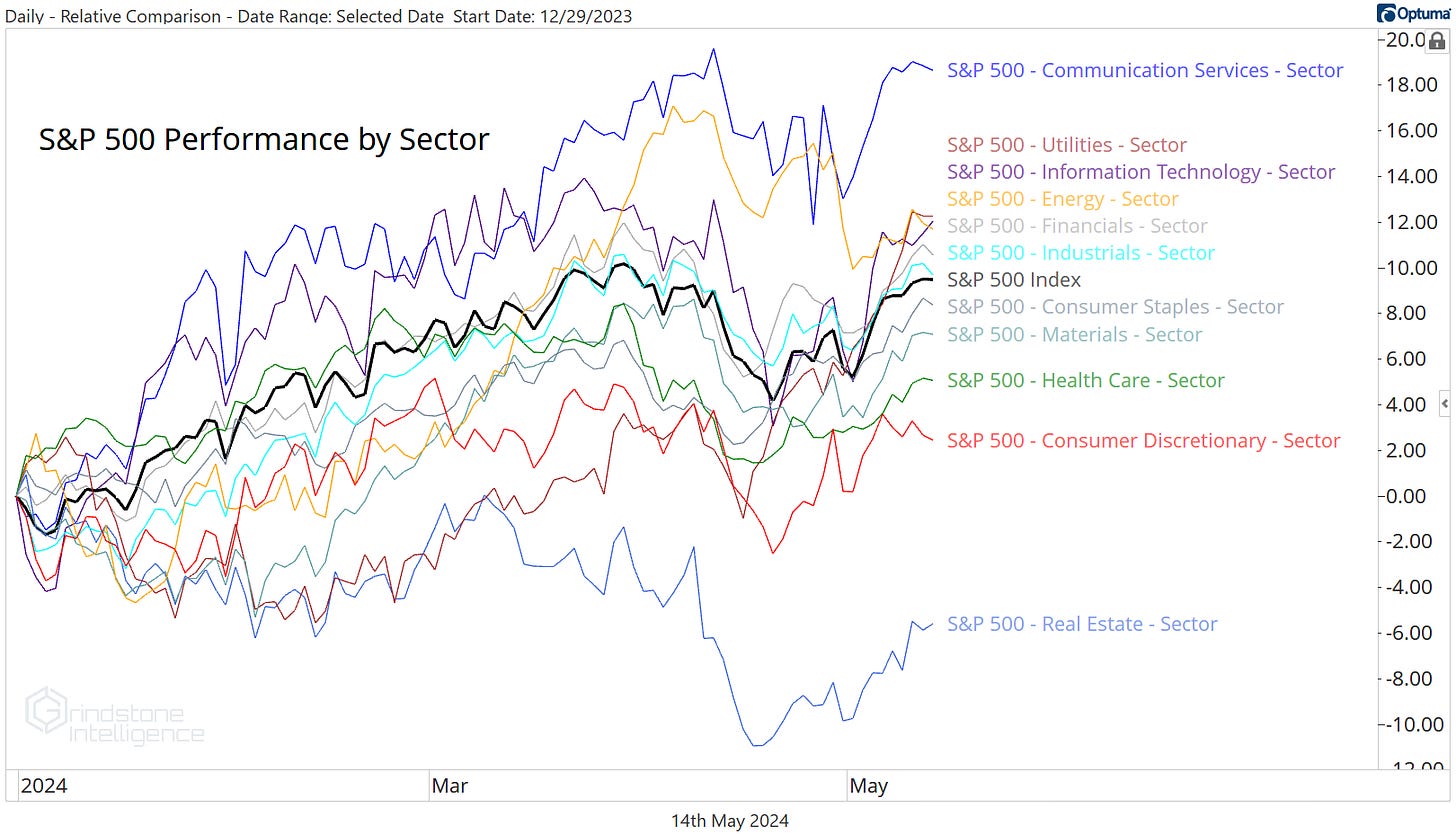
Communication Services is still out front, and by a fairly wide margin. Here’s the year-to-date S&P 500 sector performance derby:
So what’s causing the confusion? Are people just that ill-informed? Or is there something else going on?
The problem can be traced to the difference between following the market and following an ETF that attempts to track the market.
As a general rule, we try to always use indexes at Grindstone. We want to analyze the market in its purest form - not one that’s been diluted by fees or the decisions of individual managers - and then we can look for the best vehicle to use afterward.
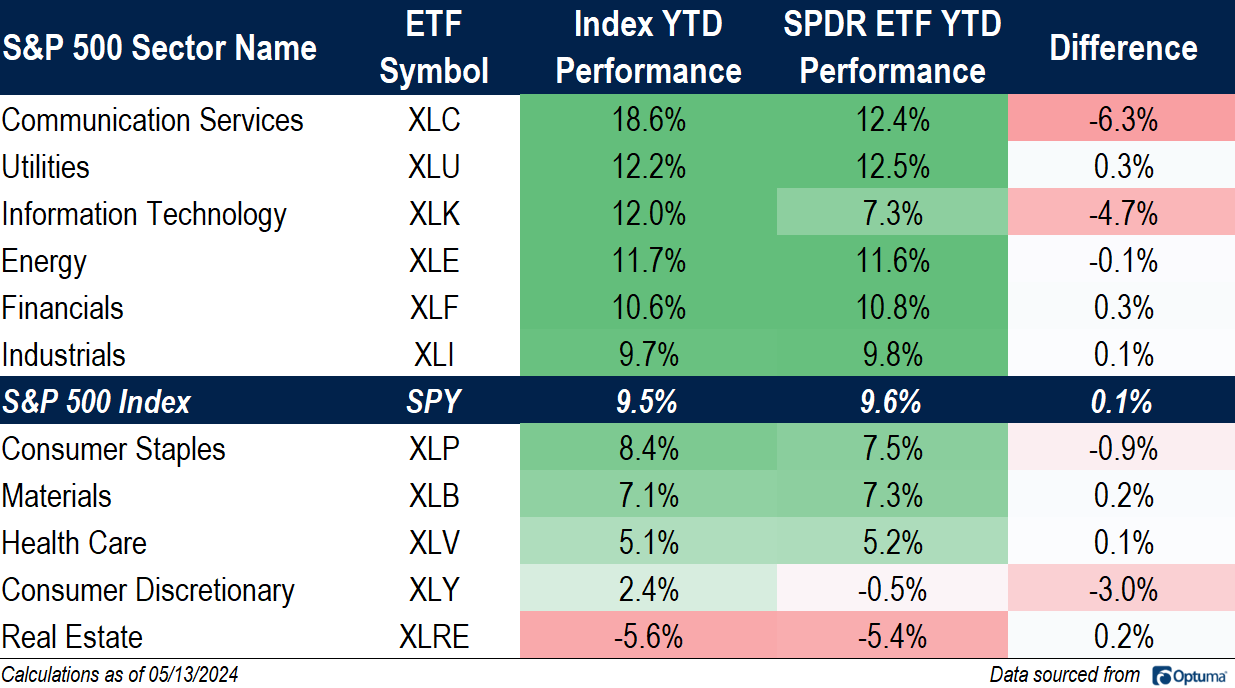
Usually their isn’t much distinction between our analysis and that of those using funds to track sector or industry performance. This year, however, the popular SPDR Sector ETFs have done an especially poor job of reflecting the true market action. As a result, XLU, the Utilities ETF, has outperformed all the other sector ETFs.
Take a look at what’s happened. The Communication Services ETF (XLC) has lagged the sector index by 6%. The Information Technology ETF (XLK) has understated the sector’s performance by almost 5%. And XLY has underperformed the Consumer Discretionary sector by 3%.
How did that happen? It’s not that State Street dropped the ball. Their ETFs did exactly what they were designed to do and they’ve tracked their benchmarks admirably. The problem is that their benchmarks aren’t what most people think they are.
The S&P 500 is a market cap weighted index, meaning the largest stocks are the most important. The sector indexes are the same way - each stock’s importance within the sector is directly related to the market capitalization of the stock.
The select sector ETFs use what’s called a Modified Market Cap Weighting. That ‘modification’ keeps any single company from exceeding a 25% weight in the fund and keeps the sum of all companies with weights greater than 4.8% from exceeding 50% of the total. Here’s a summary of their process for reducing the weights of companies that violate their modified market cap thresholds:
If any company has a float-adjusted market cap weight (FMC) greater than 24%, the company’s weight is capped at 23%, which allows for a 2% buffer. This buffer is meant to mitigate against any company exceeding 25% as of the quarter-end diversification requirement date.
All excess weight is proportionally redistributed to all uncapped companies within the relevant index.
After this redistribution, if the FMC weight of any other company breaches 23%, the process is repeated iteratively until no company breaches the 23% weight cap.
The sum of the companies with weights greater than 4.8% cannot exceed 50% of the total index weight. These caps are set to allow for a buffer below the 5% limit. If this rule is breached, rank all companies in descending order by FMC weight, and reduce the weight of the smallest company whose weight is greater than 4.8% that causes the breach to 4.5%. This process continues iteratively until the rule is satisfied.
These rules are causing BIG distortions.
Let’s briefly walk through Communications. Alphabet’s market cap share of the Communication Services sector going into the quarterly rebalance stood north of 40%. But since the weight is capped at 23% in the ETF, that means the ETF only gets about half of the GOOGL weight it’s supposed to. Meta was north of 25%, too. Result? Underweight META. Put those two together and you’re at a 46% weight for the ETF, a little more than 20% below what their true market cap share is. Now we have to distribute that 20-odd percent across the remaining 17 companies in the sector, which pushes another 6 companies above a 4.8% weight.
Except GOOGL and META are already at 46%, and adding any company at more than a 4.8% will violate the 50% cap in rule 4. So each of those 6 companies is iteratively reduced to a weight 4.5%. It’s a messy process that effectively overweights each of the smallest companies in the sector and underweights the largest.
There’s also a large distortion for the Tech sector. Microsoft and Apple were the two largest stocks in the sector at quarter end, and neither were in breach of the 24% market cap share threshold. So far, so good. But then add in NVIDIA, at about a 17% weight, and you’ve got a problem. Since the 3 together represent 60%, rule 4 is broken. To correct that, “reduce the weight of the smallest company whose weight is greater than 4.8% that causes the breach to 4.5%.” So the weights of MSFT and AAPL aren’t changed, but NVDA goes from a 17% weight to a 4.5% weight.
NVIDIA is the second-best stock in the entire S&P 500 so far in 2024, yet XLK is underweight the stock by 12%. No wonder we’ve got performance distortions.
We’re not here to bash the ETFs - these modifications could have resulted in outperformance of the true market just as easily as they have underperformance. All we’re saying is that it’s important to know what you own.
That’s all for today.


