Leaders and Losers: Industry Trends - 2/22/2024
We put a lot of emphasis on a top-down approach here at Grindstone. Yes, there’s tremendous value to be had in a bottom-up technical approach, too, which is why we sift through thousands of charts of individual stocks each month. When we’re just checking the charts of individual stocks, though, we can miss out on big themes in the market – especially if we aren’t in tune with the fundamental factors that drive each of those individual stocks.
Zooming out helps.
If you’re a regular reader of our work, you’ve probably noticed that our equity research process centers around the 11 GICS sectors. When we take groups of similar companies together, we can better identify the types of companies that are working best, and that can help us identify the most sustainable trends. And once we’re in the right zip-code, then we can spend our time deciding which companies within that zip-code we want to own.
Today, we’re going a step deeper than those sector-level trends and moving to the “Industry” level of the GICS classification system. We’re looking at which groups have performed the best over the last few weeks and months, which ones are showing bullish momentum characteristics, and which ones are setting higher highs. Here’s the rundown:
Something you should notice right away? There’s a lot of green in this table. We’ve got 67 industries to work with in the S&P 500, and 54 of them (80%) are higher over the last 3 months. 57 industries are in a cycle of new 3-month highs (meaning they’ve set a new high more recently than a new low) and 52 are in an overbought momentum cycle (overbought more recently than oversold). All of these things point toward a broad and healthy bull market - even if we do believe that sideways action for the market is the most likely outcome over the next few weeks.
Could breadth in this market be even better? Of course. Things can always be better. But 80% participation is pretty good, nonetheless. So if this is a broad and healthy bull market, we want to err on looking for things to buy
Let’s take a look at some of the most interesting industry setups.
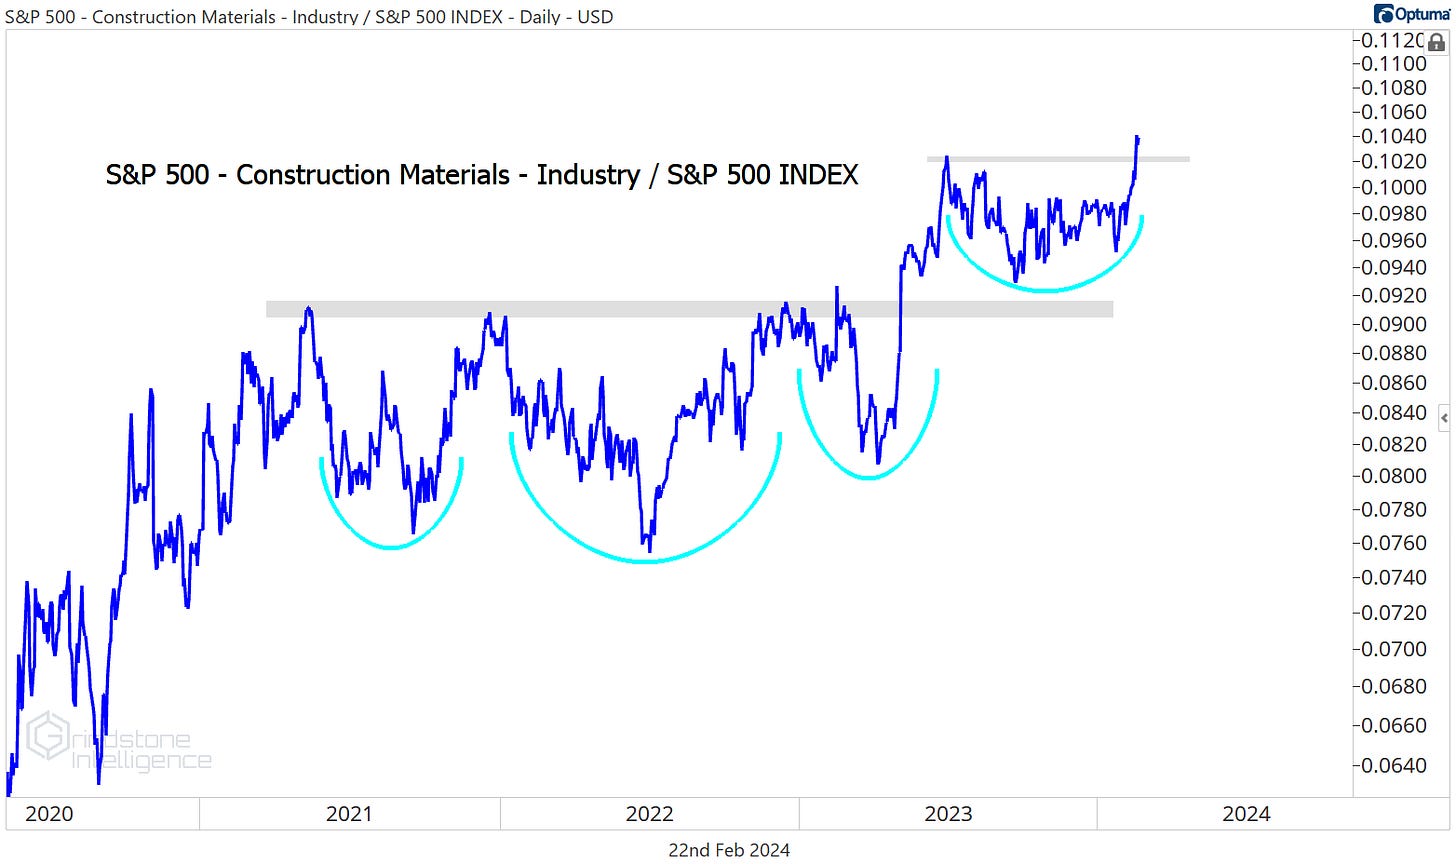
First, check out Construction Materials industry within the Materials sector. This is an area that’s pretty easy to overlook, given that the Materials sector is one of the smallest sectors in the index, and Linde makes up roughly a quarter of the sector’s 3% index weight. But this isn’t an area that we should be overlooking. Not when the industry keeps breaking out relative to the S&P 500.
Martin Marietta is a good one here. It rumbled right past our $520 target and now presents us with a new setup from the long side. As long as it’s above $518, we can own it with a target of $750.
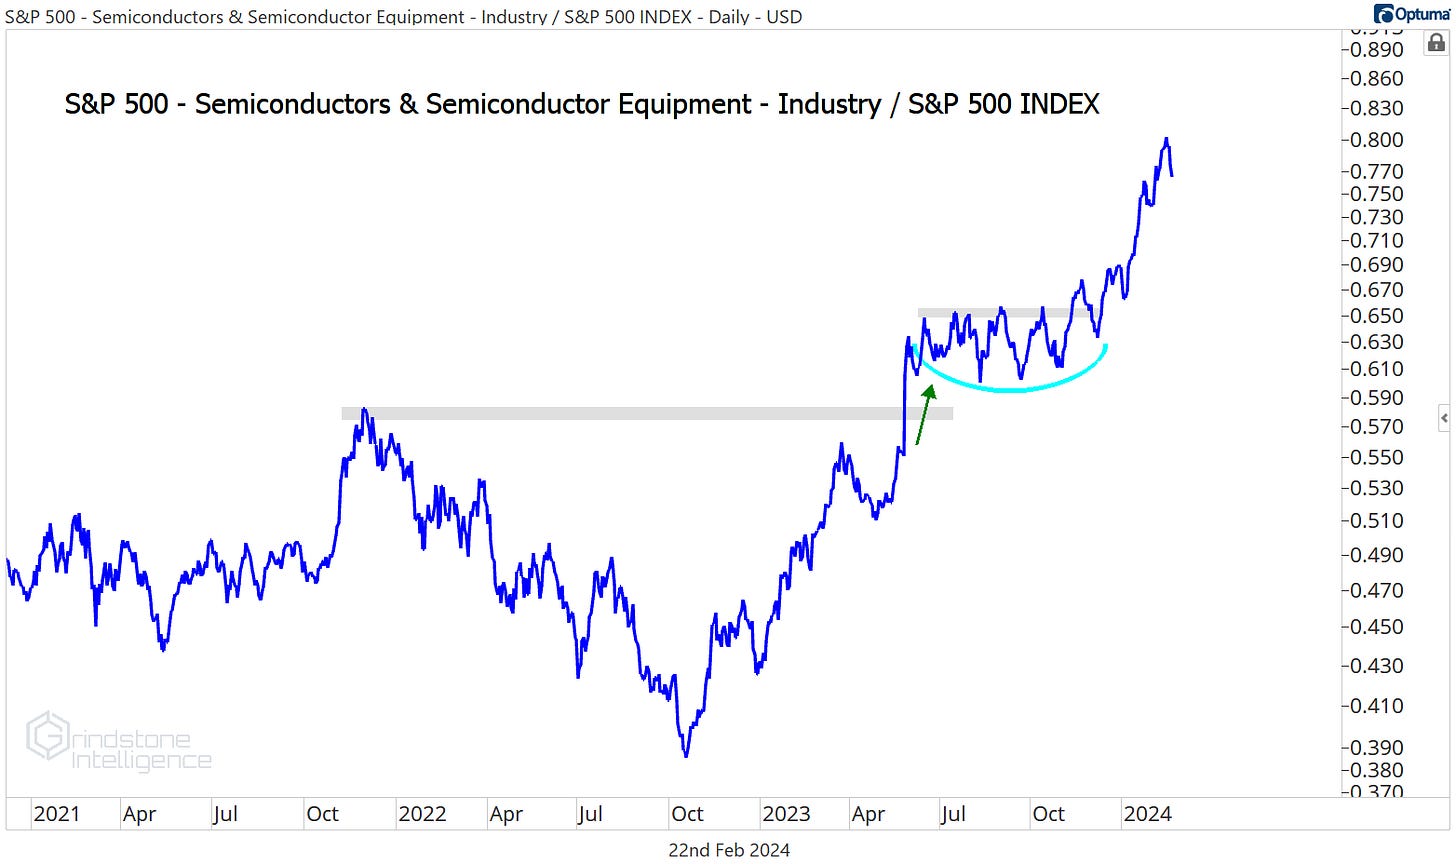
We can’t ignore the Semiconductors industry, either, though with NVIDIA dominating the headlines everyday, I don’t think that’s an issue. This group has been nearly unstoppable for the last year.
How about this base in NXP Semiconductors? We like how clearly the risk/reward is defined right here. We want to be buying a breakout above $235 with a target of $295.
Elsewhere within the Information Technology sector, Software is still in a long-term structural uptrend relative to the rest of the market. That little bearish momentum divergence for the Software/SPX ratio at the most recent high is some trouble near-term, and we wouldn’t be surprised to see another backtest of the 2021 highs. As long as that level holds, though, we can be buying Software stocks.
We like Synopsys as long as it stays above $520. Our target is $775
Within the Industrials sector, the Commercial Services and Supplies Industry has gone virtually nowhere vs. the rest of the market for the last 18 months. But it’s threatening to break out of this range to the upside.
Here’s Copart consolidating above former resistance. We like it long above $45 with a target of $65.
We know that leaders tend to keep on leading, which is why we spend most of our time on those areas. But we aren’t just focused on the groups that have been outperforming for the past few years. We also want to keep our eye out for potential downtrend reversals. Like this one in the Entertainment industry. Relative to the S&P 500, these guys just completed a multi-year bottoming process and set new 18-month highs.
This massive base in Electronic Arts has our eye. EA rose more than 1200% from 2012 to 2018, and then it spent the next 5 years digesting those gains. When the breakout comes, we want to be on board for the next leg higher.
If EA is above $150, we want to be buying with an initial target of $200.
The next potential industry reversal to keep an eye on is in Energy. If we had to make a bet today, we’d bet this relative downtrend in the Oil, Gas, & Consumable Fuels industry will continue. As long as the ratio of the industry vs. the S&P 500 is below the neckline of that 2-year, inverse head and shoulders pattern, we don’t have enough evidence to say otherwise.
But if we’re back above that neckline? That’s a different story. Stay tuned.
Until next time.


