

Leaders and Losers: Industry Trends - 11/7/2023

We put a lot of emphasis on a top-down approach here at Grindstone. Yes, there’s tremendous value to be had in a bottom-up technical approach, too, which is why we sift through thousands of charts of individual stocks each month. When we’re just checking the charts of individual stocks, though, we can miss out on big themes in the market – especially if we aren’t in tune with the fundamental factors that drive each of those individual stocks.
Zooming out helps.
If you’re a regular reader of our work, you’ve probably noticed that our process centers around the 11 GICS sectors. When we take groups of similar companies together, we can better identify the types of companies that are working best, and that can help us identify sustainable trends. And once we’re in the right zip-code, then we can spend our time deciding which companies within that zip-code we want to own.
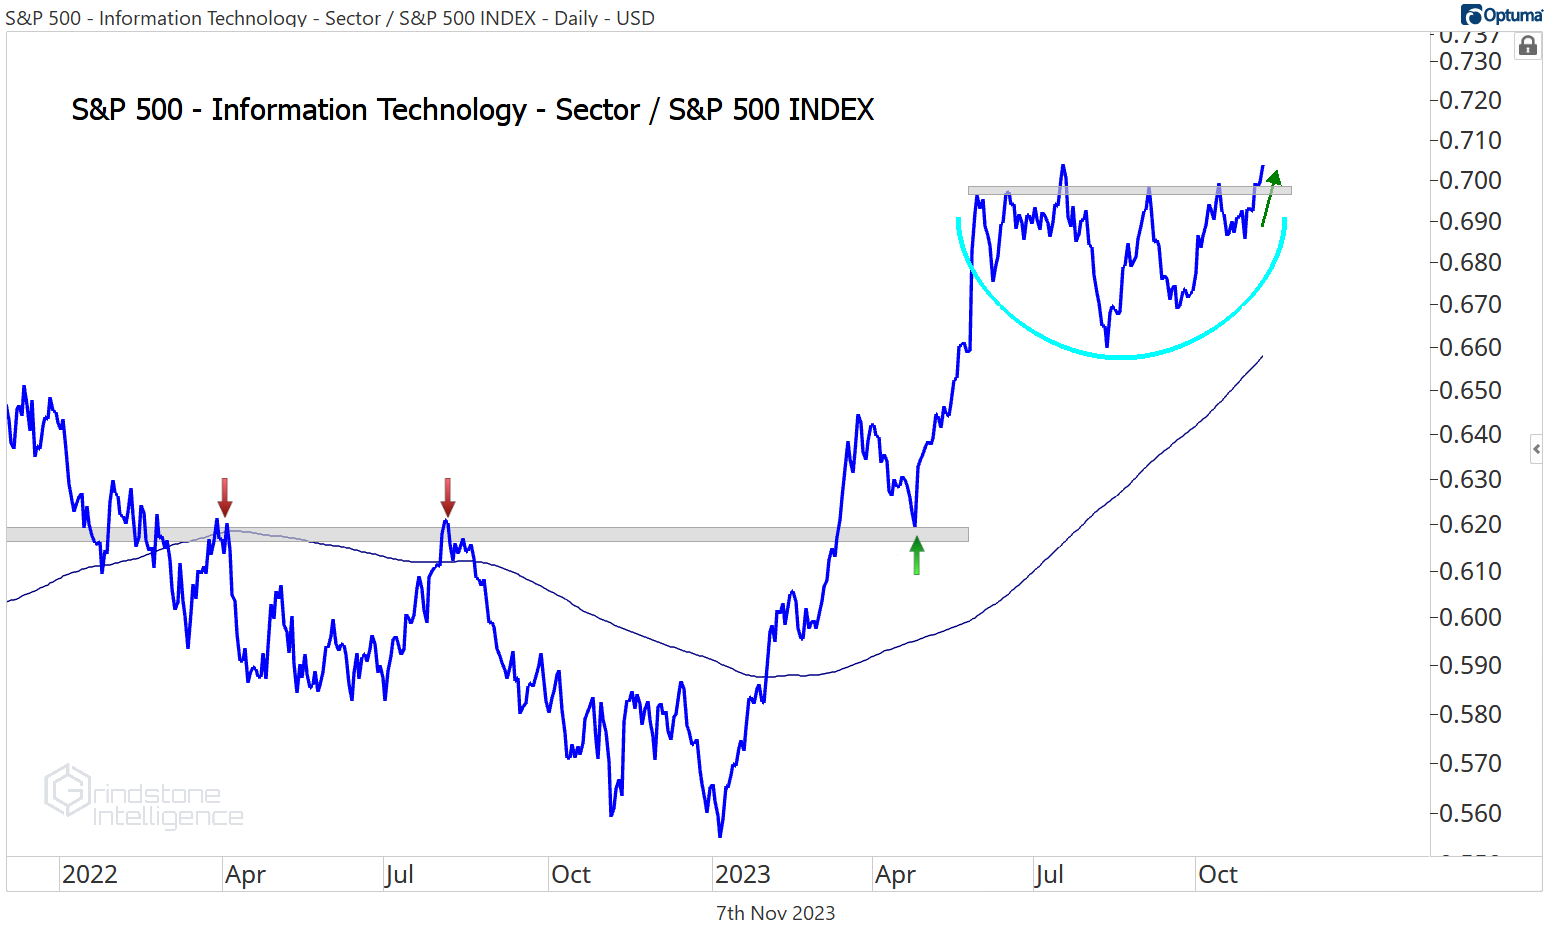
One of the most important charts right now is that of the Tech sector as it tries to break out relative to the rest of the market. Tech is a risk-on sector that tends to lead when the market is rising, so a successful resolution higher from this 5-month base would be a bullish signal for stocks on the whole.
Today, though, we’re going a step deeper than those sector-level trends and moving to the “Industry” level of the GICS classification system. We’re looking at which groups have performed the best over the last month and for the year, which ones are showing bullish momentum characteristics, and which ones are setting higher highs. Here’s what we found.
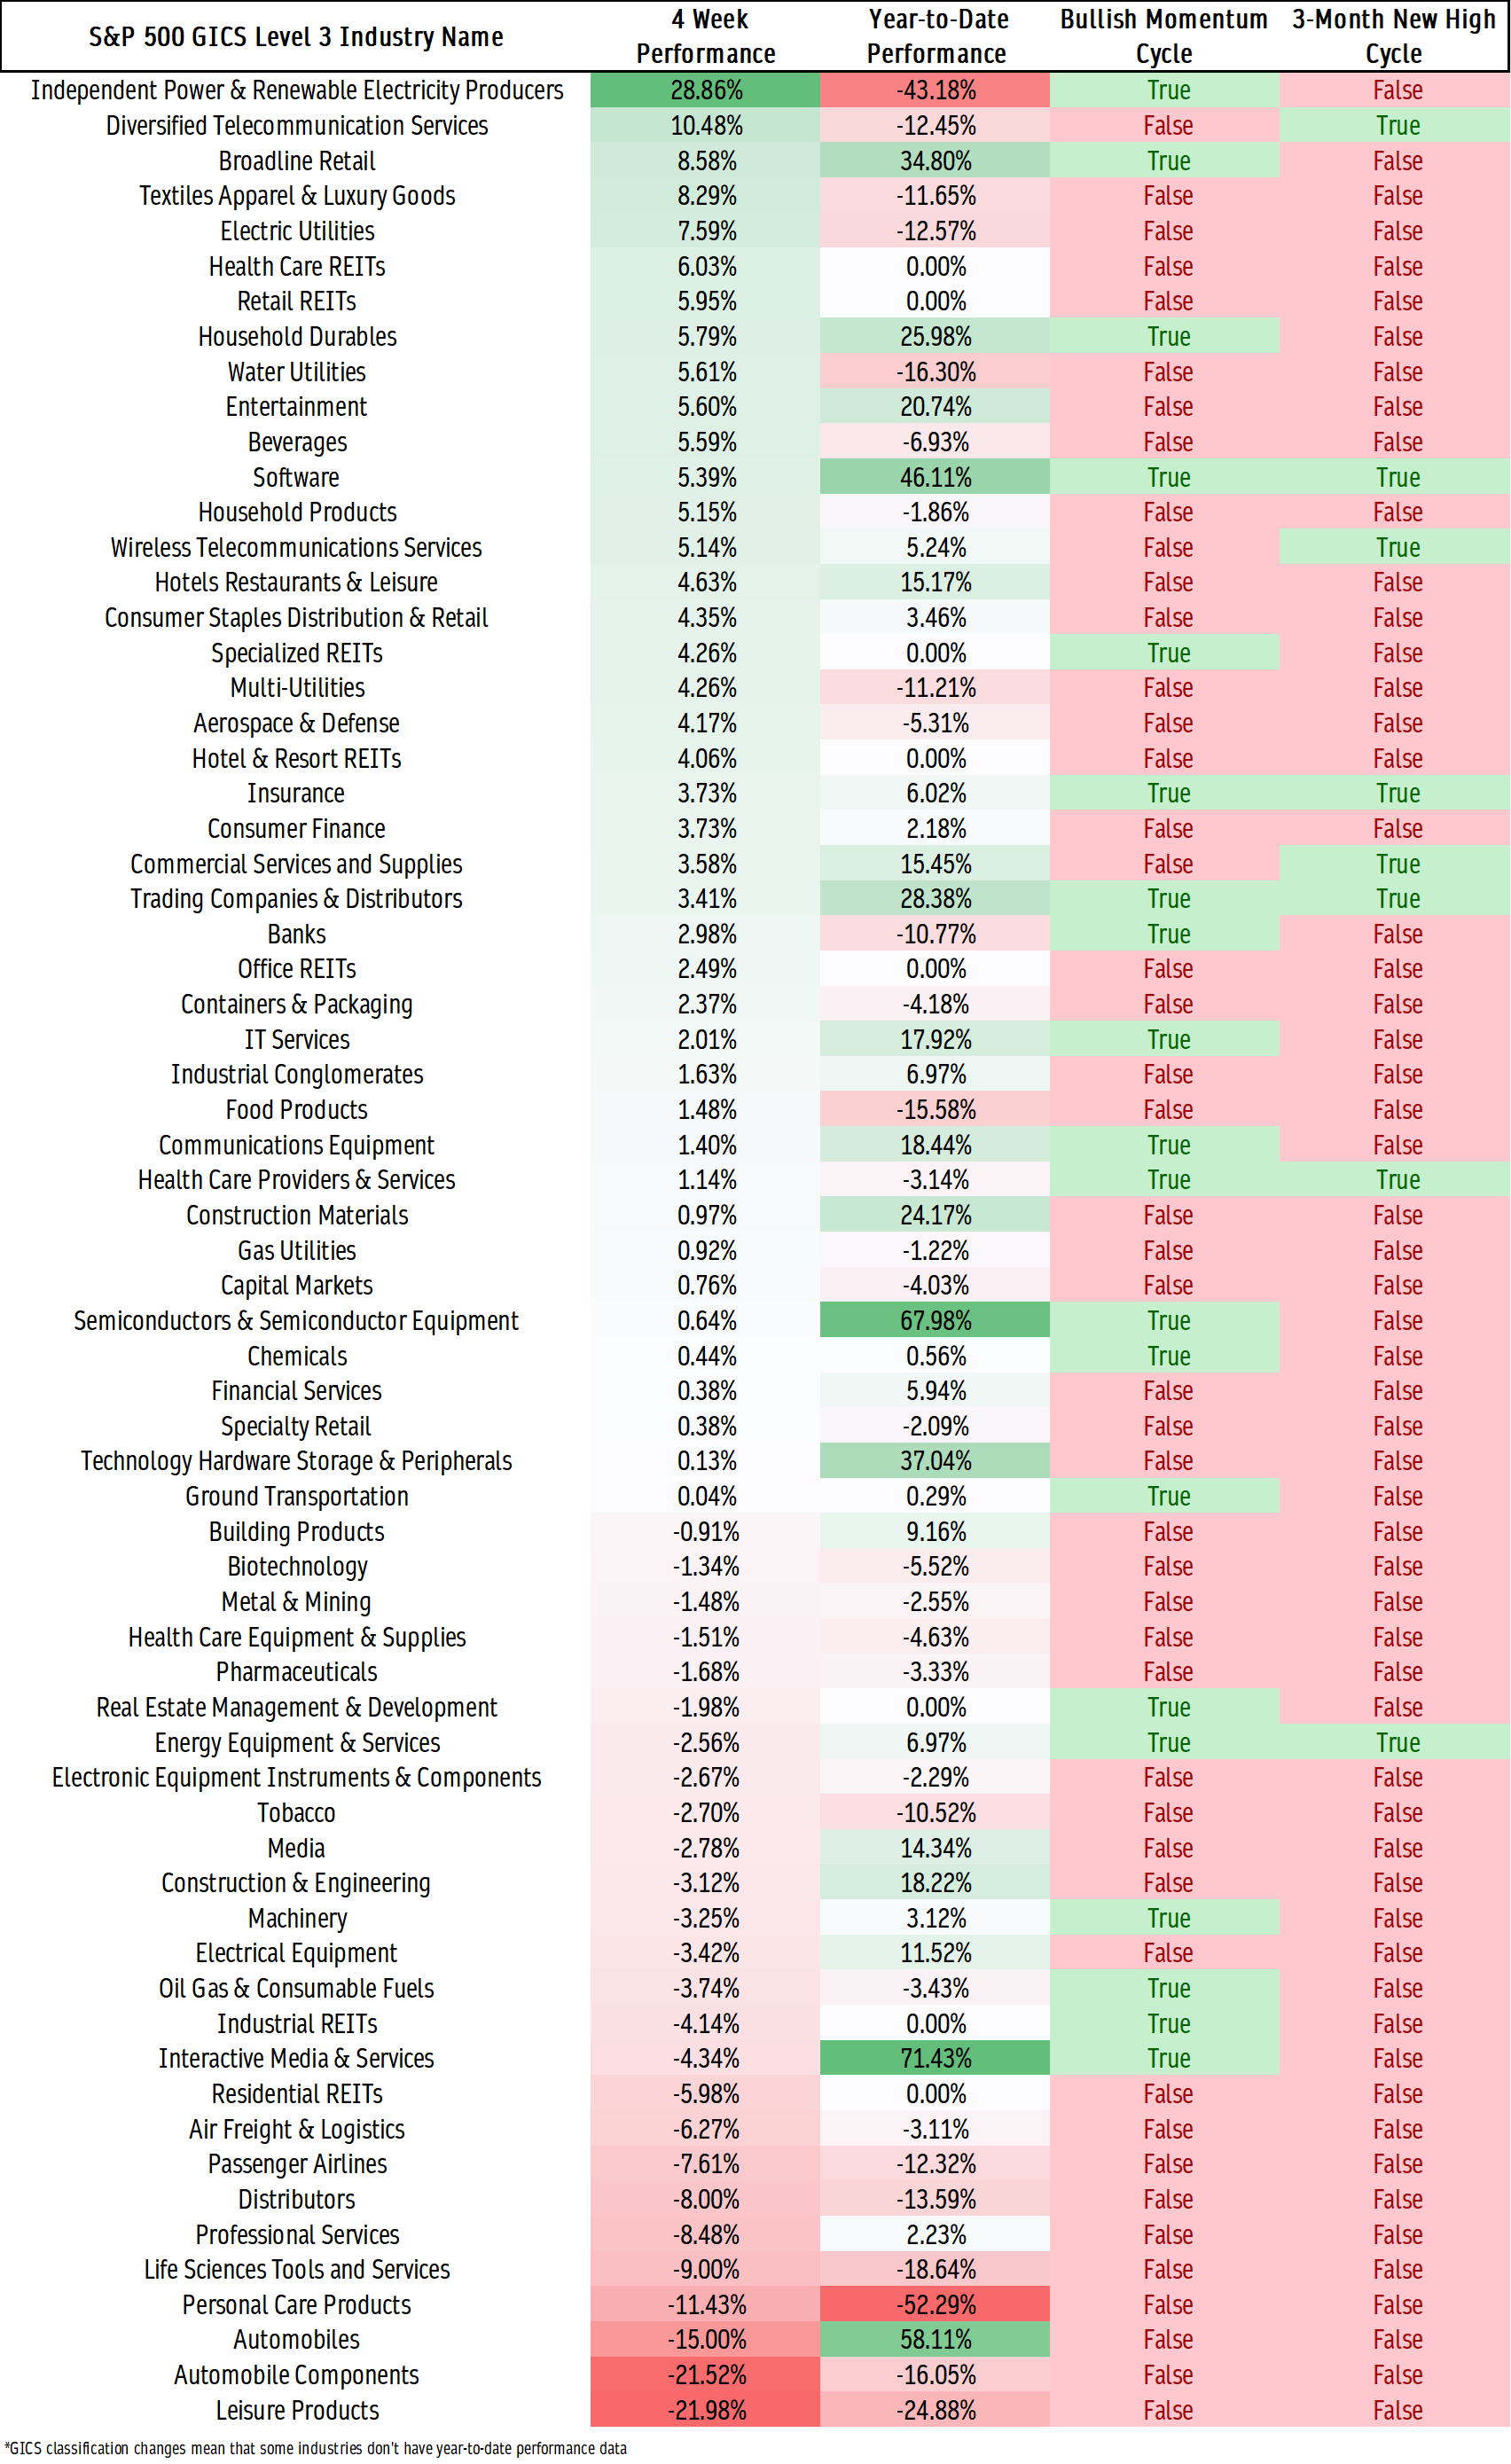
Let’s take a look at some of our favorite industry charts.
First up is software, which is consolidating just below the former bull market highs from nearly 2 years ago. This group was one of the worst places to be in 2022, as it was one of the downside leaders during the selloff. But along with the rest of Tech, it’s been a big winner in 2023.
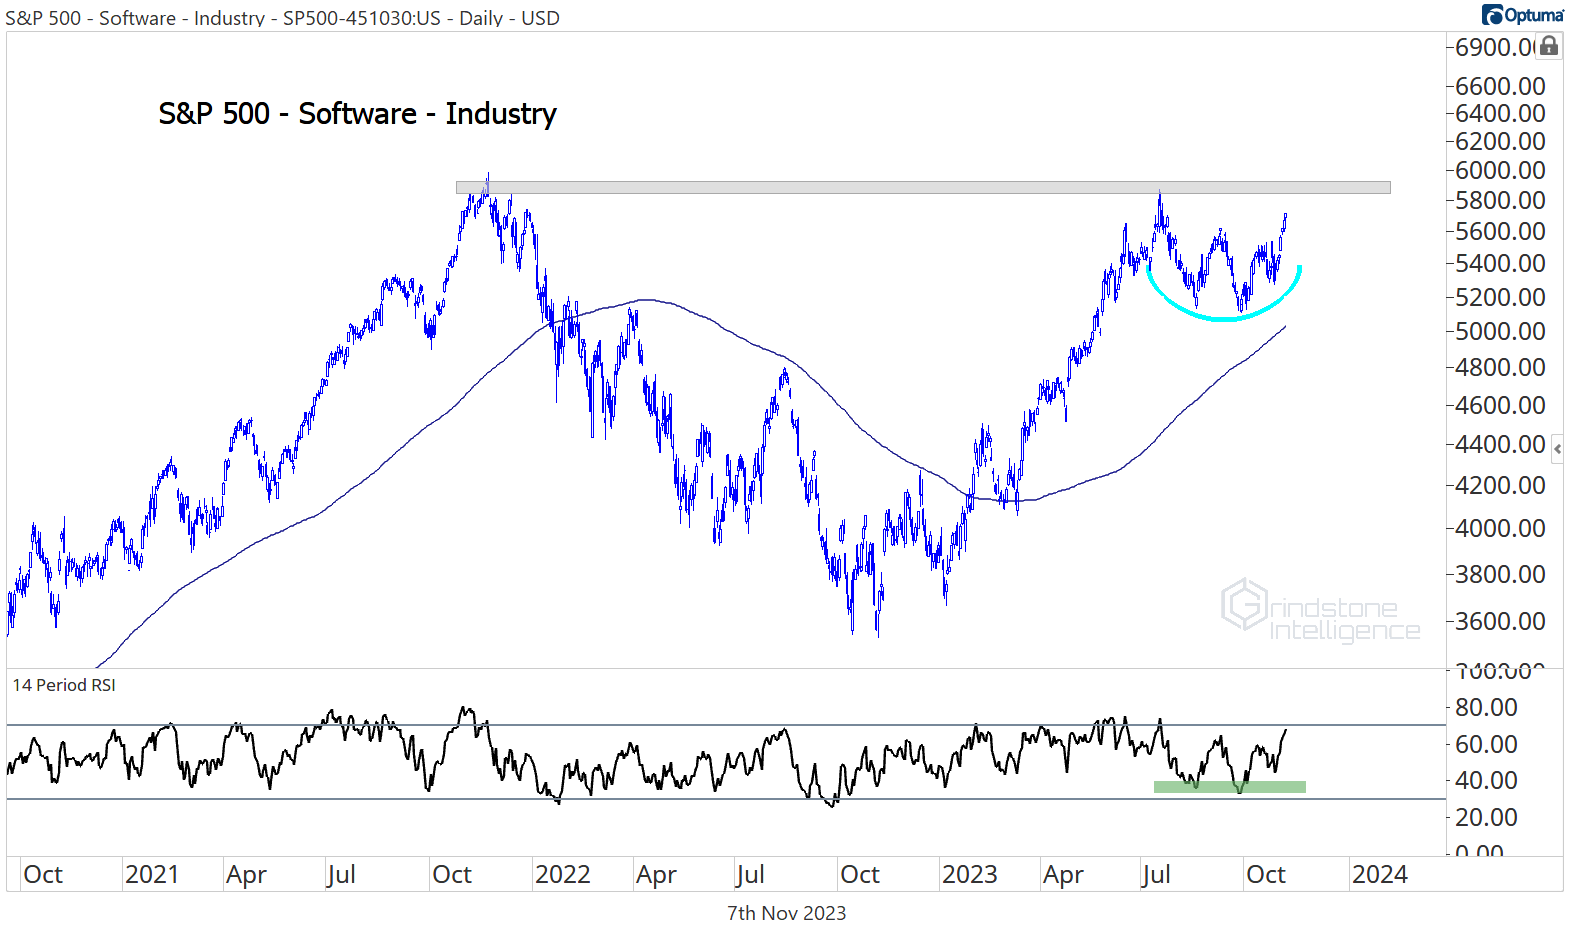
Despite the broad decline in stock prices from July through October, software has stayed above a rising 200-day moving average, and momentum has stayed out of oversold territory. Now, the industry is setting new 3-month highs. Those are all characteristics of a structural uptrend.
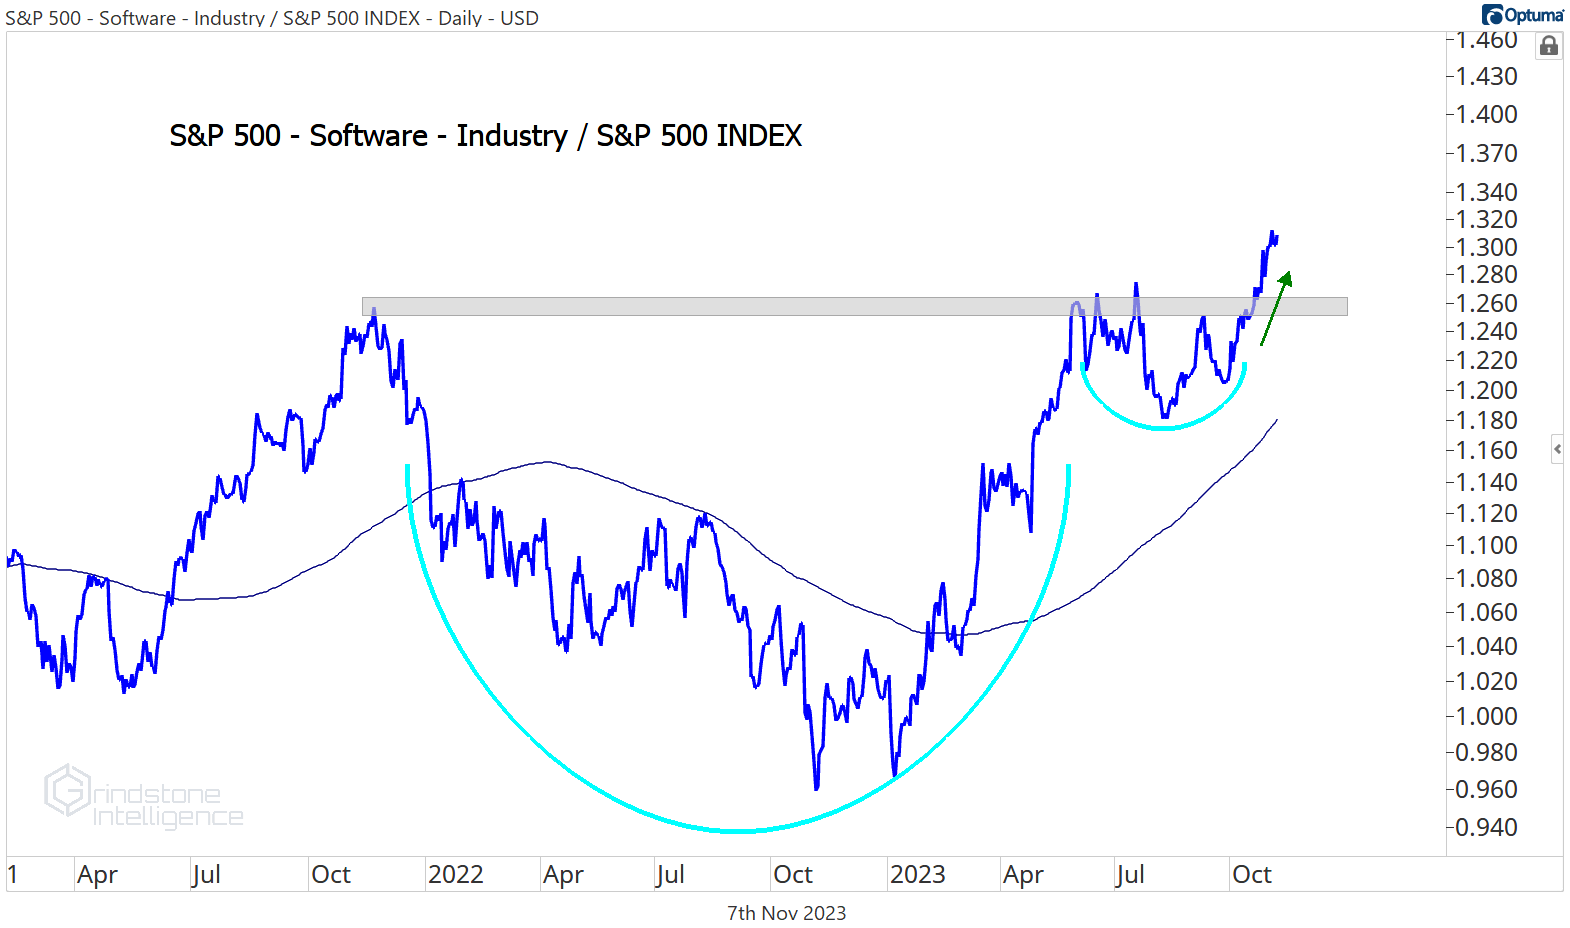
On a relative basis, software is even better - it’s already broken out of this 2-year base vs. the rest of the market. If you’re looking for stocks to buy, the software industry is a great place to start.
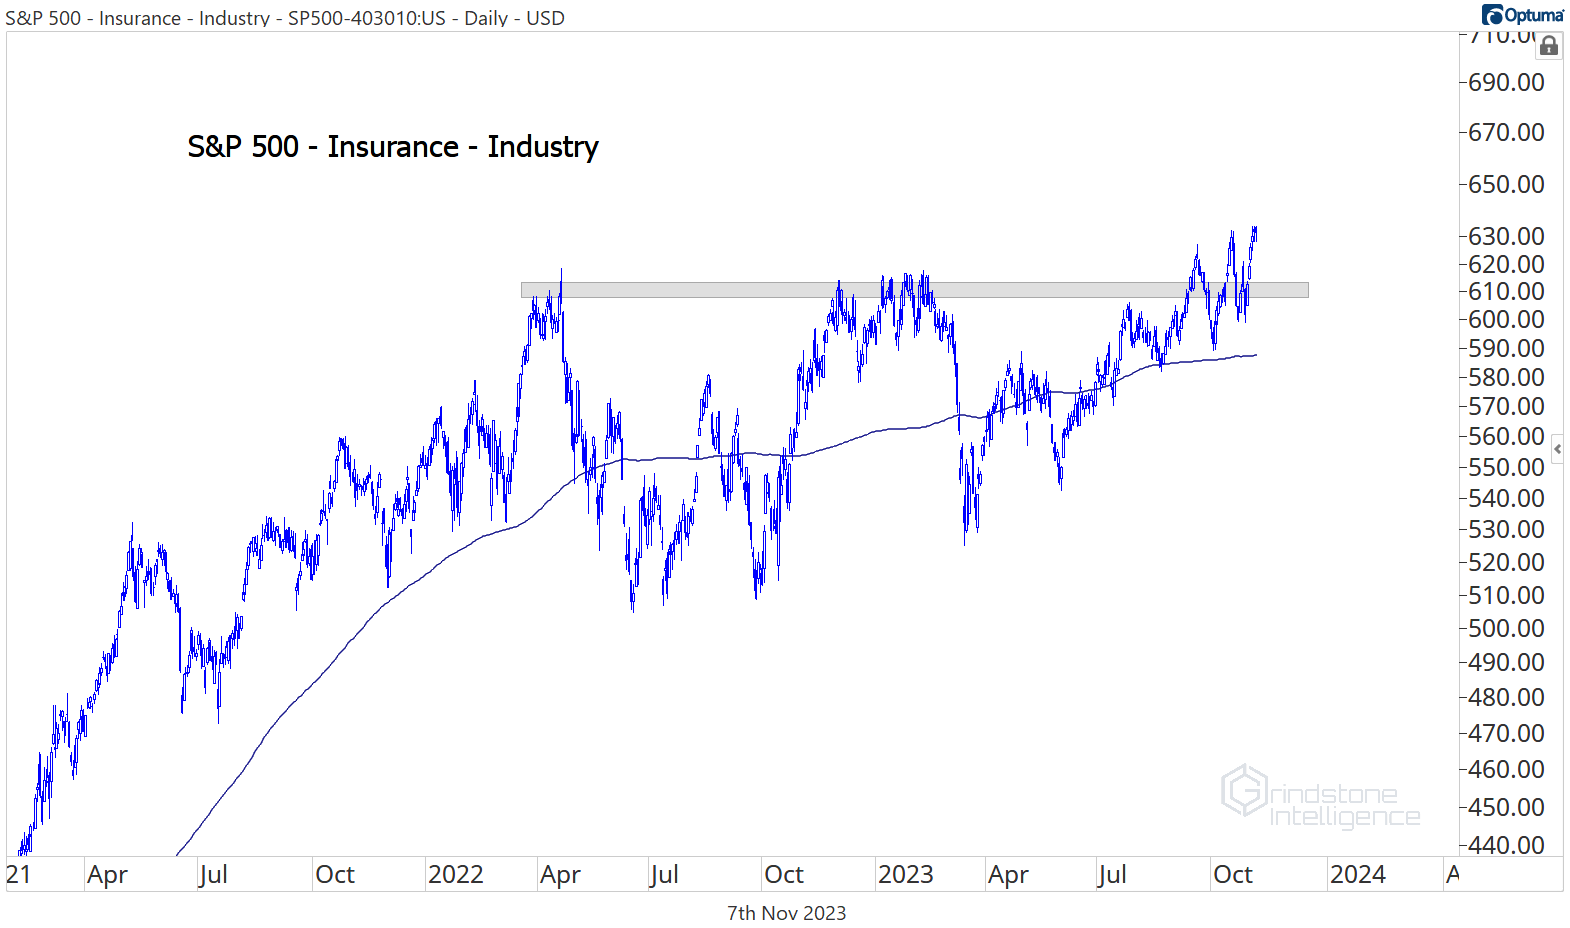
Insurance is another great candidate for long positions. While most of the market was weakening throughout the late summer and early fall, insurance stocks were breaking out above their spring 2022 highs. That’s not bearish.
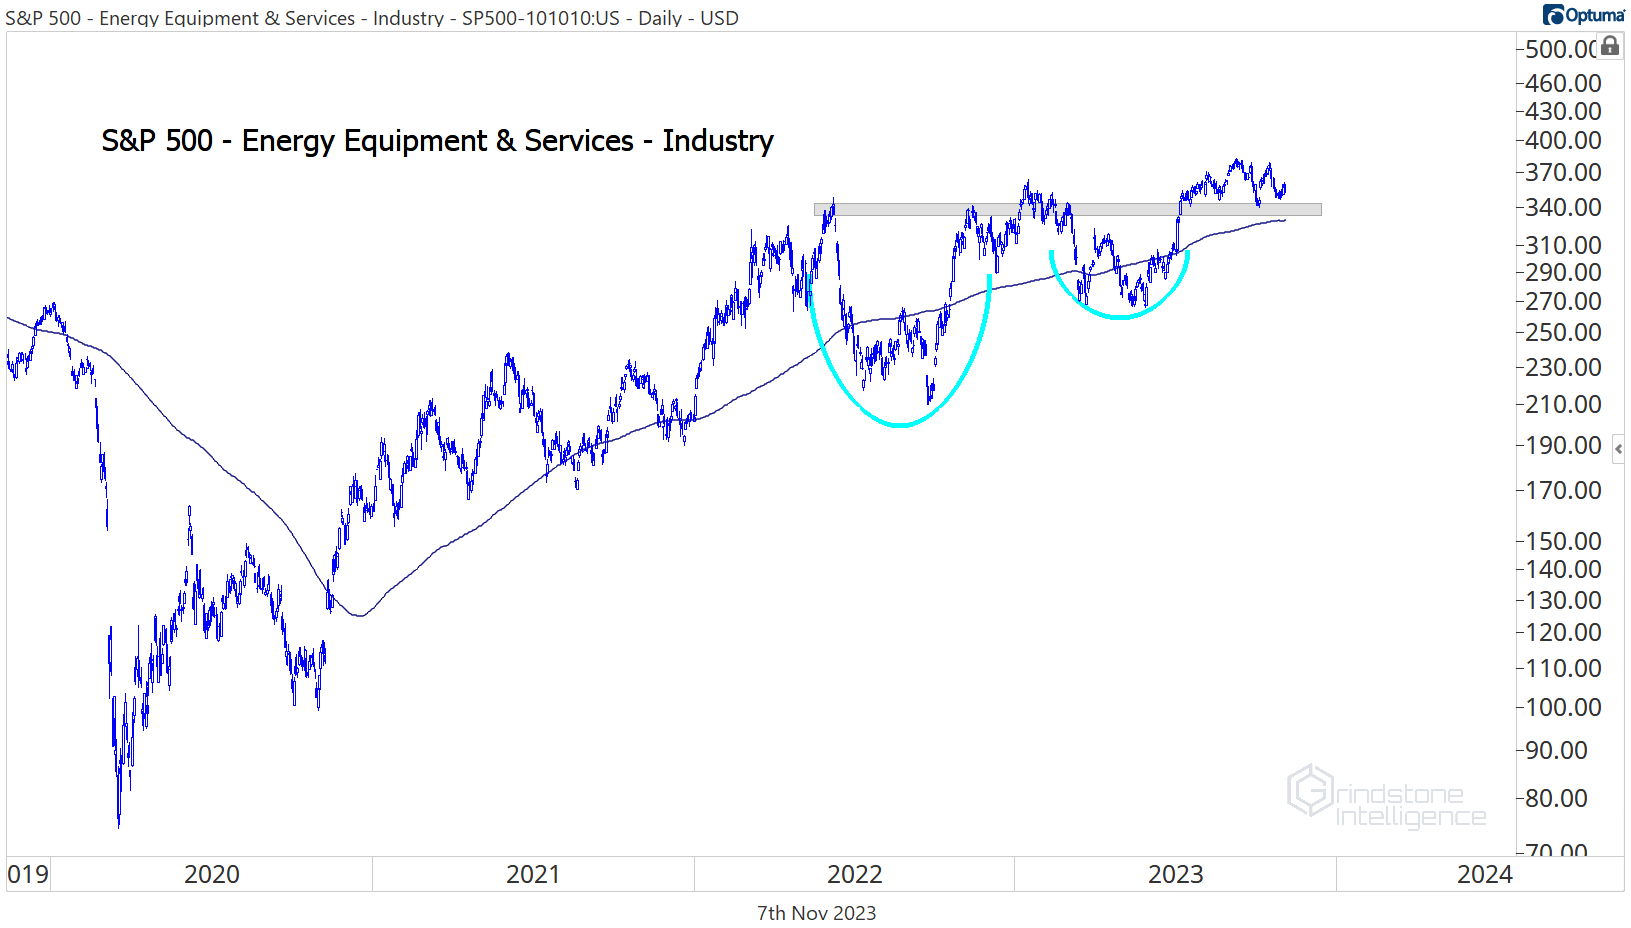
Energy stocks also continue to show relative strength, despite their underperformance over the past few weeks. Check out the energy equipment & services industry below. While the software industry above is consolidating below resistance in preparation for a breakout attempt, this group is consolidating above support. The latter formation tends to be more bullish.
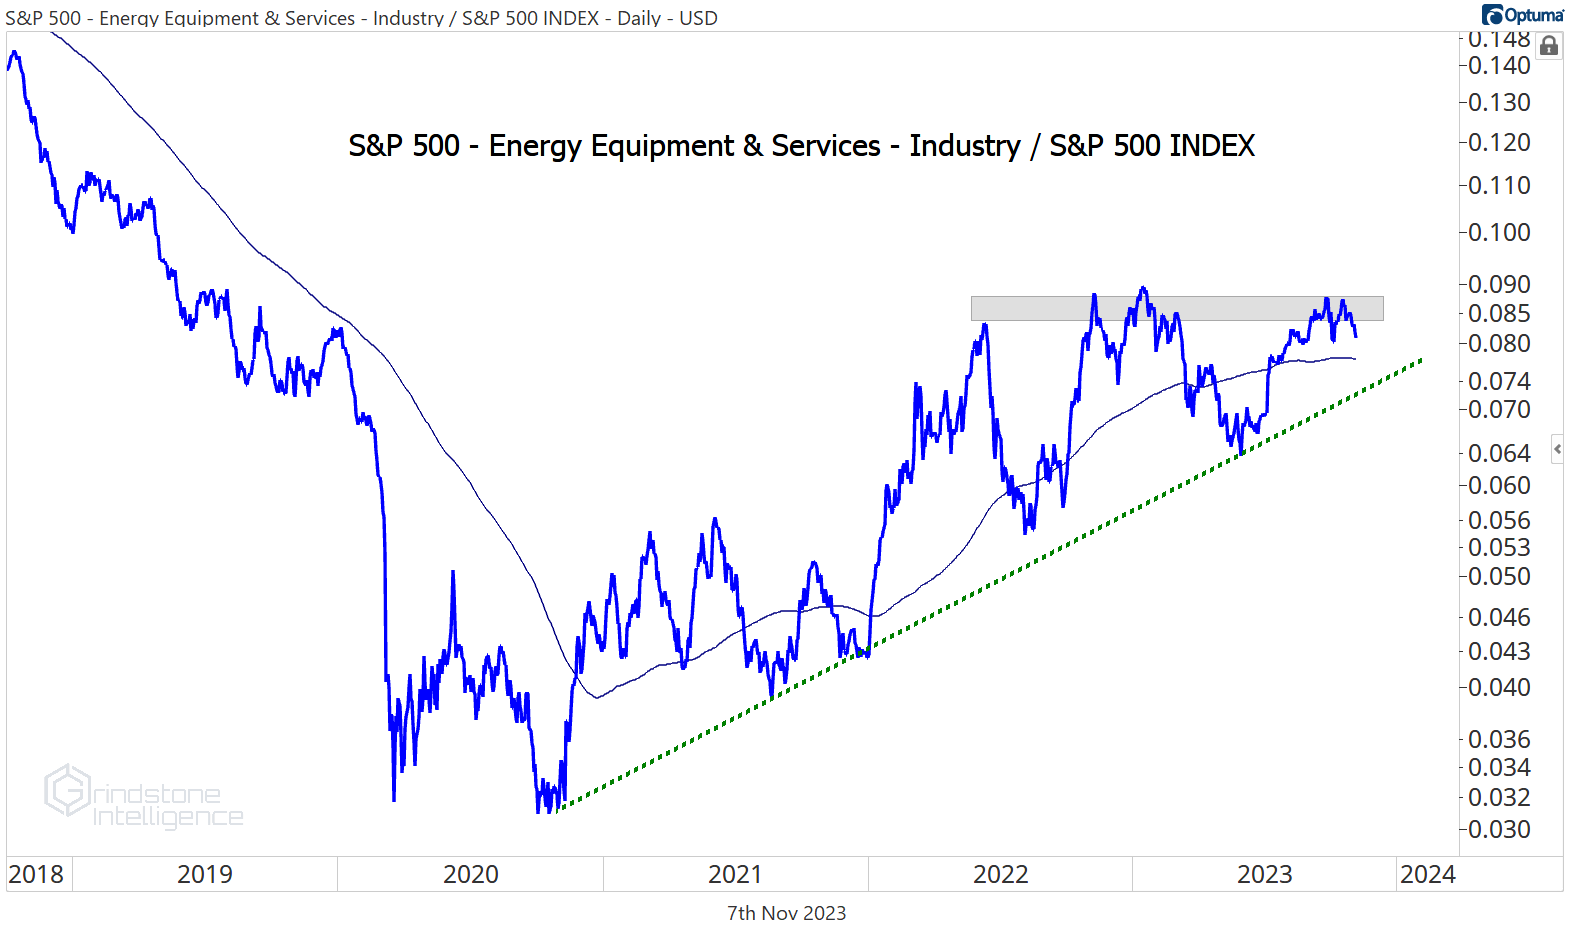
Given the ongoing breakdown in crude oil, we need to be wary of that weakness spreading to energy stocks. For now, though, the uptrend for Energy Equipment relative to the S&P 500 is very much intact. We should expect this consolidation to resolve in the direction of that underlying trend.
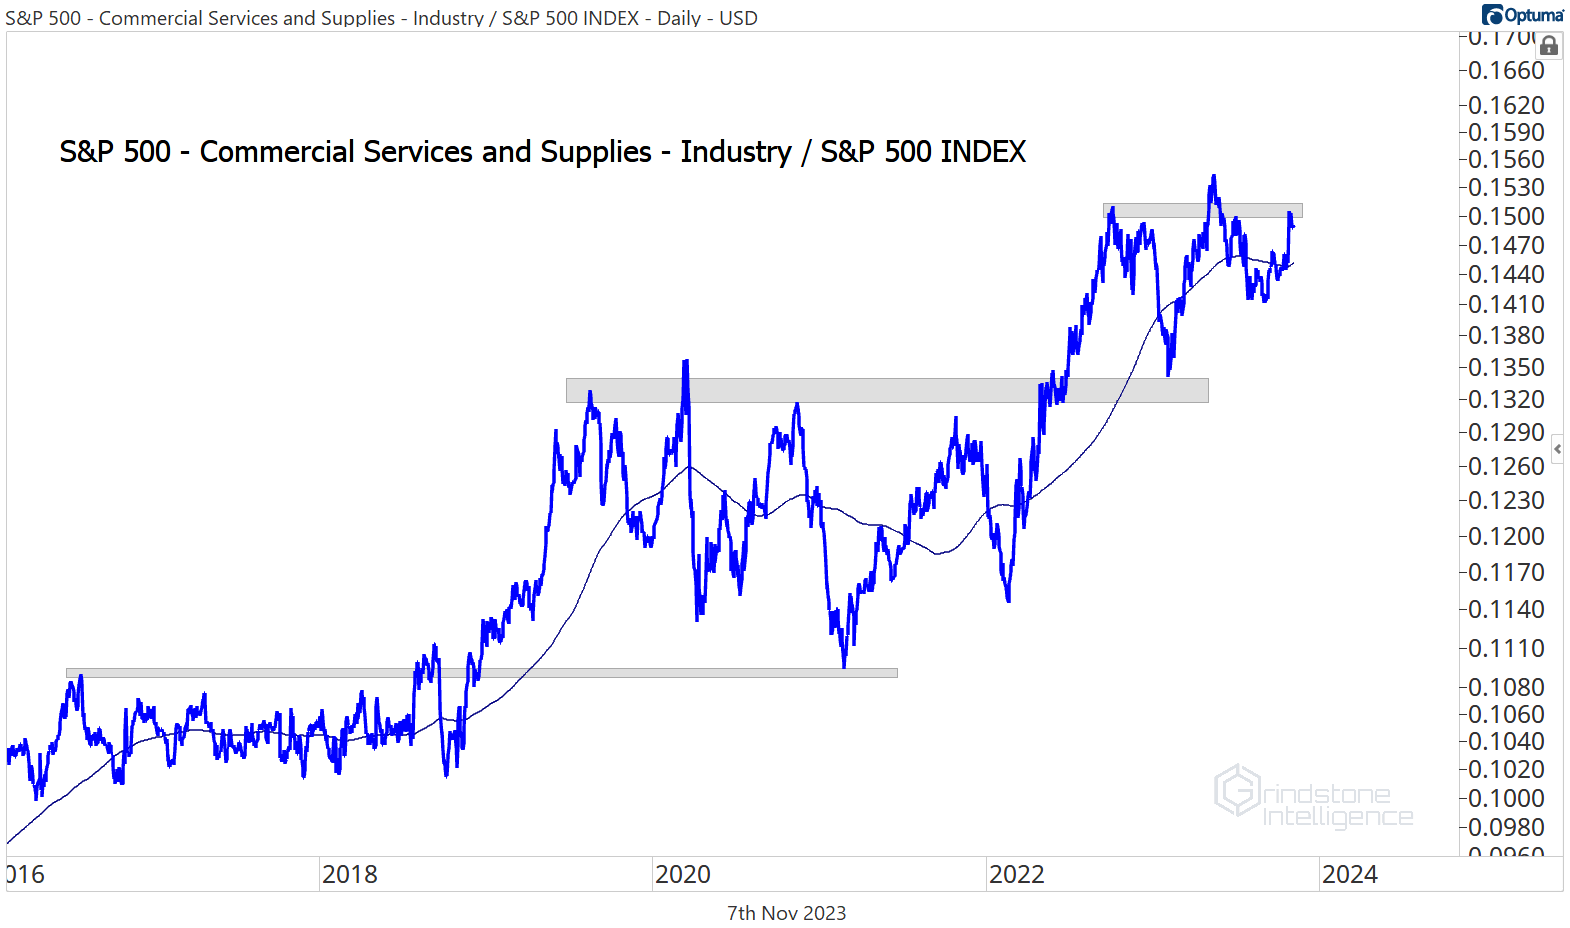
Here’s another group that’s consolidating above support. The commercial services industry broke out from an 18-month base in the spring, then successfully retested the breakdown level. Former resistance turning into support is a textbook example of polarity.
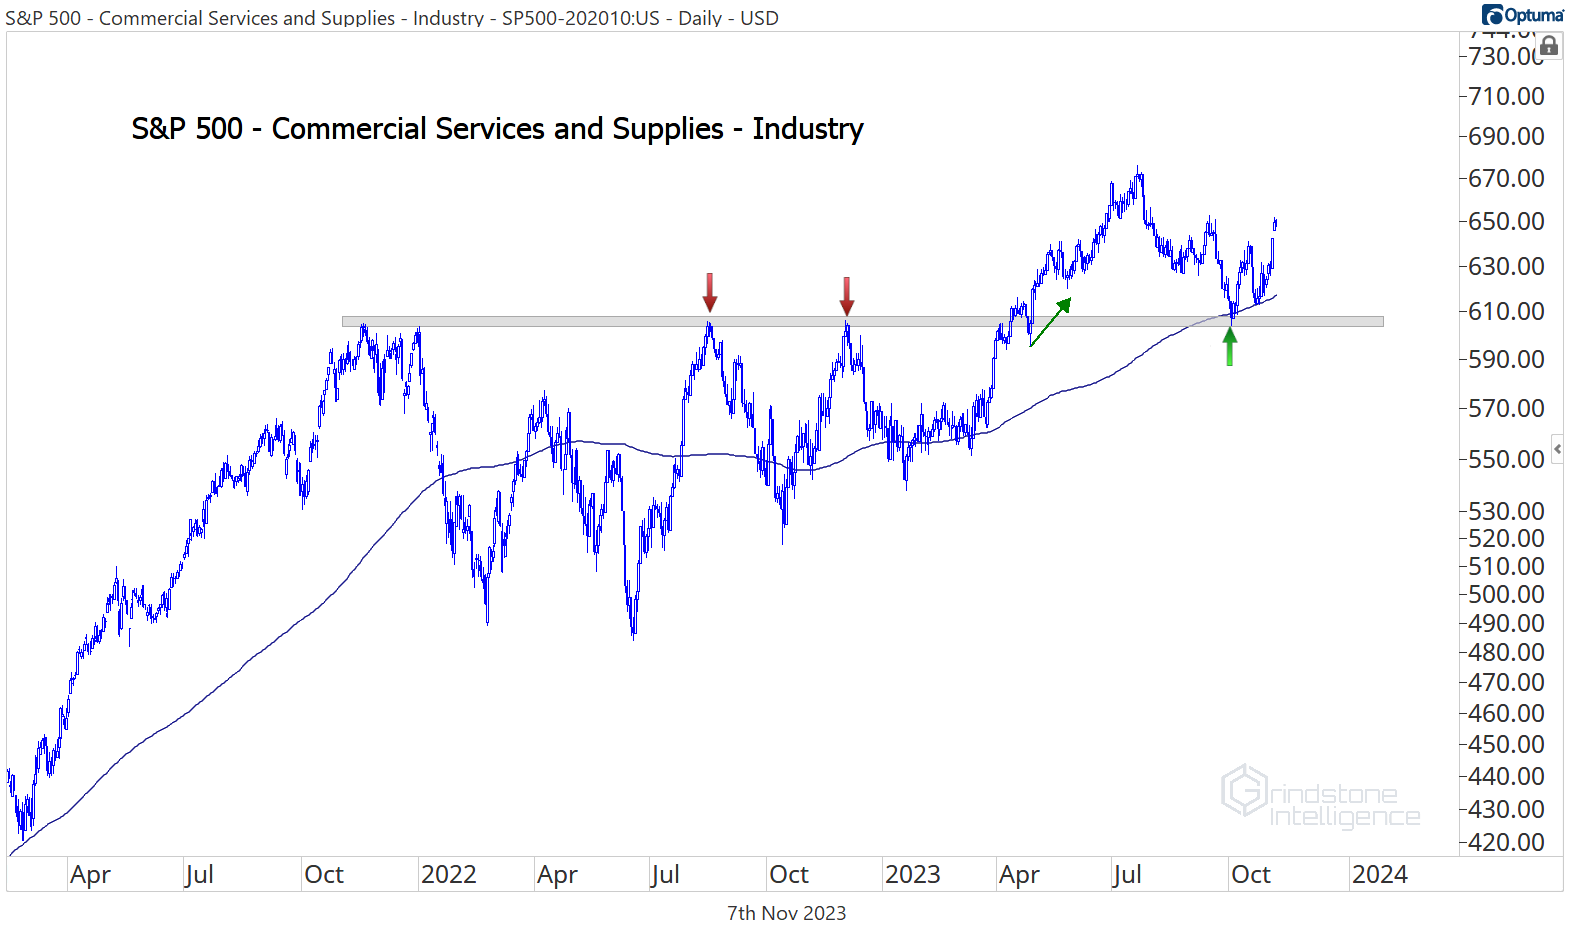
And once again, this industry is showing relative strength. Check out the pattern of the last decade for Commercial Services vs. the benchmark. Consolidation, breakout, uptrend, rinse, repeat. We want to be on board for the next leg higher.
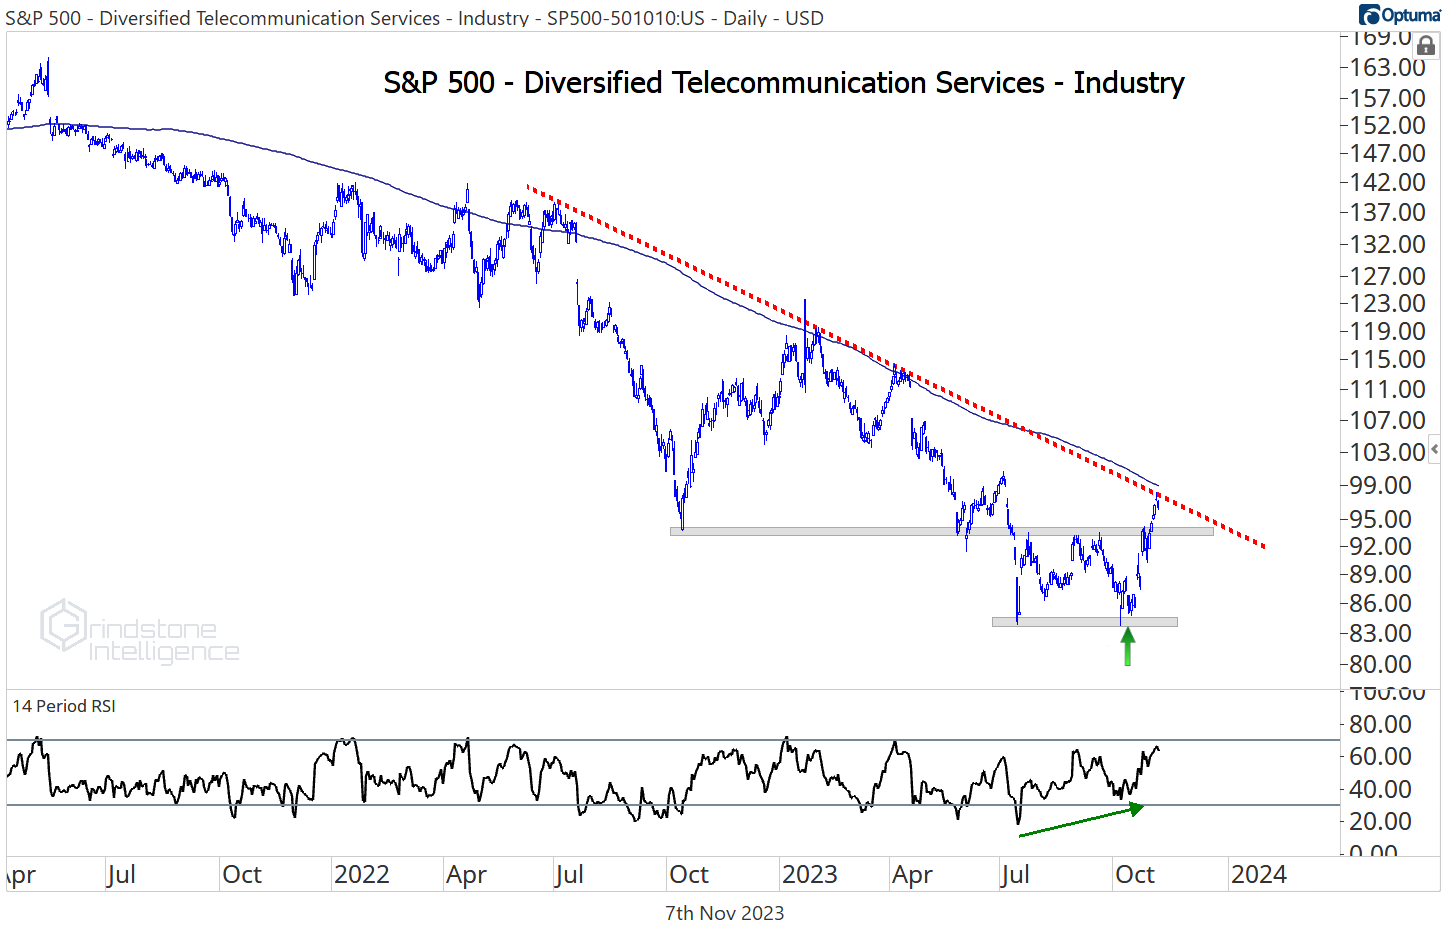
This process isn’t just about finding which industries are near their highs, though. We’re also looking for nascent uptrends. The diversified telcos industry just put in a potential double bottom, with momentum bullishly diverging at the most recent low. We’ve already gotten confirmation of the divergence with prices jumping 10% over the last month and reaching new 3-month highs. What we haven’t seen is a break of the multi-year downtrend line - but if we do, this thing has got plenty of room to run. It’s underperformed the S&P 500 by 65% over the last 5 years.
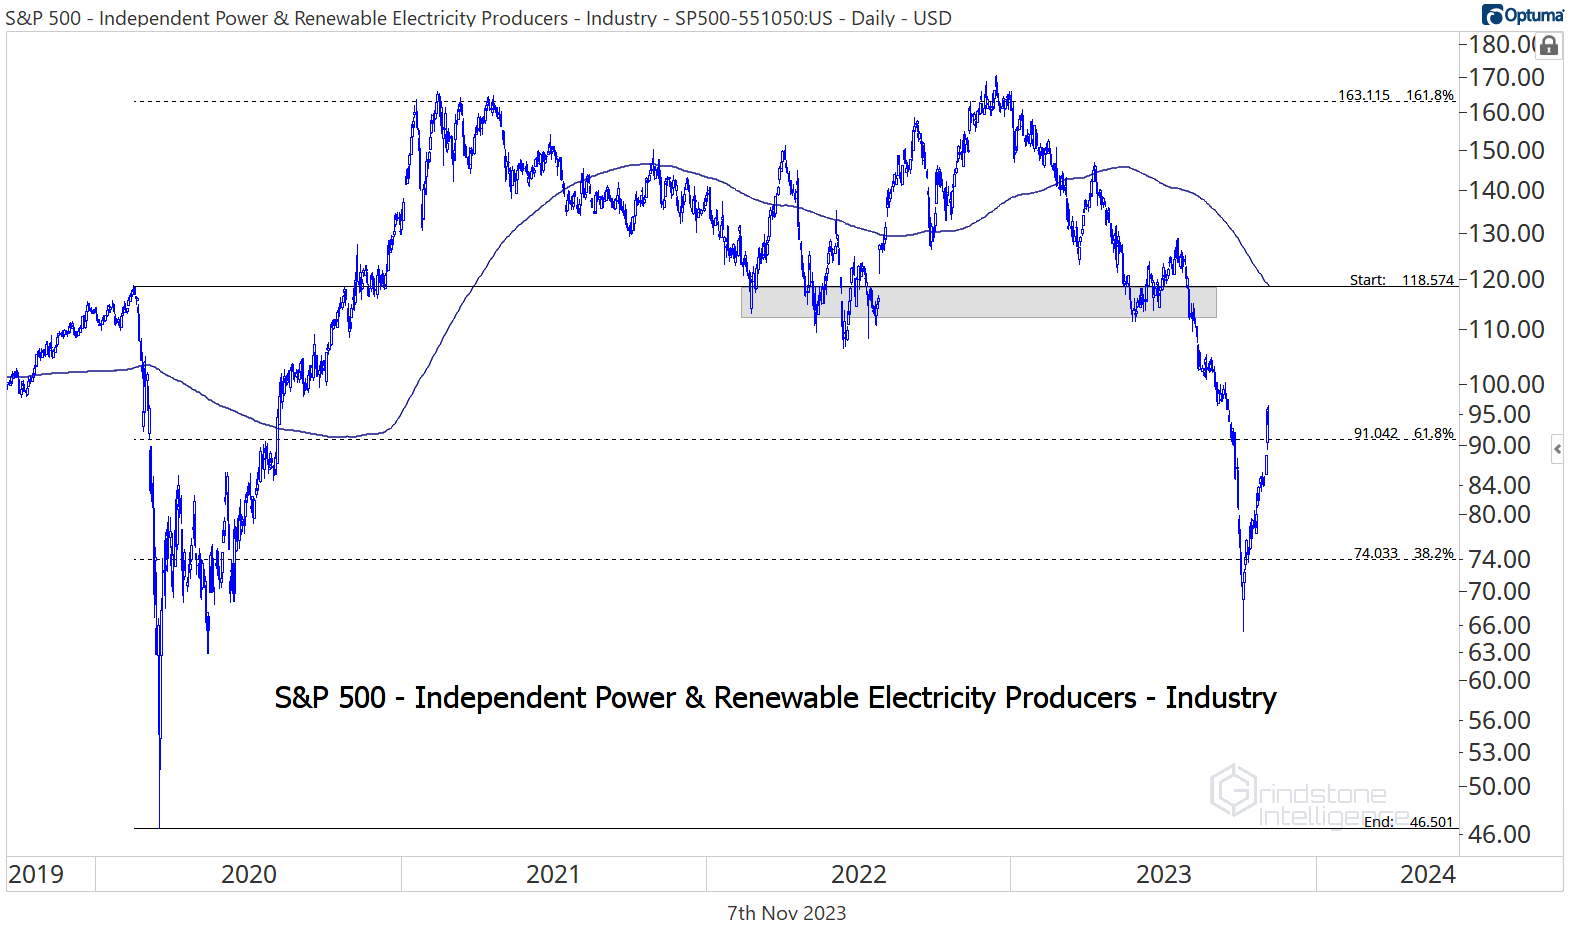
Where we aren’t seeing signs of a renewed uptrend is in the independent power and renewable electricity producers space. Sure, the group has rallied 30% over the past month and was the top-performing industry over that span. But it’s still among the worst performers for the year, sporting a 43% loss in value for 2023. The industry is still well below the pre-COVID highs near $120 - a level that accelerated the selloff when it was broken over the summer. It’ll take a move above there, or at least some backing and filling, before we can have any confidence in further gains for the group.
Where we don’t want to be involved is in the auto components industry. These guys dropped 20% over the last 4 weeks, the second-worst performance among the GICS industries. That selloff caused a sharp breakdown in the industry’s performance relative to the rest of the market.
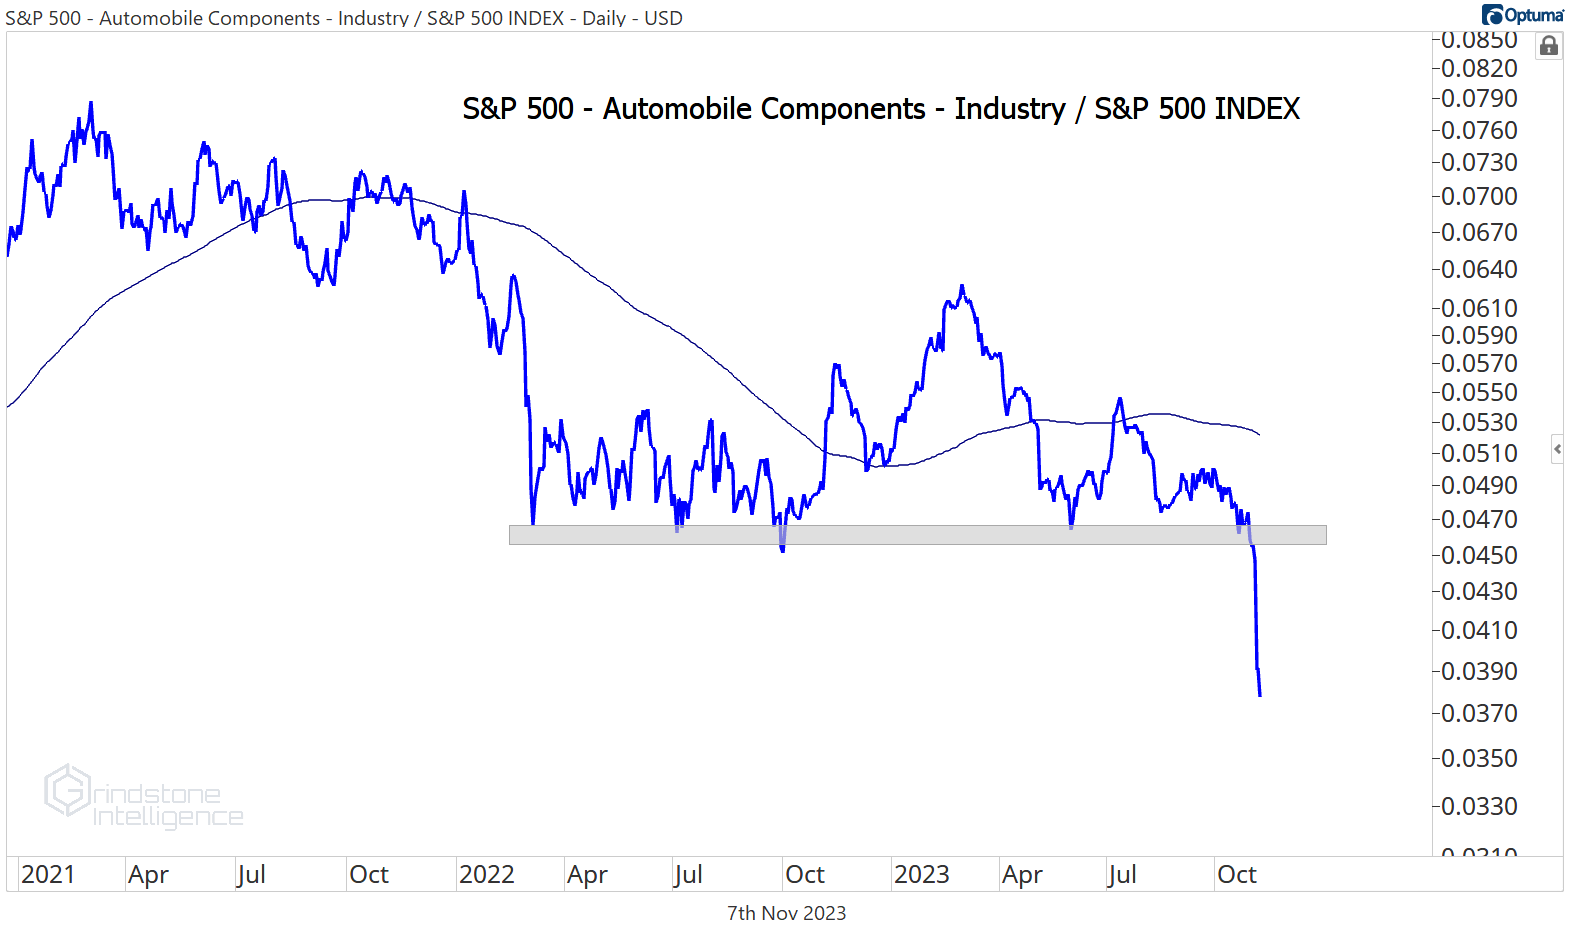
If catching falling knives is your thing, this is a great place to look for mean reversion opportunities. But personally, we kind of like our fingers. We’d prefer to spend our time focusing on things going up and to the right.
Until next time.