

March Market Outlook
It's a bull market, you know

At the outset of every month, we take a top-down look at the US equity markets and ask ourselves: Do we want to own more stocks or fewer? Should we be erring toward buying or selling?
That question sets the stage for everything else we're doing. If our big picture view says that stocks are trending higher, we're going to be focusing our attention on favorable setups in the sectors that are most apt to lead us higher. We won't waste time looking for short ideas - those are less likely to work when markets are trending higher. We still monitor the risks and conditions that would invalidate our thesis, but in clear uptrends, the market is innocent until proven guilty. One or two bearish signals can't keep us on the sidelines.
That’s exactly the type of environment we’re in today.
Sure, there are bearish signals if you look to find them. We’ve been pointing out this one all year: the Dow Jones Transportation Average still hasn’t confirmed the move to new highs.

Why does that matter? Because Charles Dow told us more than a 100 years ago that it does. One of Dow’s tenets says that new highs in one of the averages must be accompanied by a similar move in another to confirm a new trend. With the transports asleep at the wheel, we can’t definitively say this is a healthy, long-term uptrend for stocks.
But there’s no rule that says exactly when the transports have to confirm the move. The market doesn’t have to follow anyone’s timeline. So while we’d much rather see these guys breaking out to new highs than not, we need to see more bearish evidence than this alone before we can flip the script.
And unfortunately for the bears, we’re getting less bearish evidence these days, not more.
We’ve frequently pointed out that the percentage of stocks hitting new highs peaked in mid-December, even while the indexes themselves kept climbing. But declining new highs by itself isn’t bearish. It just means that fewer stocks are leading the market higher - something that was the case for much of the rally last year, too.
What would have been concerning is if we saw an increasing number of new lows to go along with the lack of new highs. That never happened. The new 6-month lows list is a ghost town.

And yesterday, the percentage of stocks in the S&P 500 setting new 52-week highs surpassed the December peak. That’s a tough loss for the bears.

What about lack of participation from the small caps? That’s been another big talking point: ‘It’s only mega cap growth stocks driving this market.’ Well that’s not the case anymore. The Russell 2000 is setting new 52-week highs.

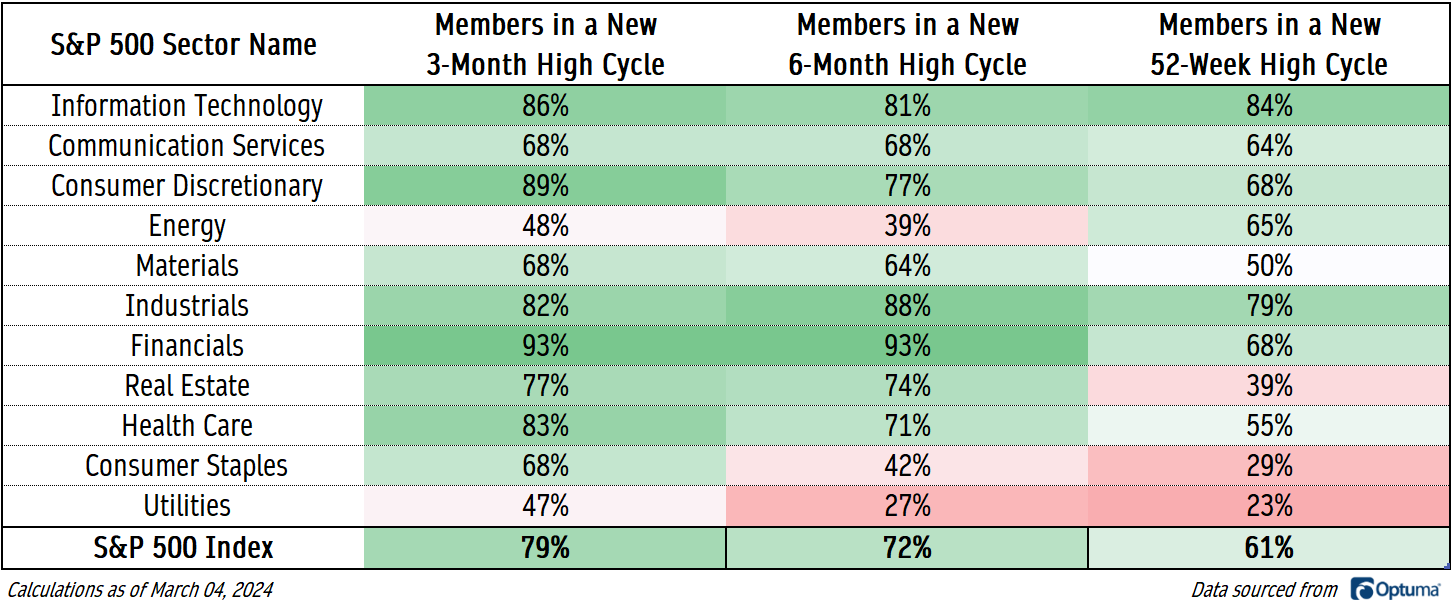
The simple truth is, market breadth is good and getting better. At least 70% of S&P 500 stocks are above their moving averages, whether you’re looking at the short, intermediate, or long-term. Bellwether sector like the Financials and Industrials are even stronger. 94% of Financials sector stocks are above their 200-day, and 83% of Industrials stocks are.

To be fair, there are parts of the market that still aren’t doing that great. Just 37% of Consumer Staples stocks and 40% of Utilities are above their 200-day moving average. And if we look at the percentage of stocks in each sector that are in a cycle of new 52-week highs, we can add Real Estate to the list of groups that aren’t doing so hot. Together, two-thirds of the stocks in those 3 sectors have set a new 52-week low more recently than a new 52-week high. New lows aren’t something you see in an uptrend.
But should that really bother us too much? Apple by itself has a higher weighting in the S&P 500 index than the entire Real Estate and Utilities sectors combined. The Consumer Staples aren’t that much bigger. And all three tend to do better in risk-off periods, not the risk-on periods that drive markets higher.
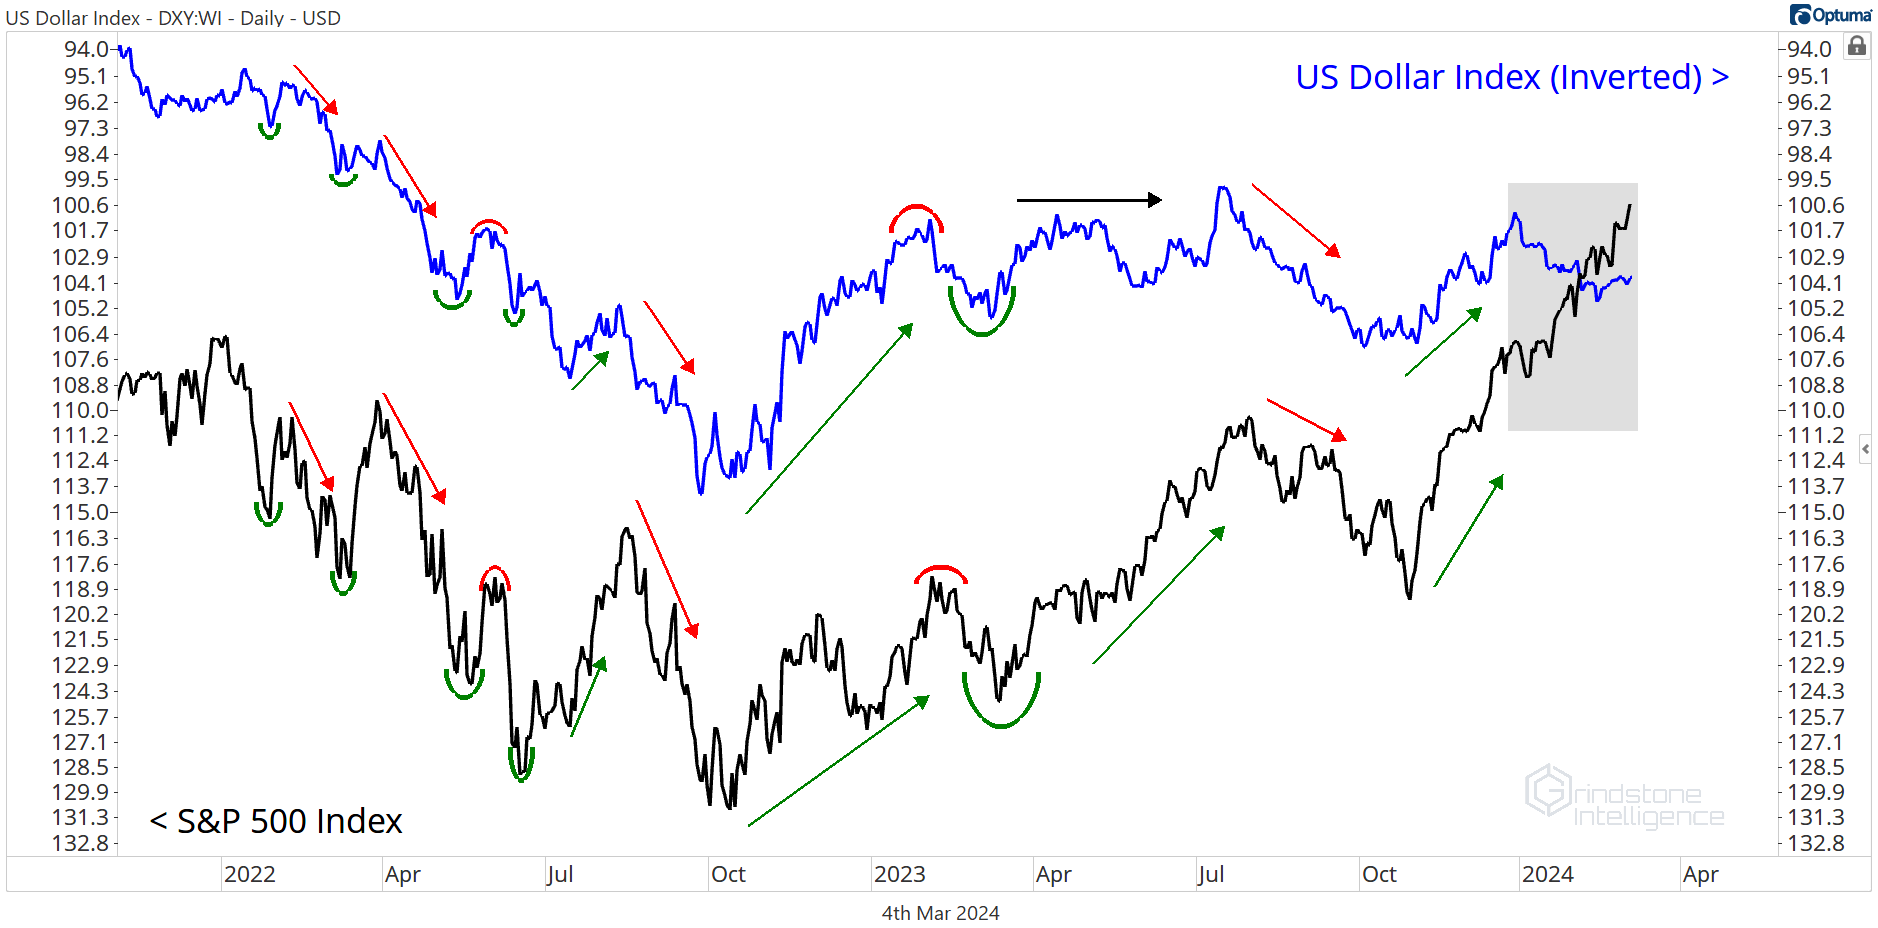
What about risks from outside the stock market? In the bear market of 2022, the only things that seemed to matter were interest rates and the US Dollar. Every time rates moved higher and the Dollar surged, stock prices fell to a new low.
Last year really wasn’t that much different. The US Dollar was subdued and rangebound, and that was good for stocks. Still, big swings in the DXY were mirrored by moves in the S&P 500.
That correlation has broken down. The Dollar has been strengthening all year, but stocks haven’t cared:
In short, the weight of the evidence says stocks are still trending higher, and we continue to believe the S&P 500 goes to 5300. That’s the 261.8% retracement from the 2020 decline, and it’s also the 138.2% retracement from the 2022 bear market. Those clusters of Fibonacci retracement levels tend to act as magnets.

Of course, we don’t have to go there in a straight line. Already, the S&P 500 has risen in 16 of the last 18 weeks. That kind of winning streak hasn’t happened since 1971. That doesn’t mean we can’t keep going higher every week - the market can do whatever it wants, no matter what we think is reasonable - but it’s important to keep expectations in check.
Especially with the largest and most important sector in the market running into a logical area of resistance this week. The strongest trends don’t care about resistance or potential bearish momentum divergences like the one we’ve got shaping up here, but it would make a lot of sense to see Tech stocks stall out and digest some of the huge gains we’ve seen over the last 4 or 5 months.

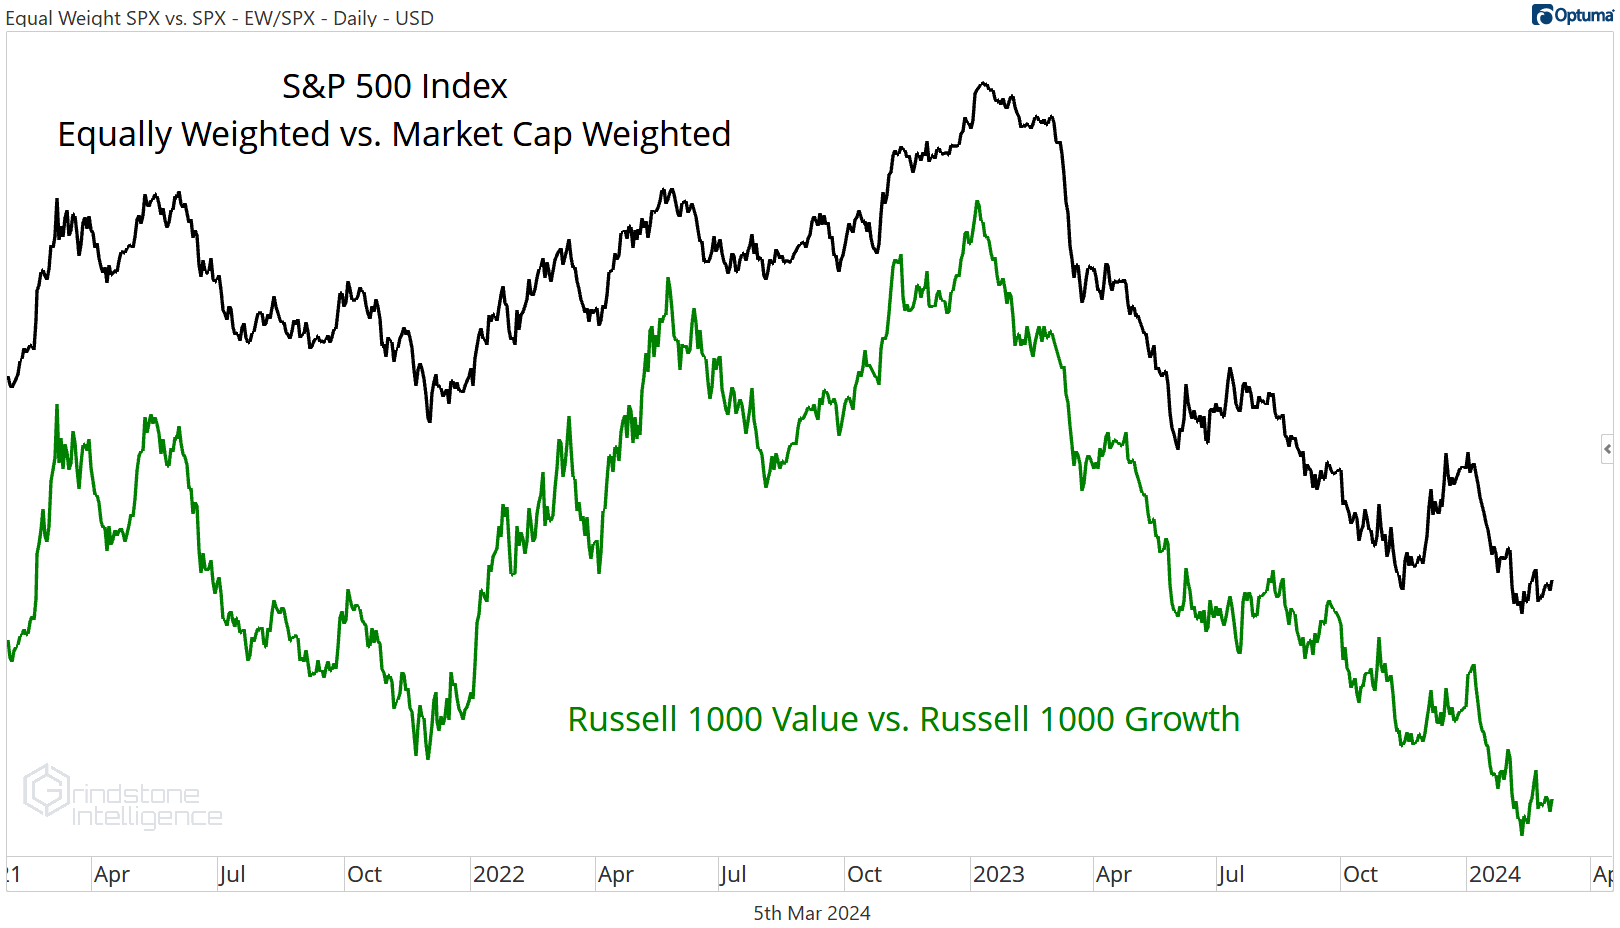
The big question in our minds is what happens if mega cap Tech stocks do stall out here. Will other areas of the market step in and take a leadership position? Look at the equally weighted S&P 500 compared to the market cap weighted index. This is exactly where the ratio bottomed back in 2020, kicking off a multi-year run of outperformance by the ‘average’ stock.

Does the same thing happen this time around? We aren’t ruling it out.
If it does, we’ll be looking for value stocks to lead. Take the ratio above and compare it the Russell 1000 Value/Growth ratio. They look exactly the same.
Whether it’s growth or value stocks leading us higher, though, this is a bull market until proven otherwise.
What’s the proof we’re looking for to invalidate our thesis? Failed breakouts would be a start.
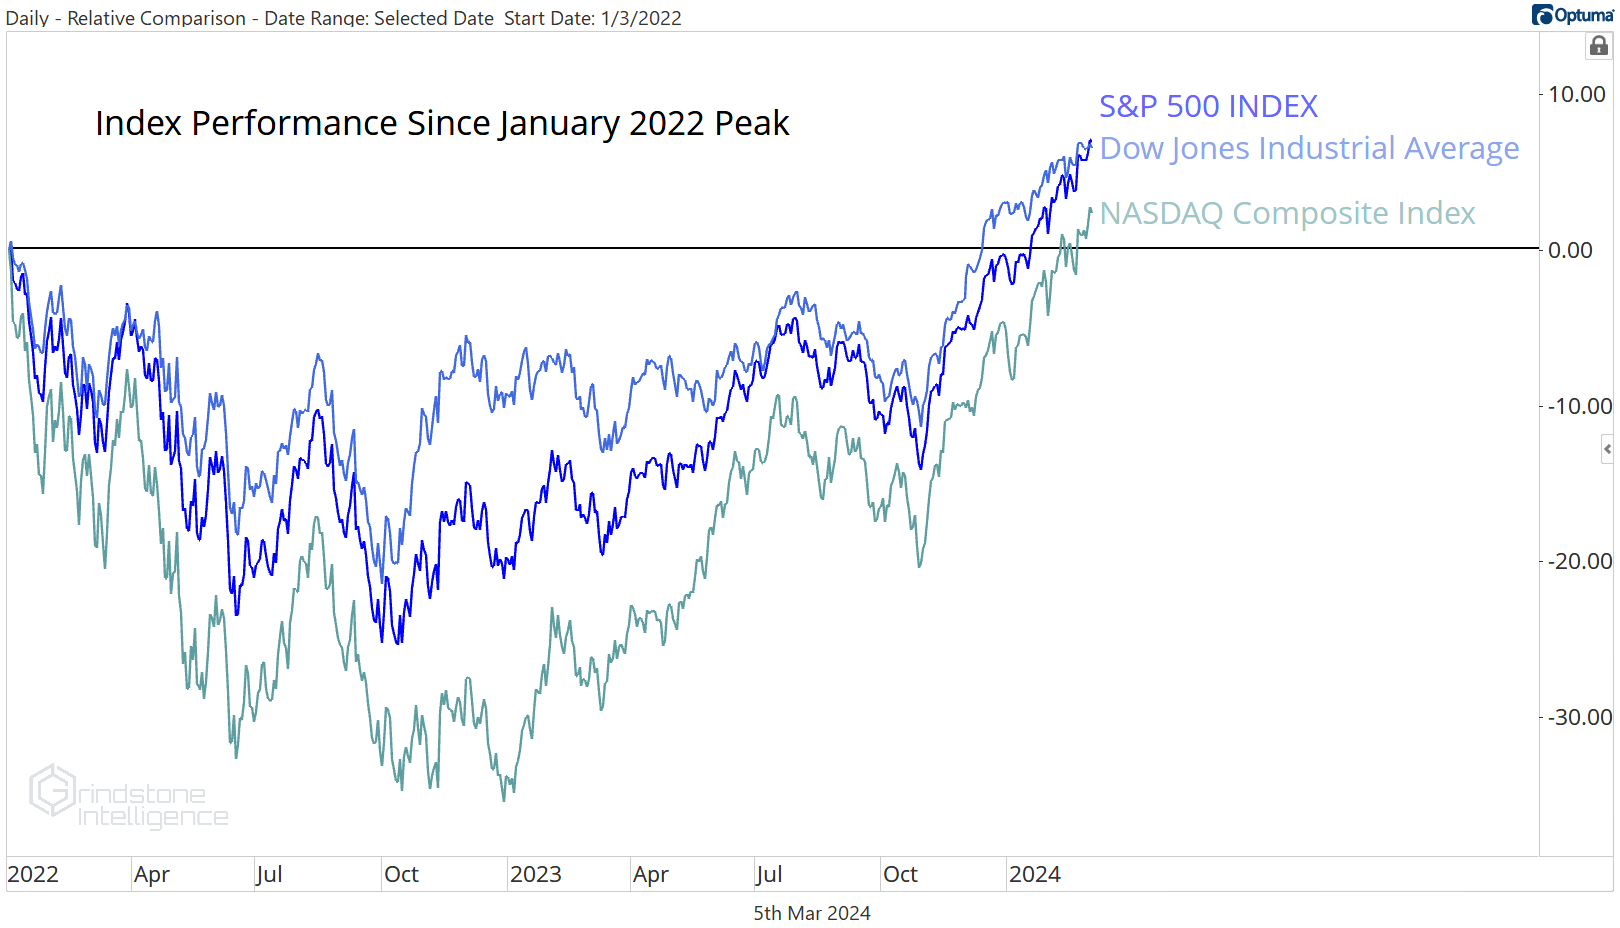
Remember that the Dow Transports still haven’t confirmed the move to new highs, even though each the S&P 500, the Dow Jones Industrial Average, and the NASDAQ Composite are all above their January 2022 highs. We believe this is a bull market, so we believe the Transports will follow suit in time. But if stock prices weaken and all these major indexes are falling back below those 2022 highs? Then we need to step back and reassess.
We’re also keeping an eye on the US Dollar. Even though the correlation between stocks and the Dollar index has broken down, it could come back and cause issues. Especially if the DXY is breaking out.
The Dollar Index is stuck in a range between 100 and 105, and as long as that’s the case, we think it can be safely ignored. On a move above 105, the story changes.

And finally, we’d need to see more evidence of risk aversion from investors. We just aren’t seeing that today.
Someone out there read that sentence and thought to themselves, “Yea, but what about gold? It’s breaking out to new all-time highs, too. People only buy gold when they’re afraid.”
They’re right about one thing. Gold is breaking out. Look at this beauty.

And they’re kind of right about the other thing. People do tend to buy gold when they’re afraid. But they don’t only buy gold when they’re afraid. Sometimes gold and stock prices rise together. From the S&P 500’s bear market lows to its 2007 highs, gold rose even more. So gold breaking out isn’t necessarily bearish.

And if investors were fearful, they wouldn’t have Bitcoin knocking on the door of new all-time highs. Bitcoin is not risk-off asset.

This is a bull market. The trend is up. We’ll be spending most of our time looking for things to buy until that changes.
Until next time.