

Materials Making a Comeback
Sector outlook and deep dive

It's still a risk-on environment, but leadership over the short-term has shifted quite a bit. No longer is this a market where returns are dominated by a handful of mega cap growth names. It’s the value-oriented areas of the market that are driving us higher.
Check out the percentage of sector members trading above a rising 50-day moving average across the S&P 500 Index, and the new regime makes itself clear.

Since the end of January, no sector has been better than the Materials. It’s jumped 11%, outpacing the 7.5% gain from the S&P 500 index, and narrowly edging out Energy to stand at the top of the leaderboard.

The recent rally has taken the Materials sector to a new all-time high. The high-flying Communication Services and Consumer Discretionary sectors, meanwhile, are still below their 2021 peaks.

And even though one stock makes up nearly a quarter of the sector’s entire market cap, the recent breakout isn’t a narrow one. 20 of the sector’s 28 constituents have set a new 3-month high within the last week. The strength has even flowed down to the small caps. PSCM is above the 161.8% retracement from the 2018-2020 decline, which had been resistance for the last year.

Two months of outperformance hasn’t been enough to reverse the sector’s long-term downtrend relative to the rest of the market, though. The Materials/SPX ratio is still below a falling 200-day moving average and hasn’t broken the downtrend line from the second half of last year.

If we want to know whether the recent strength is just a countertrend, mean reversion rally or the start of something new, stripping out the influences of market capitalization can give us a better read on the underlying strength or weakness. The ratio of the equally weighted Materials sector relative to the equally weighted S&P 500 is at a key rotational level - the 2021-2023 lows - and sitting on top of the 200-day moving average. A failure here would indicate that the Materials sector is still a place to avoid, while a clean break higher would be a big win for the Materials bulls.

Fortunately, we’re in the midst of one of the most bullish seasonal periods for the Materials sector. In Aprils since 1990, the Materials have outperformed the S&P 500 by an average of 1%. The bad news is, we’re on the tail end of that bullish period. Over each of the next 6 months following April, the Materials have tended to lag.

Even more important than seasonality, though, is what happens in the commodities landscape. Only the Energy sector is more highly correlated with changes in the price of CRB Commodity Index, and the CRB is threatening to resolve higher from the big, multi-year consolidation that followed the huge 2020-2022 rise.

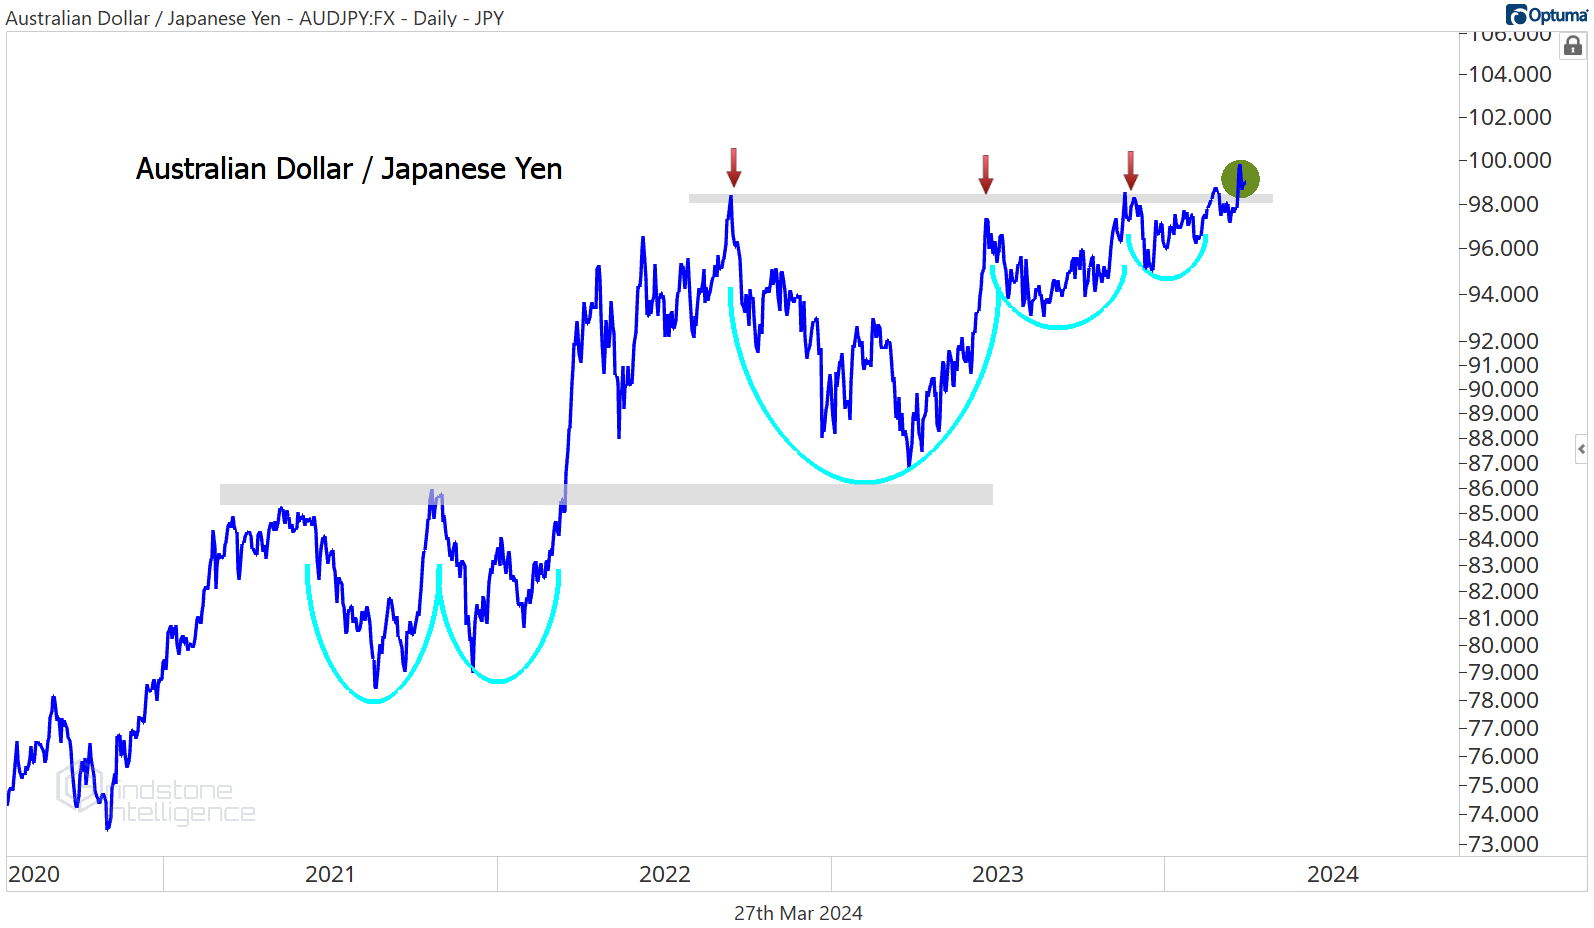
And the currency markets are pointing toward higher commodity prices, too. The Australian Dollar is considered a risk-on commodity currency and the Japanese Yen is a traditional safe haven. As such, the AUD/JPY often mirrors moves in commodity prices.
The Australian Dollar broke to new highs against the Yen after an 18-month consolidation.
If higher commodity prices are indeed going to be the backdrop for the remainder of 2024, then we need to keep a close eye on the Materials.
Digging Deeper

The sector’s rally over the last few weeks has been broad, but there’s no doubt about who the leaders have been over the last 12 months. The Construction Materials industry has risen 72%, 3x the gain of the next best group.
We’ve liked Martin Marietta Materials for a long time, given how much relative strength it’s shown. Last year, it broke out of a three-and-a-half year base when compared to the S&P 500 index, and it hasn’t slowed down any in 2024.

We still think MLM goes to $750, which is the 423.6% retracement from the 2020 decline.

Vulcan Materials hasn’t been quite as good as Martin Marietta, but that doesn’t mean it’s done poorly. VMC completed it's own long-term relative base against the rest of the market earlier this year.

We don’t want to be initiating any positions as VMC approaches the 261.8% retracement from the 2019-2020 decline, but on a move above $295, we’ll have a better level to manage risk against. From there, we’ll be targeting the next key Fibonacci retracement level at $435.

Leaders

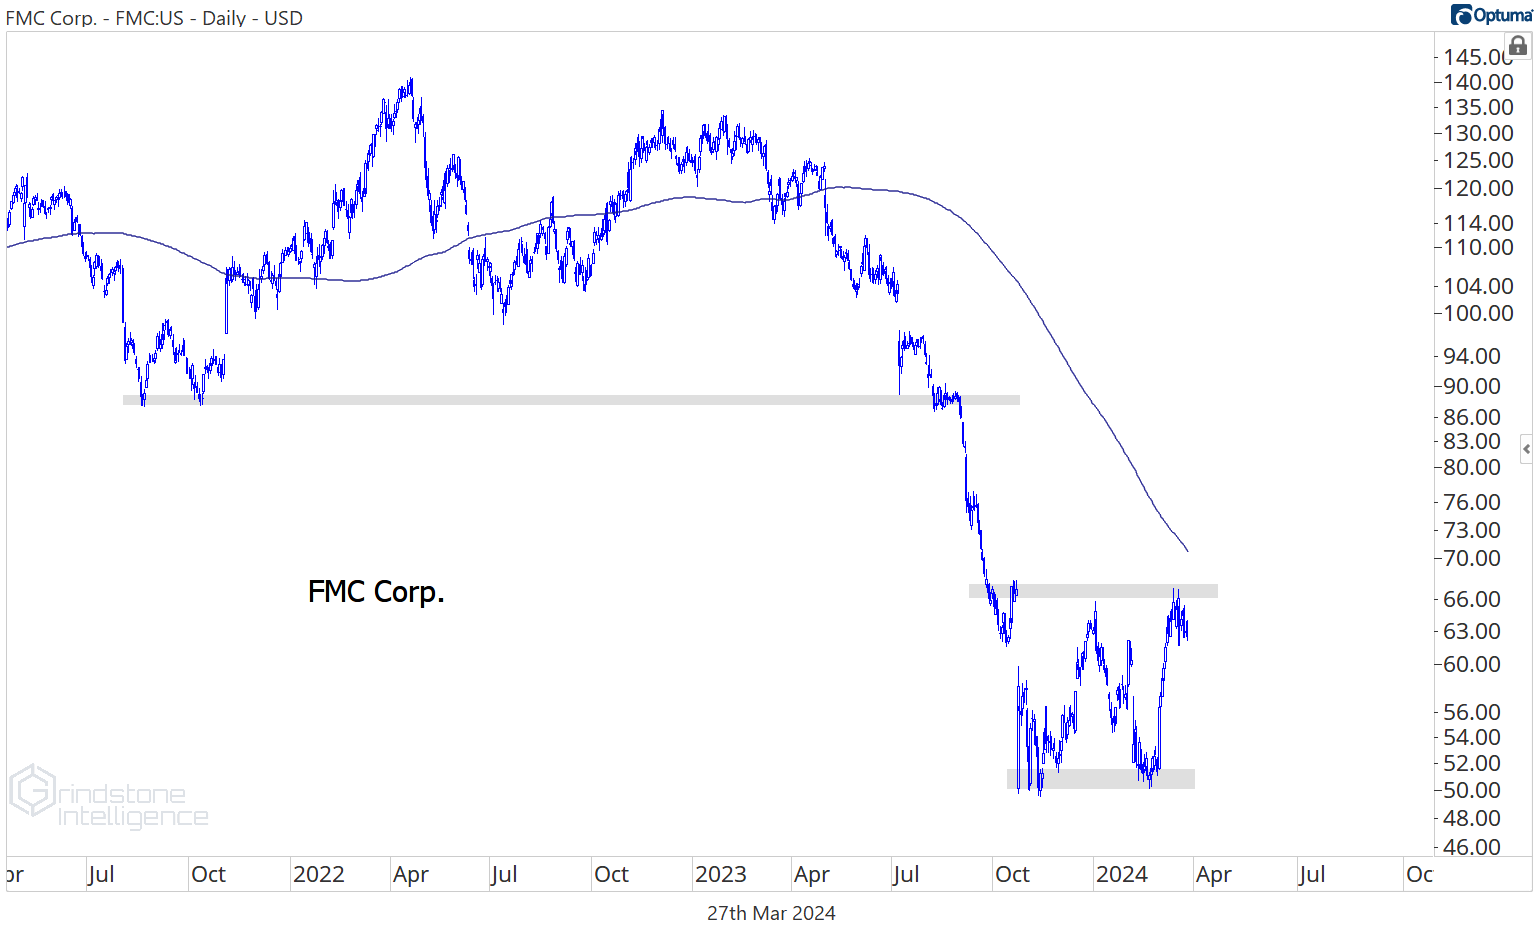
Catching falling knives can be lucrative. Over the last 4 weeks, FMC Corp has jumped 18%, the best performance of any stock in the sector.
But reaching for a falling knife and missing can cause one to lose fingers. This looks like a choppy consolidation within a longer-term downtrend to us, and we don’t want any part of it.
The same goes for Newmont. Gold is hitting new all-time highs, but this gold miner just can’t get anything going. NEM gained 14% over the last month. It’s still down almost 18% for the year.

Steel Dynamics is the opposite. This is a clear uptrend.

Near-term, we expect STLD to find some resistance near $150. Longer-term, though, we can target $215 on a move above $152.
Losers

We don’t want to be fooled by countertrend rallies on the Leaders list, nor do we want to ignore potential winners on the Losers list. We like buying pullbacks within uptrends - especially in stocks that have shown relative strength. Nucor is trying to break out of a 2 year base against the rest of the market.
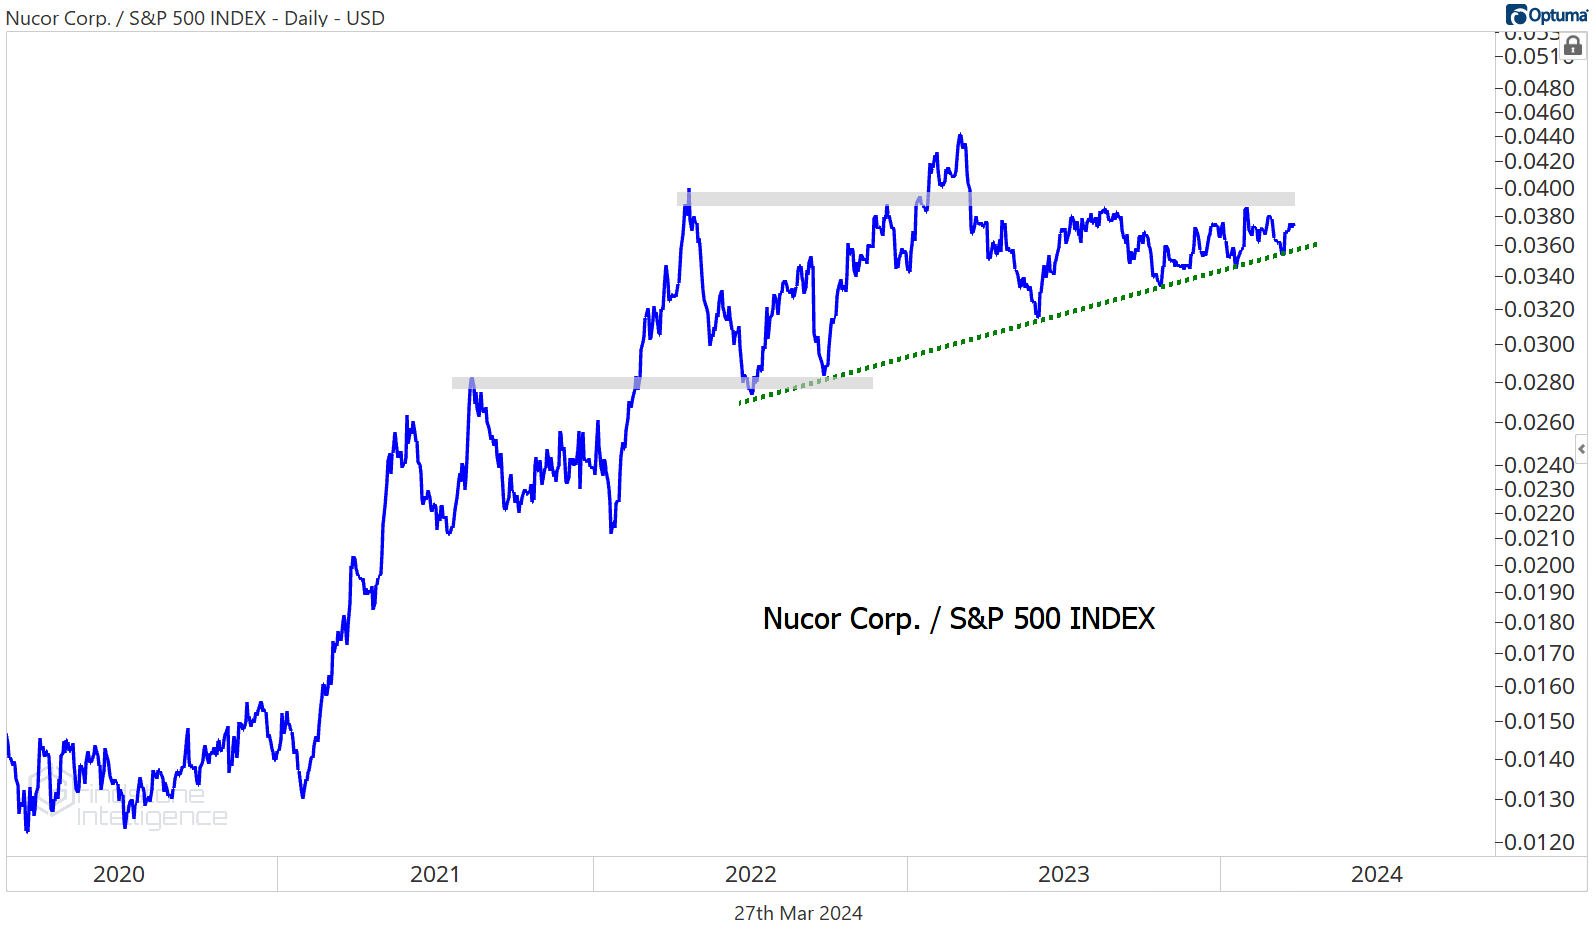
We already got the breakout to new highs on an absolute basis. We like NUE long above the 2022 highs with a target of $220, which is the 161.8% retracement from the 2022 decline.

More stocks to watch
Linde is the sector’s largest constituent, and it’s been one of the best performers, too. The risk-reward here is very clean - better than it’s been in over a year - and we want to take advantage of that. If LIN is above $470, we want to be buying it with a target of $670.

Here are two more great setups, both in stocks threatening to break out to new all-time highs. For Celanese, we’re looking for a move above $175. Once that happens, we can own it with a target up at $230.

For Sherwin Williams, our risk level is $350, which is both the 2021 high and the 261.8% retracement from the 2020 decline. Our target from there is $500.

Ball Corp isn’t close to it's all-time highs, but it did just set a new 52-week high. That was the finishing touch on a bearish-to-bullish reversal.

Here’s BALL relative to the rest of the Materials sector. Few stocks were worse than this one from 2021 to 2023, but now we’re seeing signs that relative strength is making a comeback.

We like BALL above $67 with an initial target of $78.
The relative strength reversal in Ecolab is even cleaner - and this breakout is relative to the rest of the S&P 500, not just the Materials sector.

With such a strong tailwind from relative strength, we think a breakout to new highs in ECL is imminent. We want to be buying it above $230 with a target of $290, which is the 161.8% retracement from the entire 2020-2023 range.

That’s all for today. Until next time.