May Market Outlook
Reversion or reversal?
At the outset of every month, we take a top-down look at the US equity markets and ask ourselves: Do we want to own more stocks or fewer? Should we be erring toward buying or selling?
That question sets the stage for everything else we're doing. If our big picture view says that stocks are trending higher, we're going to be focusing our attention on favorable setups in the sectors that are most apt to lead us higher. We won't waste time looking for short ideas - those are less likely to work when markets are trending higher. We still monitor the risks and conditions that would invalidate our thesis, but in clear uptrends, the market is innocent until proven guilty. One or two bearish signals can't keep us on the sidelines.
For the last month, the bearish signals have been adding up, and we’ve been forced to take them more seriously. The trouble started with the US Dollar Index.
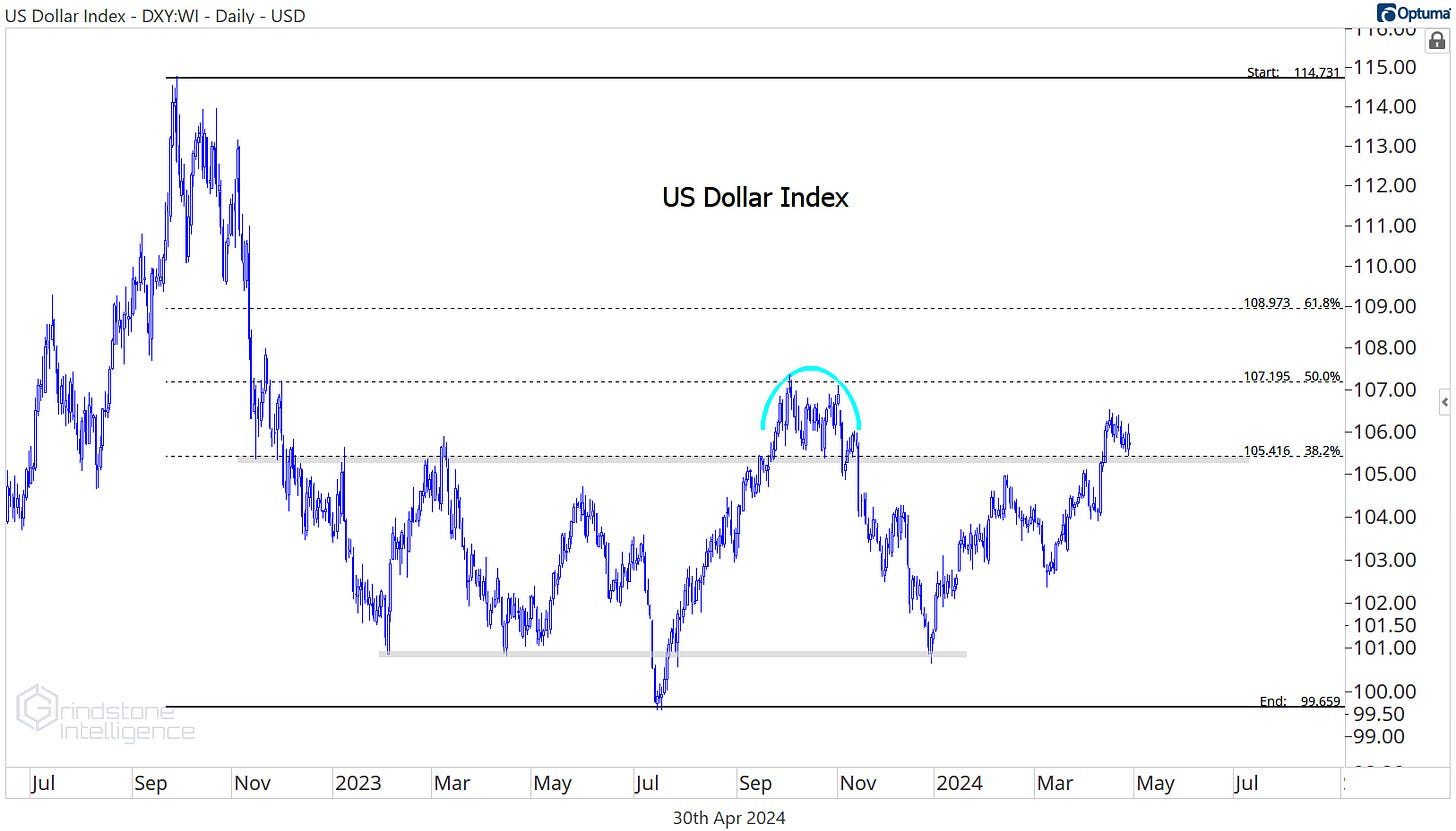
All throughout the bear market of 2022, it seemed the US Dollar was driving the boat. Every time the Dollar rallied, stocks were under pressure. And when the Dollar relented, equities moved higher. For most of 2023 - and even the first few months of this year - the US Dollar Index was stuck between 100 and 105. So long as that was the case, we believed any changes in the USD could be chalked up to chop within a trading range. In the middle of April, though, the Dollar Index broke out above that range.
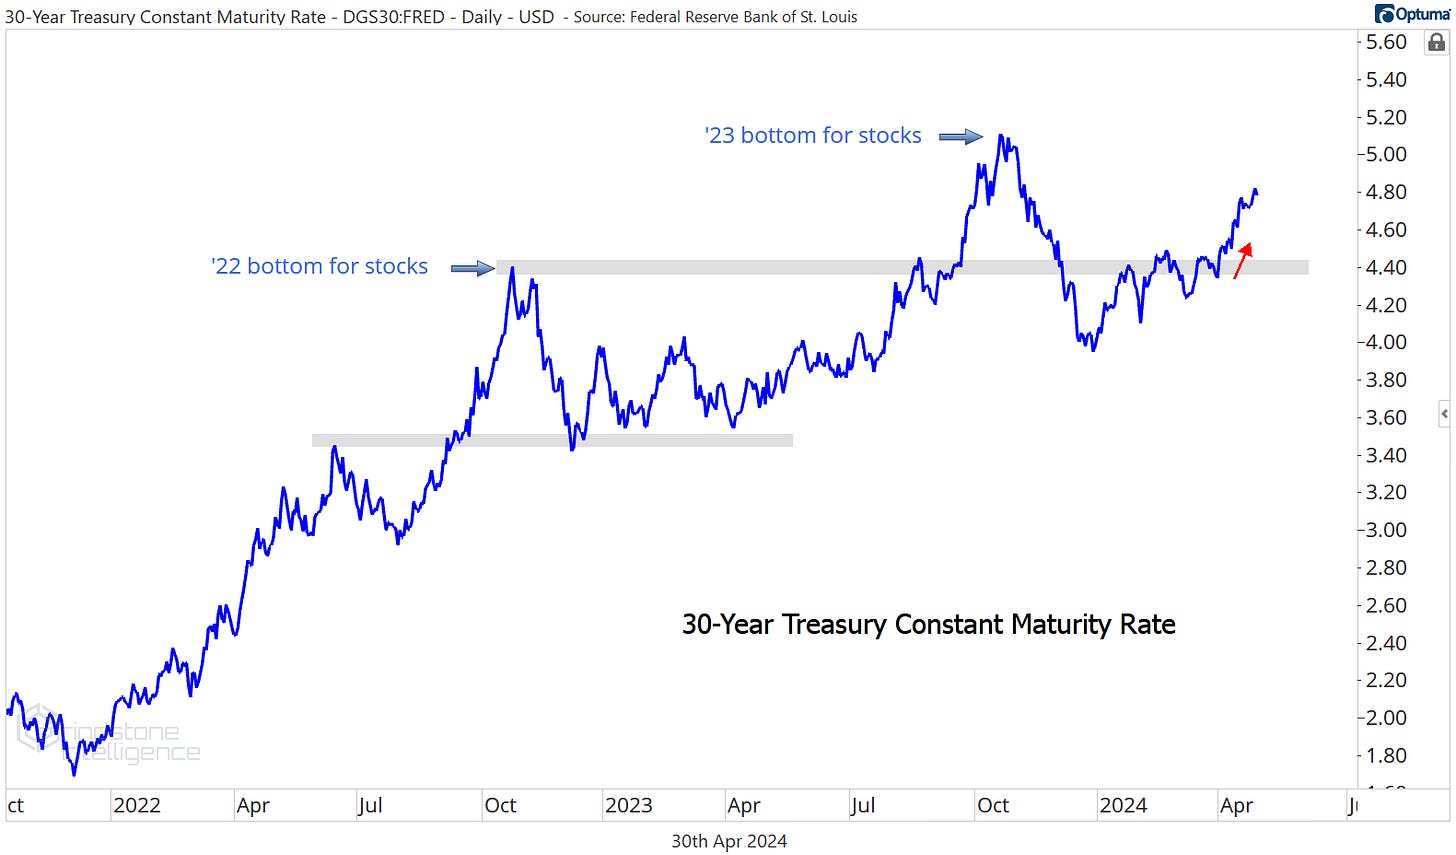
Interest rates have been a problem too. The stock market set its ‘22 and ‘23 lows at the same time that 30-year Treasury rates were peaking. Lower rates have been good news for stocks, but higher rates are a problem. Around the same time the Dollar Index was breaking out above 105, rates were blowing past their 2022 highs.
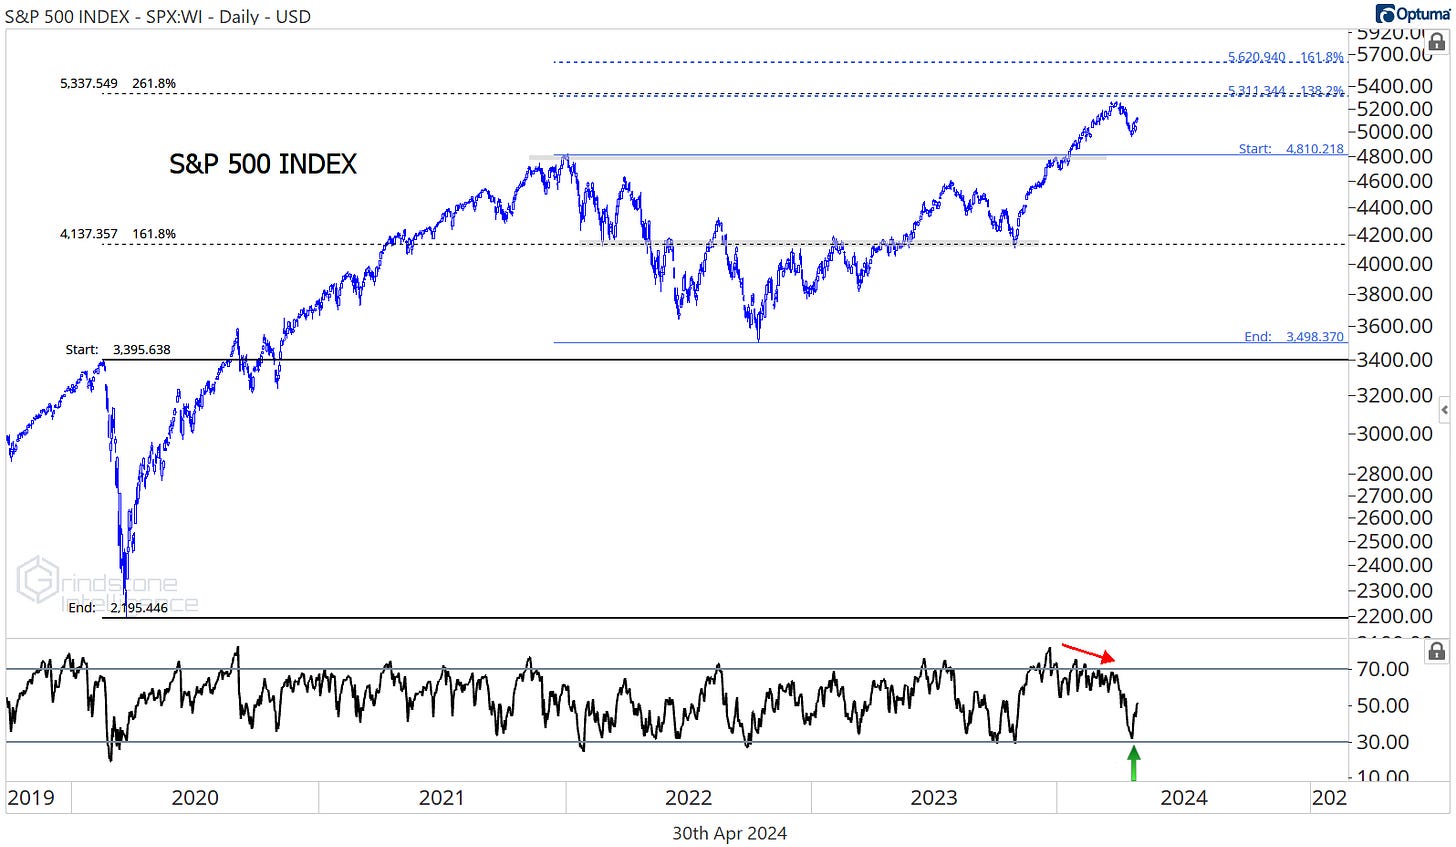
The dual headwinds from a strengthening US Dollar and rising interest rates pushed stocks to their worst selloff of the year in April, with the S&P 500 falling nearly 6% from its intraday peak. That selloff came from a pretty logical level, too. The SPX stalled out just short of 5300, which is the 261.8% Fibonacci retracement from the 2020 decline and the 138.2% retracement from the 2022 bear market. The drop also confirmed a bearish momentum divergence that had been shaping up throughout 2024.
Fortunately, S&P 500 weakness has yet to do significant damage to the longer-term trend. Momentum failed to hit oversold territory on the selloff (a sign that bears haven’t taken outright control) and prices are still above the year-end 2021 highs.
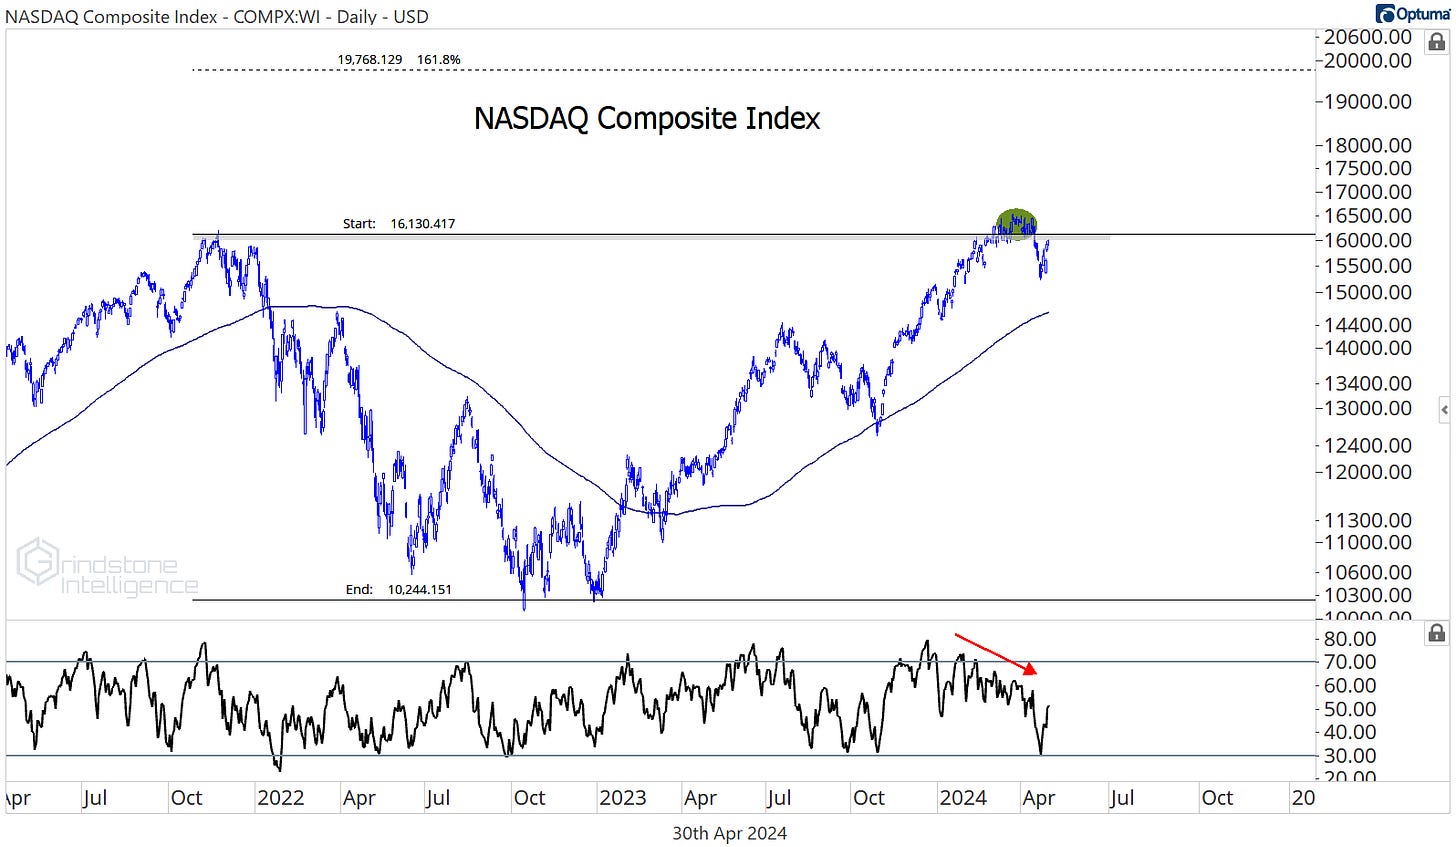
We can’t say the same about the NASDAQ Composite. This was a textbook failed breakout:
More often than not, momentum divergences and failed moves lead to mean reversions. Sometimes, those mean reversions turn into full fledged trend reversals.
So which is it this time? Is this just a ‘normal’ consolidation within an ongoing bull market for stocks, or is this the start of a big bad bear? First, let’s recall what we said at the outset: the market is innocent until proven guilty. This is a bull market until we have clear and convincing evidence that it’s not.
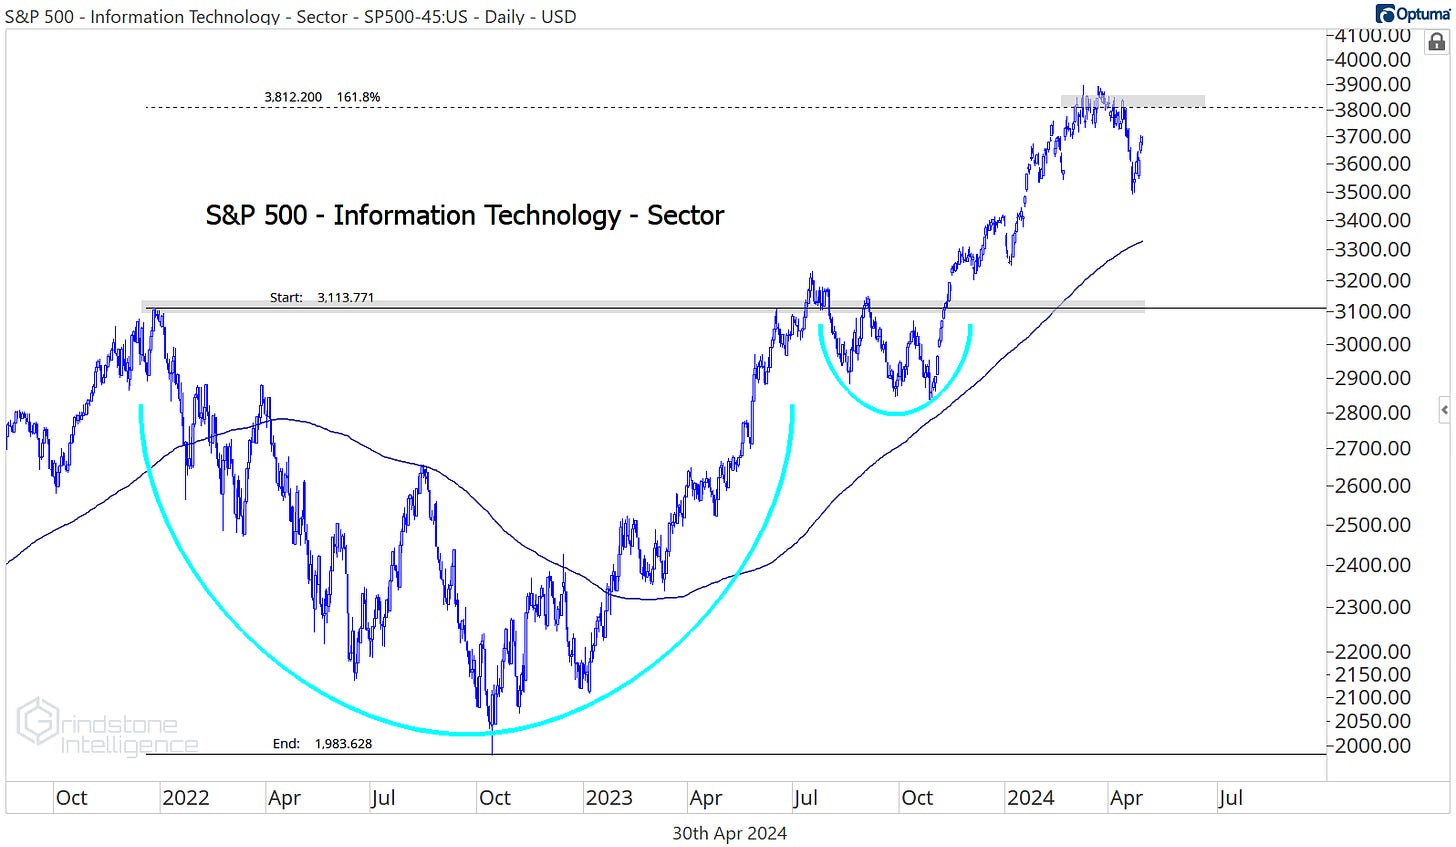
True, we’ve lost some leaders. The biggest and most important sector in the index, Information Technology, stopped going up two months ago when it ran into the 161.8% retracement from the 2022 decline.
But failing to surpass a logical area of resistance isn’t the same as breaking below support. Tech is still trading above a rising 200-day moving average, and it’s still much closer to hitting new 52-week highs than it is to touching new 52-week lows.
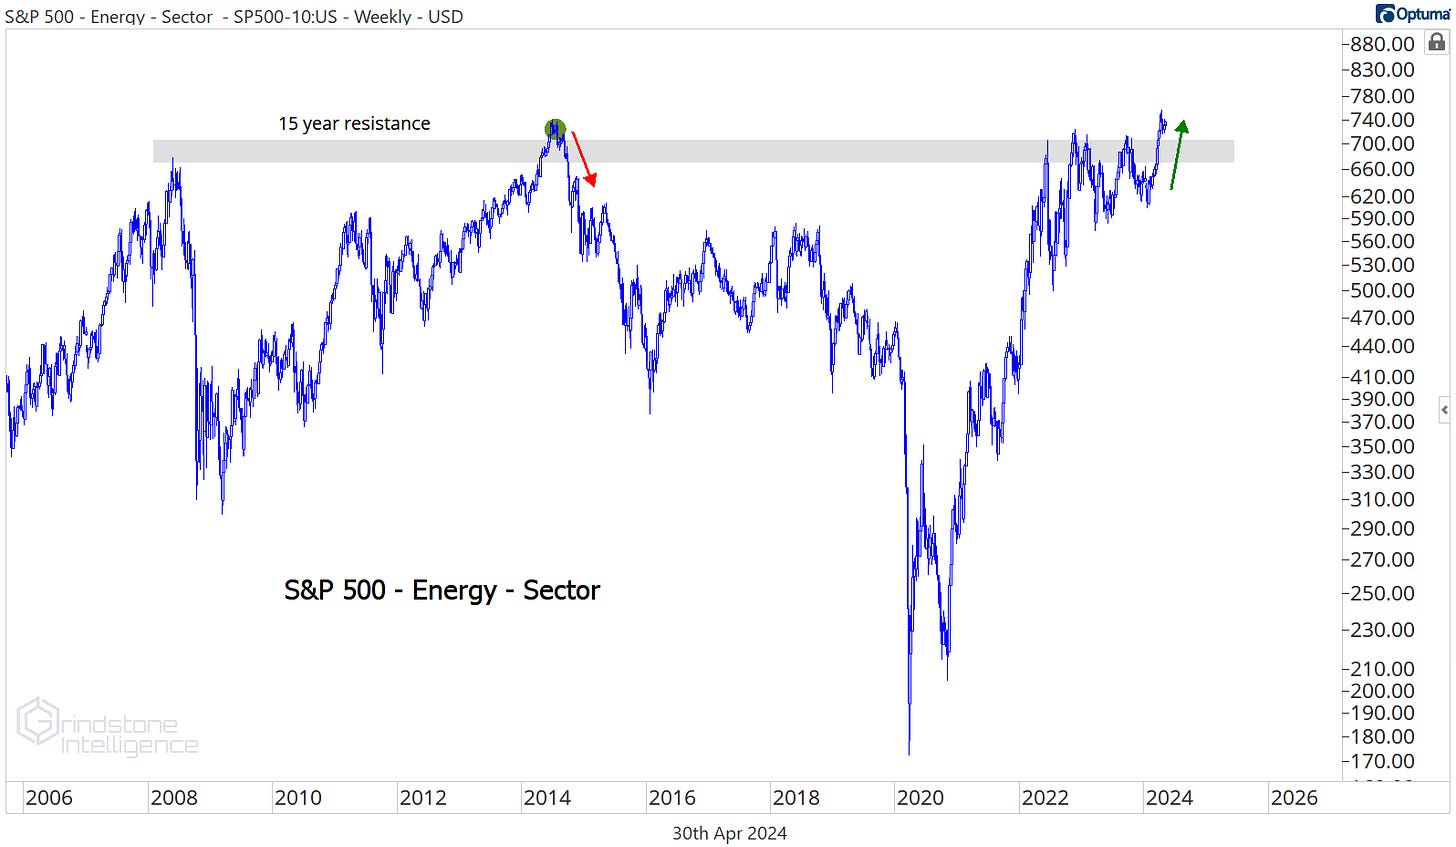
Meanwhile, other areas of the market are still holding up quite well. The Energy sector just broke out of a 15-year base:
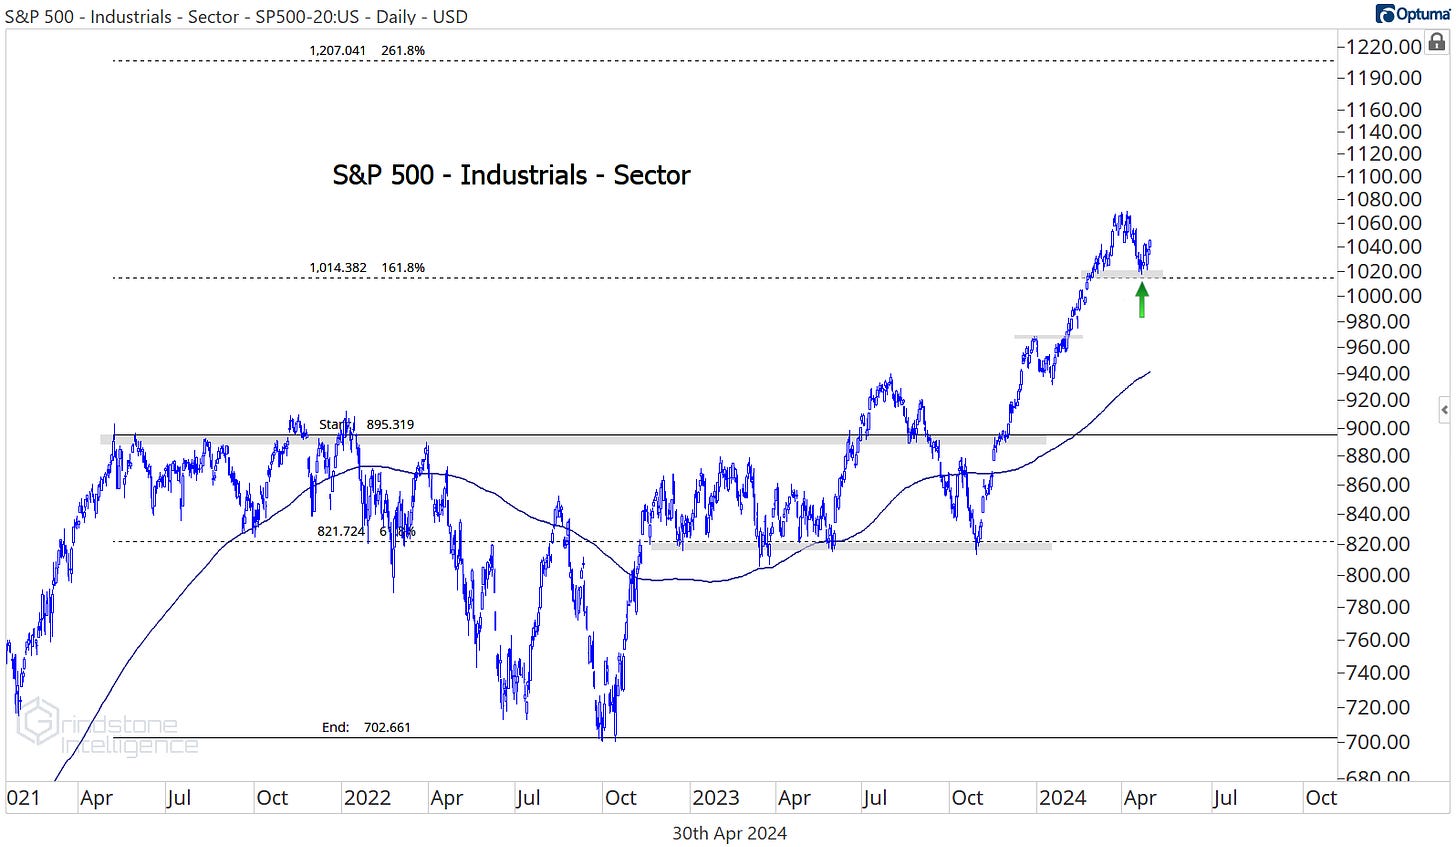
The Industrials have come off their highs just like the Tech sector has, but there’s one key difference between the two. While Tech is stuck below the 161.8% retracement from the 2022 bear market, the Industrials are consolidating above theirs.
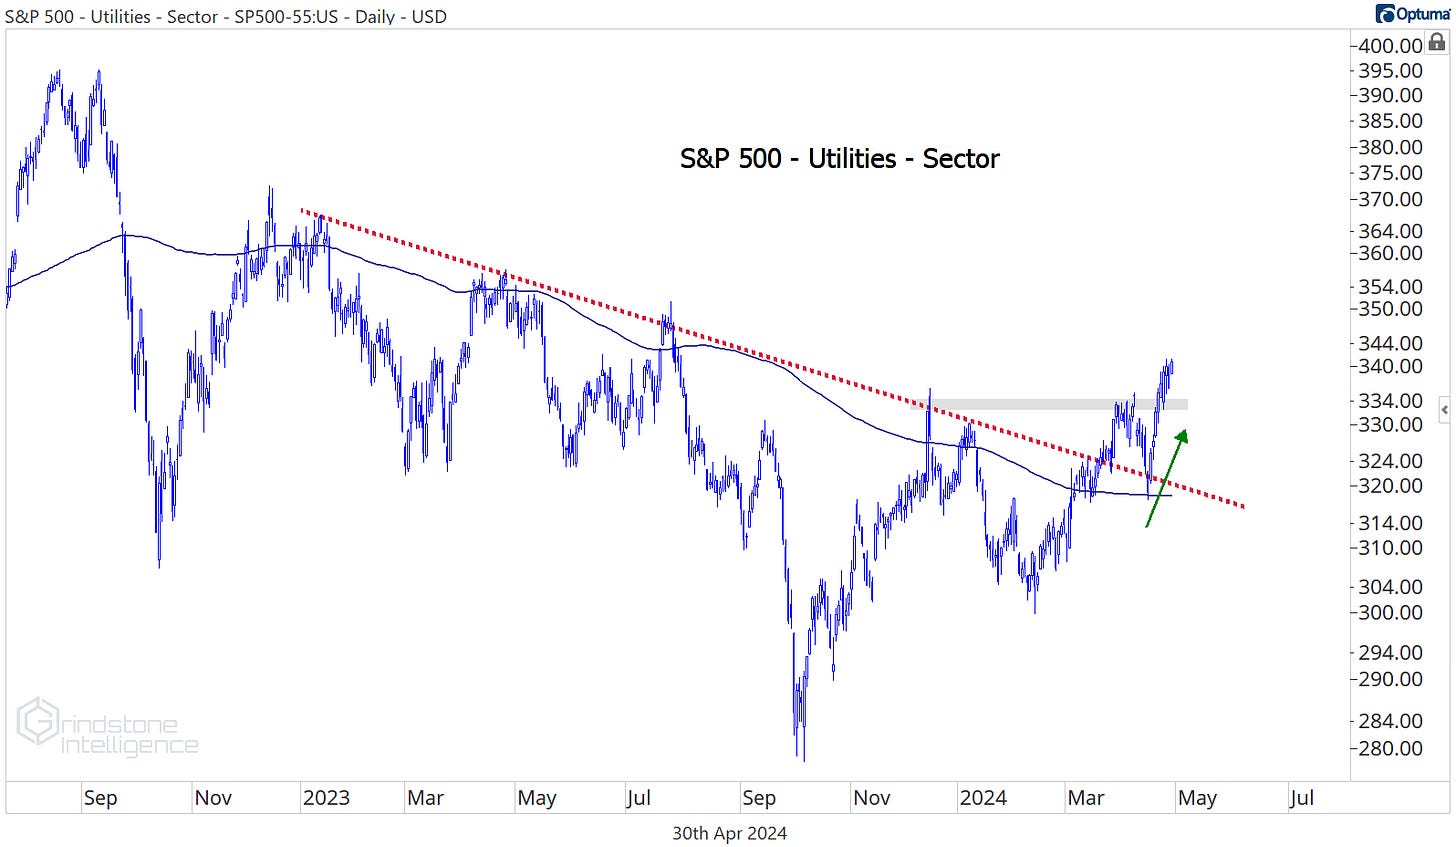
And while the Utilities are a tiny and rather inconsequential sector, we can’t ignore that they just reversed a multi-year downtrend and set an 8-month high yesterday. New highs aren’t something you see in bear markets.
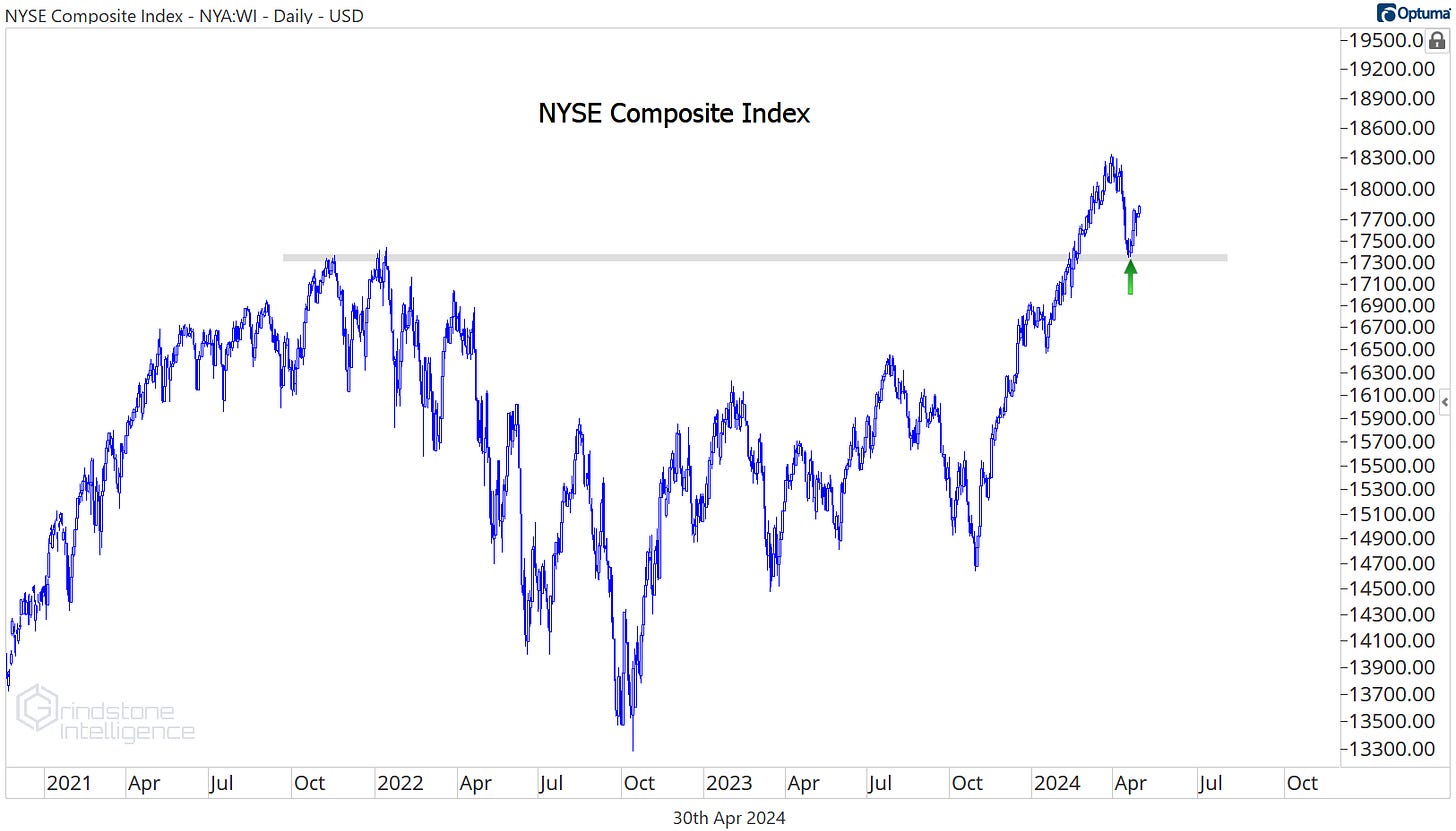
Here’s the chart that we think puts it all in perspective. The NYSE Composite includes all the common stocks listed on the New York Stock Exchange, so it’s a pretty good representation of what the total market is doing. The NYSE Composite peaked on March 28, dropped 5.5% over the next 3 weeks, and then found support right at the prior cycle highs. So far, this has been a perfectly logical pullback within an ongoing bull market.
Does that mean we can ignore the bearish evidence? Of course not. Bear markets have to start somewhere, and they always look like nothing more than logical pullbacks at their beginning.
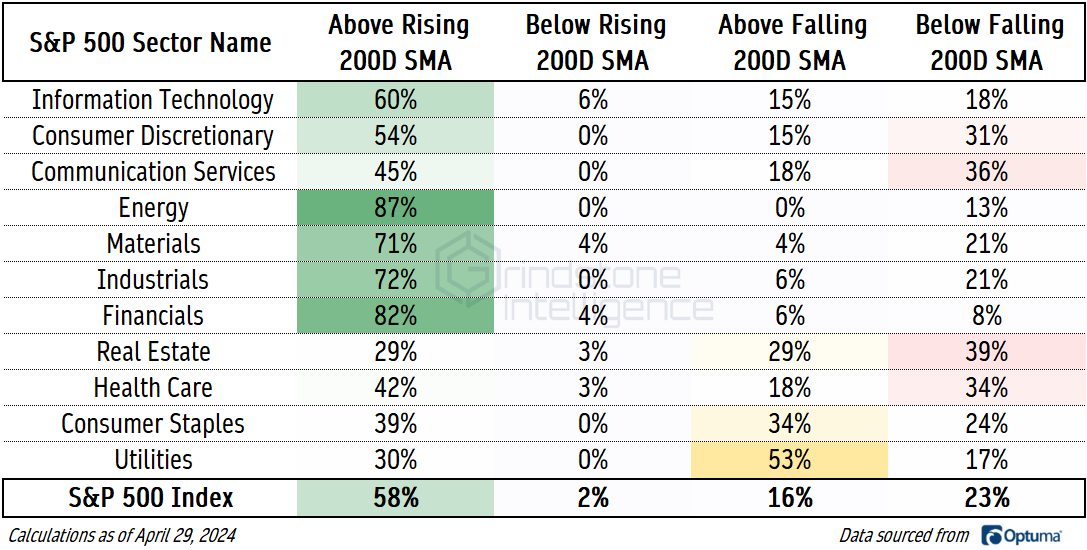
So what do we need to see before turning more bearish? First, a weakening in market breadth. Stocks are off their highs, but we haven’t seen a bunch of trend reversals below the surface. Without that, how can we expect to see a trend reversal at the overall market level? Today, 58% of S&P 500 stocks are trading above a rising 200-day moving average. Those stocks can’t be in a downtrend. On the flip side, less than a quarter of stocks are below a falling 200-day.
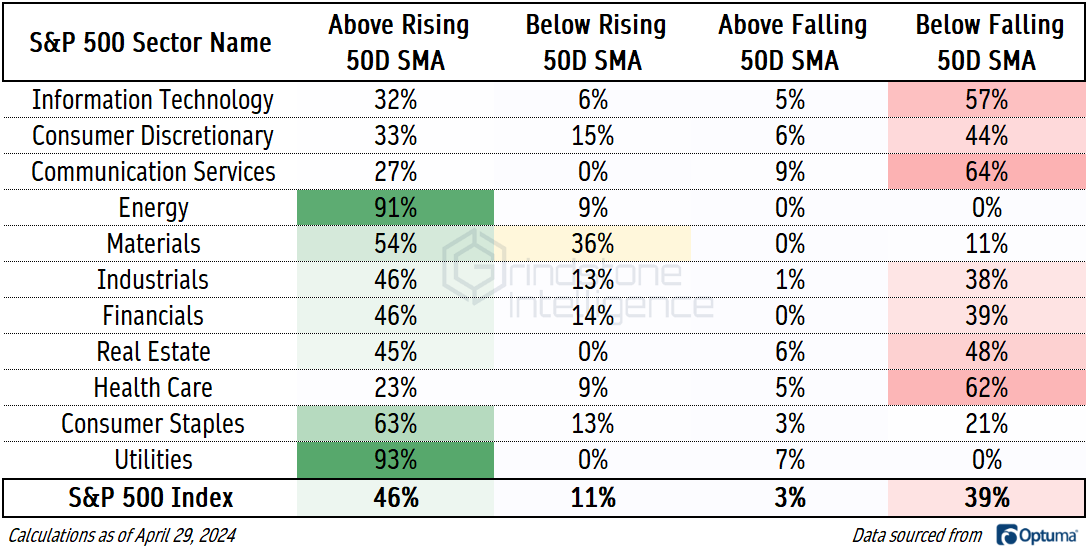
Even on a short-term basis, the number of technical uptrends outnumbers the number of technical downtrends (46% to 39%).
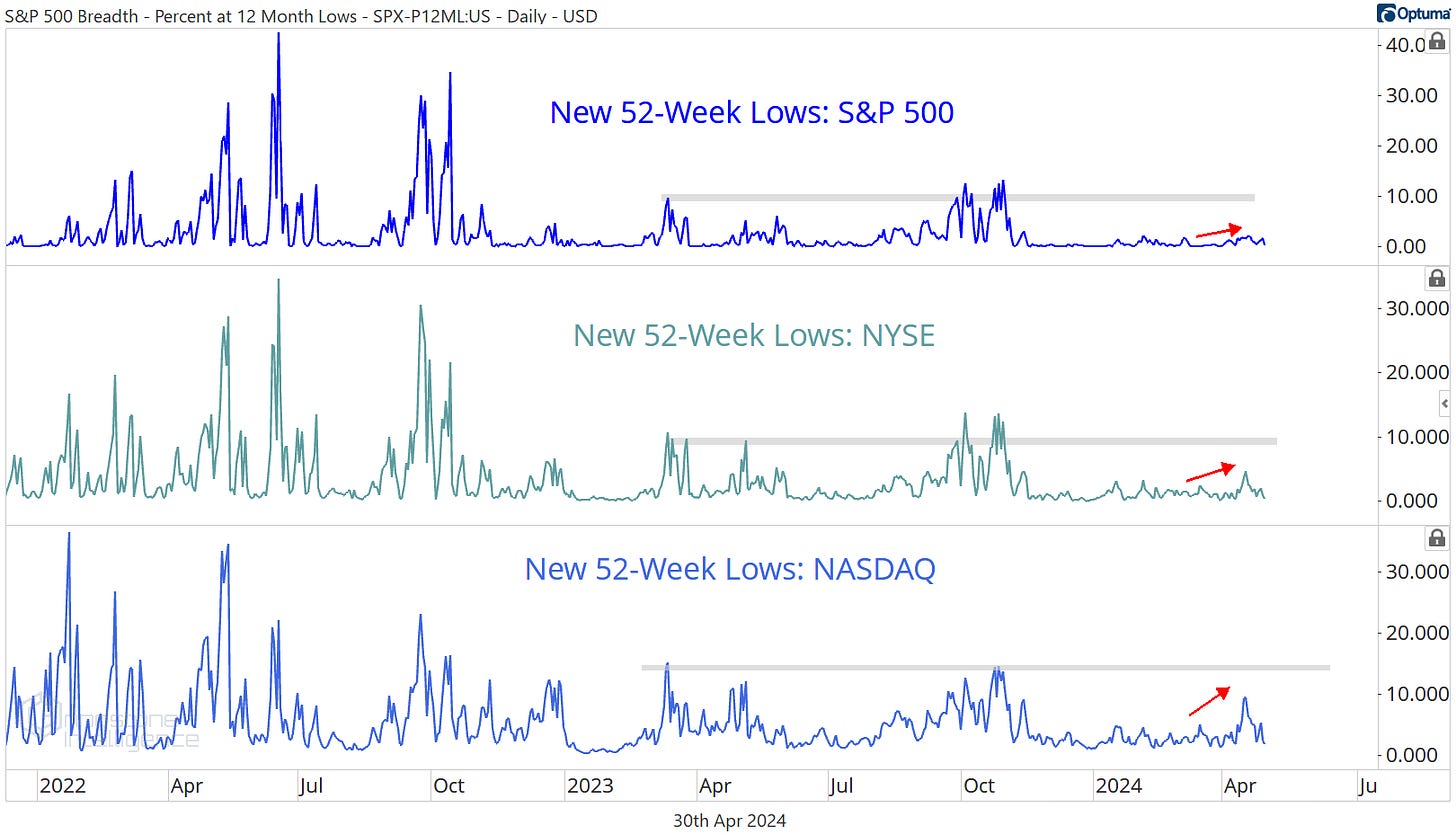
We’ll also be watching for an expansion in the number of new lows. The list of new 52-week lows was setting year-to-date highs earlier this month, but the number of new lows was still well short of levels we saw throughout 2023:
To be fair, we shouldn’t expect to see a bunch of new 52-week lows when the market is just a month removed from setting an all-time high. Even on a short-term basis, though, the number of new highs outweighs the number of new lows.
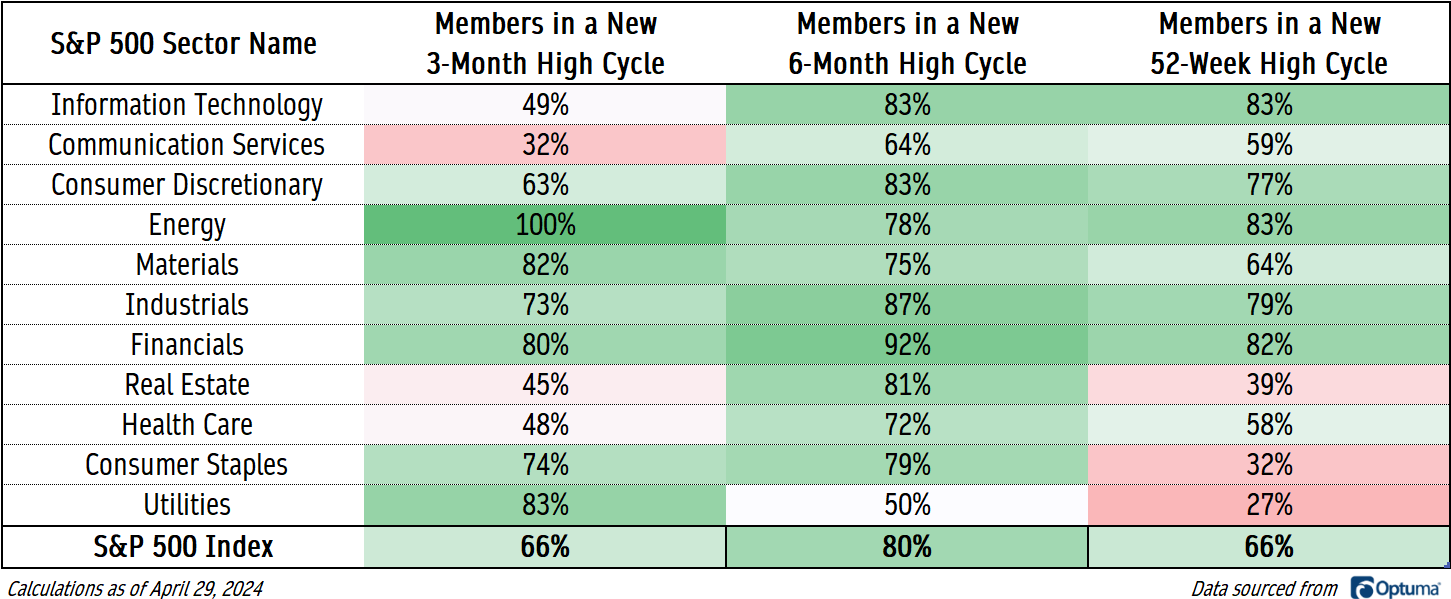
We can look at whether a stock has more recently broken out or broken down and determine whether that stock is in a cycle of setting new highs or new lows. Today, two-thirds of S&P 500 members are in a new 3-month high cycle, and 80% are in a new 6-month high cycle. When this table starts showing more red than green, we’ll know for sure that the trend has shifted.
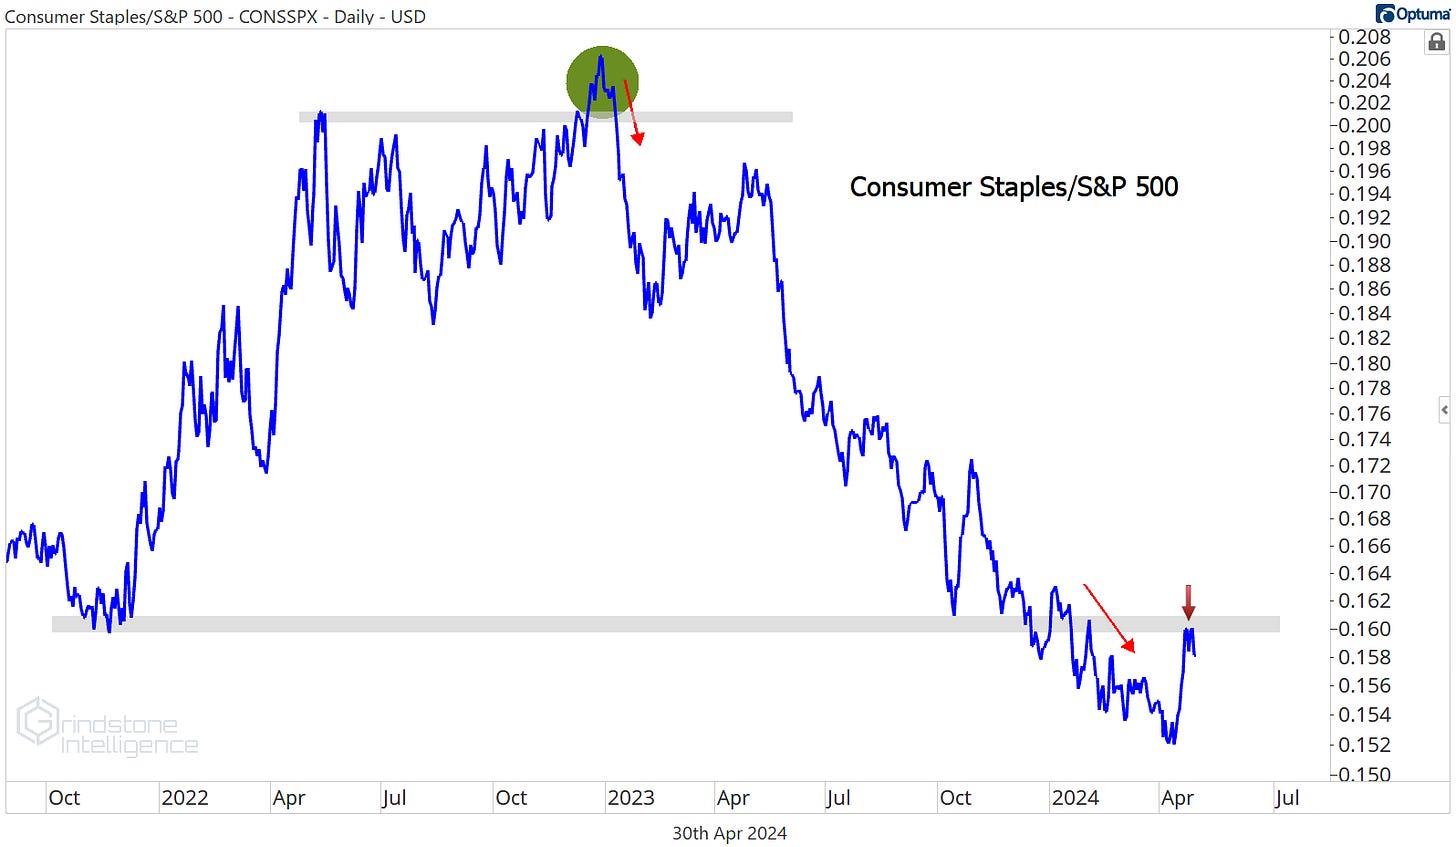
And finally, we’ll need to see a shift in risk appetite before believing that the big bad bear has come back to town. Consider the ratio of the Consumer Staples relative to the S&P 500. The Consumer Staples tend to outperform during risk-off periods, and that’s exactly what we saw throughout the bear market of 2022. The Staples outperformed again in the month of April, but not by enough to damage the downtrend. The ratio just got rejected at its 2021 lows.
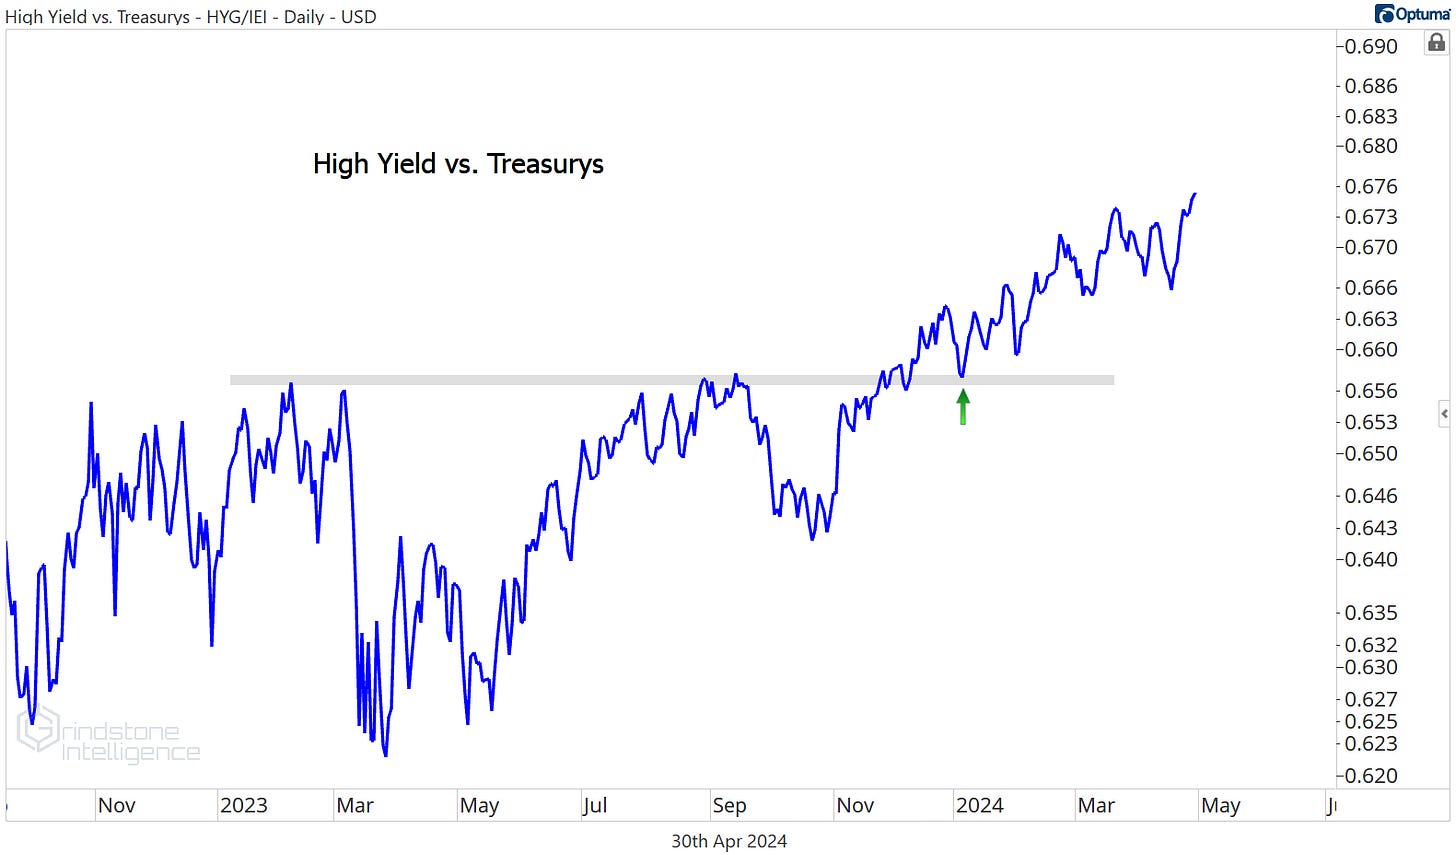
Risk appetite is running rampant in the fixed income market, too. Below we’re comparing high yield bonds to Treasury bonds. When this ratio is moving up and to the right like it has been for the past year, it’s a sign that investors are favoring riskier high yield bonds to risk-free Treasury issues. And yesterday the ratio hit another new high.
That’s classic risk-on behavior. This bull market may be on hold, but it’s still a bull market.
That’s all for today. Until next time.


