Mid-Month Market Update: September 2022
Technical Trends
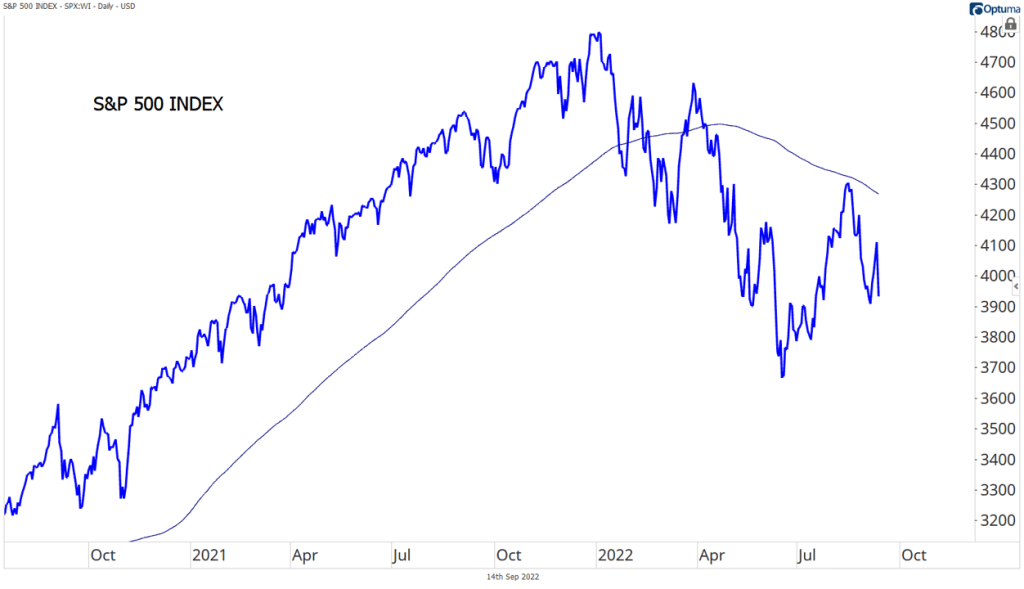
Stocks remain under pressure in 2022. The S&P 500 fell 7.7% over the last month and is down 11% over the last year. Growth has underperformed Value over that time. Current prices for the benchmark index are 7% below a falling 200-day moving average, indicating a technical downtrend.
Bonds have not acted like a safe-haven for investors during the equity selloff, as the benchmark 10-year yield has doubled from 1.5% to more than 3.4% this year. That’s driven bond prices 14% lower over the course of the last 12 months – among the worst performances on record for a period of that length.
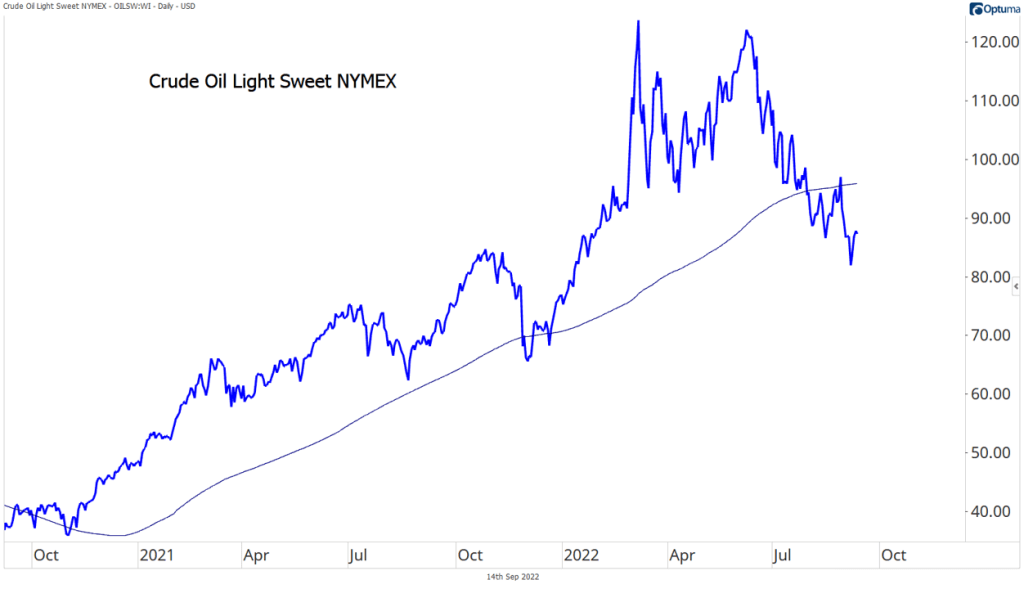
Commodities rose throughout the first months of the year, offering a place for investors to hide, but price gains have waned in recent months. Gold is lower on 1, 3, and 12-month timeframes. Crude oil has lost 23% of its value over the last quarter but is still up more than 25% over the last year.
Focusing on the Fed
The Federal Reserve is all set to raise interest rates again at next week’s FOMC meeting. The only question is, by how much? Futures markets are pricing in a third consecutive hike of 0.75%, and Powell and Co. have said little to alter those expectations during recent interviews. In fact, they’ve been more focused on crushing market expectations of a rate cut in 2023. During Jerome Powell’s historically brief Jackson Hole speech, he warned against the risks of declaring premature victory over rising prices, pointing to several failed attempts to control inflation during the 1970s. Instead, Powell proclaimed, rates will need to remain elevated for an extended period of time.
Just how elevated is still unknown. Fed officials widely agree that real rates need to rise above zero in order to be restrictive. With this week’s inflation report at 8.3% and rates likely at 3.25% after next week’s meeting, it seems more hikes lie ahead. The 2-year Treasury yield, which is a pretty good indicator for future rate hikes, has risen to its highest level since 2007.
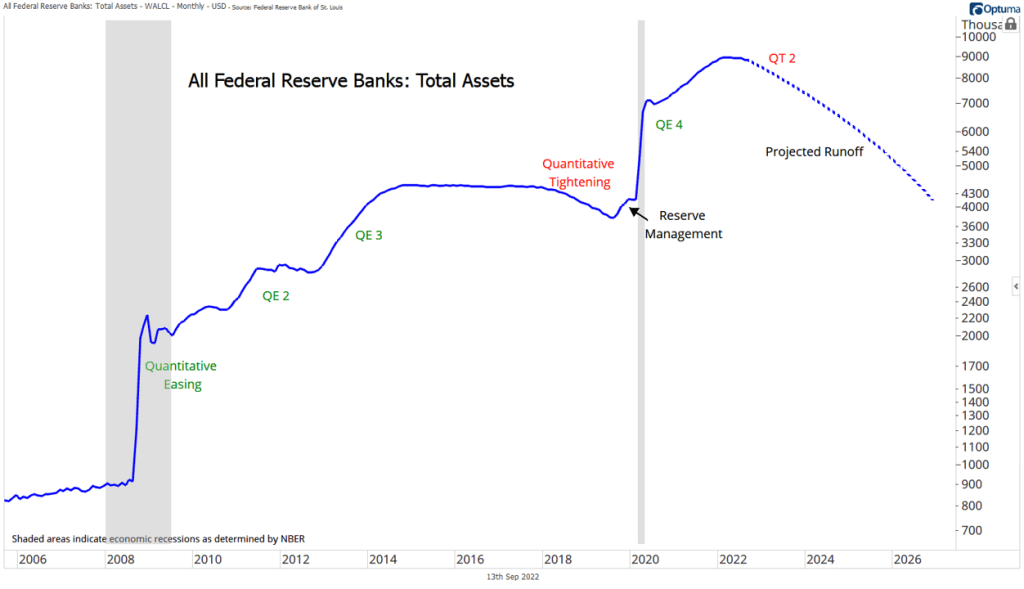
Increasing short-term interest rates isn’t the FOMC’s only tightening tool in action: in September, monthly rolloff caps for the Federal Reserve’s balance sheet increased to $60 billion for Treasuries and $35 billion for mortgage-backed securities. At $95 billion per month, the speed of maximum runoff is almost double the $50 billion pace implemented in 2017, our only previous experience with so-called quantitative tightening.
At this rate, total Fed assets would decline to $6.2 trillion by 2024 and $5.1 trillion by 2025. Of course, balance sheet shrinkage will only continue until we reach what the Fed describes as an ‘ample supply of reserves’, and Fed officials themselves don’t know what that level will be. In 2018, they overshot the mark and were forced to restore liquidity to the banking system via ‘reserve management’.
Inflation and the Labor Market
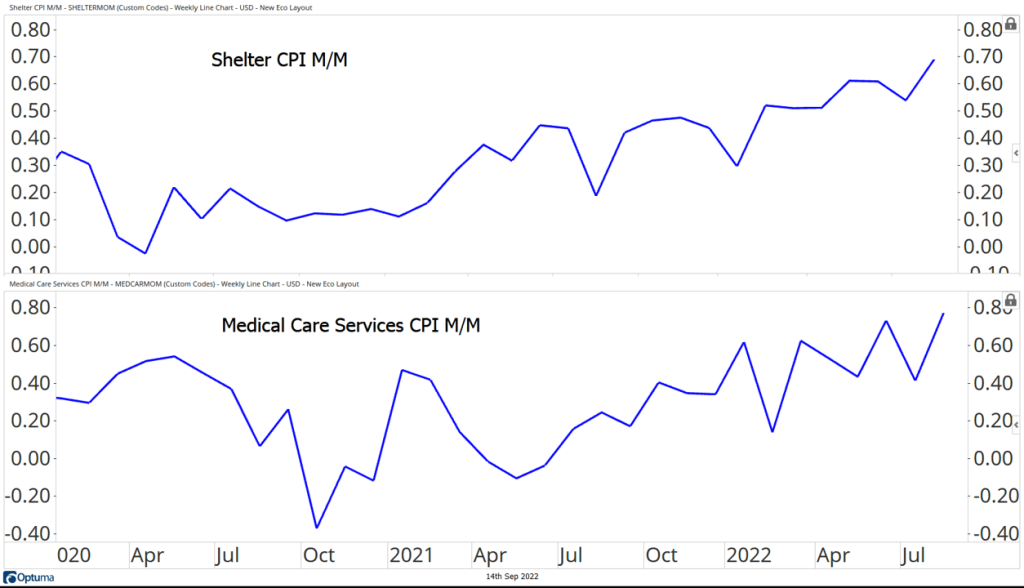
Prices continue to rise at a rapid pace, with the August CPI report coming in hotter than most economists had expected. Energy prices continued to fall, pushing the headline number down to 8.3% from July’s 8.5% reading. But core inflation, which strips out the volatile food and energy components and is supposed to be a better representation of the underlying trend, reaccelerated to 6.3% in last month. Housing costs are the primary culprit, as the monthly change in the shelter component of CPI rose to cycle highs. Prices for medical care services accelerated, too. Combined, the two make up half of the core CPI basket.
The resurgence of inflation over the past two years has led to a revival of the Philips curve. The Philips curve states that inflation and unemployment are inversely related – when unemployment is low, inflation will be high. During the years preceding the pandemic, many economists gave up on the theory as a useful model for the economy, and understandably so. From 2017-2019, unemployment fell from 4.7% to a 50-year low of 3.5%, but prices showed no ill-effects.
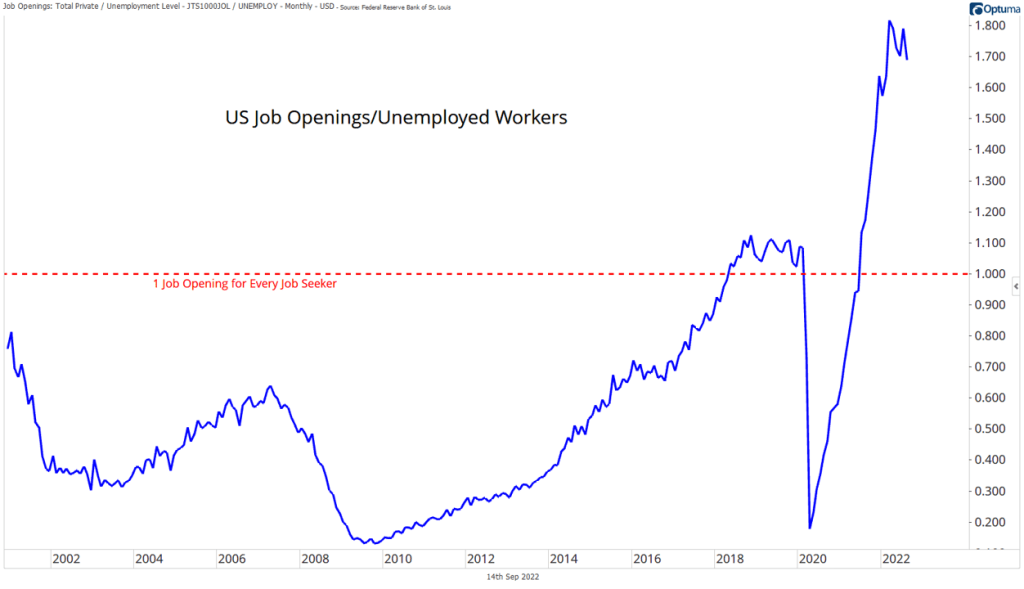
Now that inflation has returned, though, Philips curve believers are back. Two recent Fed studies – one from San Francisco and the other from New York – showed that wages and inflation have become increasingly linked. And according to ECB member Isabel Schnabel in a speech earlier this week, the slope of the Philips curve (e.g. the magnitude of relationship between its two variables) could be steeper when inflation runs hot. We could debate the merits of causation vs. correlation, and economists likely will for decades to come, but of this we can be sure: inflation is too high (just look at the chart above), and the labor market is tighter than ever. Nearly two jobs are available for every unemployed worker.
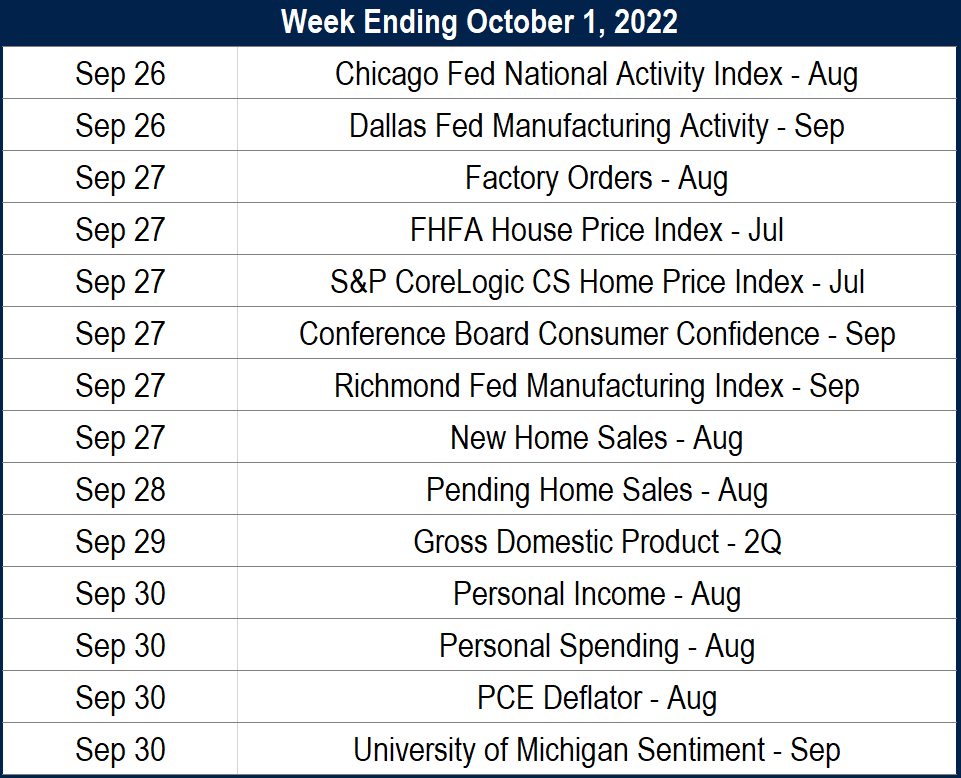
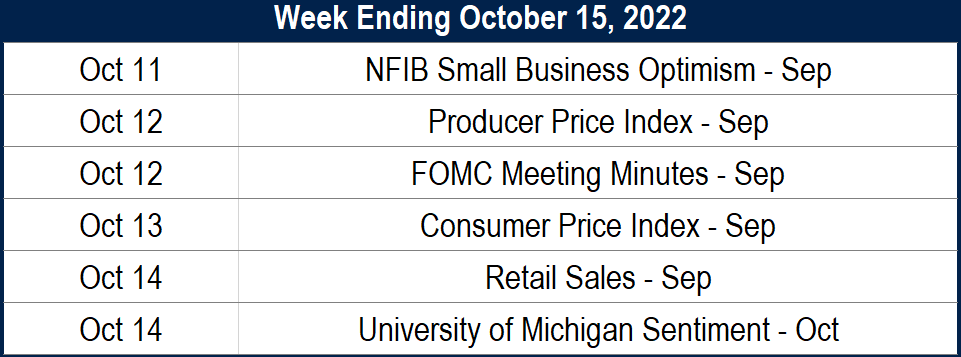
A Look at What’s Ahead
The content displayed here is for educational and informational purposes only and is not intended to constitute personalized investment advice. Contact a financial advisor if you have questions regarding your personal financial situation.
The post Mid-Month Market Update: September 2022 first appeared on Grindstone Intelligence.


