Momentum and the Volatility of Future Returns
The relative strength index (RSI) is a momentum oscillator created by J. Welles Wilder Jr. that measures the speed and magnitude of recent price changes. One of the most common interpretations of RSI is that a reading greater than 70 (on a scale of 0 to 100) indicates ‘overbought’ levels, signaling prices may be primed for a pullback. A reading below 30, on the other hand, is called ‘oversold’, and hints at a possible bounce. This simple interpretation has a mixed historical record for timing reversals – overbought readings can get even more overbought, and vice versa. When calculated using a 14-day period, though, RSI can provide valuable information about the volatility of future returns.
Stock market forecasters face a persistent problem with historical data: There isn’t enough of it. For many factors used to make forecasts in the today’s world – economic data, book values, earnings, etc. – data wasn’t rigorously collected until the 1950s and 1960s. Academics have made valiant efforts to compile information from before then, but that information is subject to survivorship bias and bookkeeping flaws. Luckily, RSI skirts those issues, because RSI is a direct transformation of price data, which has been collected for much longer.
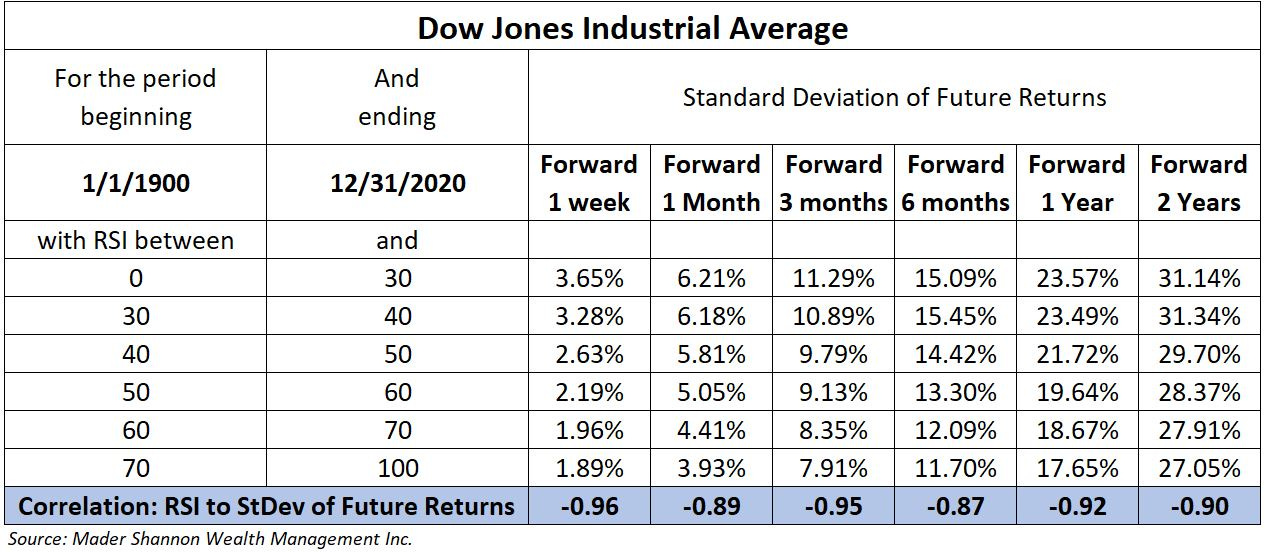
Charlie Dow was the first (or perhaps only the most famous) to aggregate and publish prices for a U.S. stock index. Thanks to his efforts, daily prices for his trademark Industrial Average are available as far back as the late 1800s. A review of that data shows that RSI exhibits a strong negative correlation with the standard deviation of future return distributions.
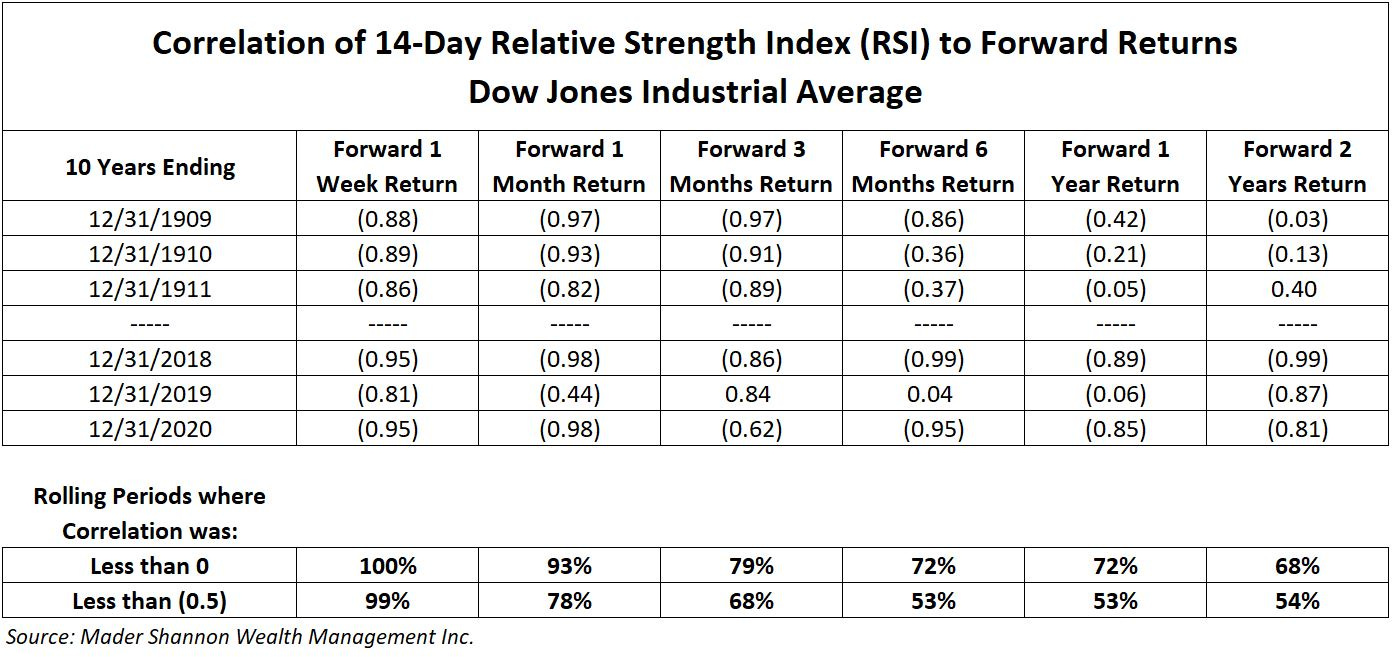
What’s striking about the data is not only the strong relationship, but the consistency. No indicator is perfect, and even widely used factors fall out of favor for extended periods. This relationship, though, managed to hold consistently over rolling 10 year periods since 1900, especially over 1 week and 1 month horizons. And while RSI’s predictive value for volatility clearly declines with time, it still offers insights into returns as far as 2 years in the future.
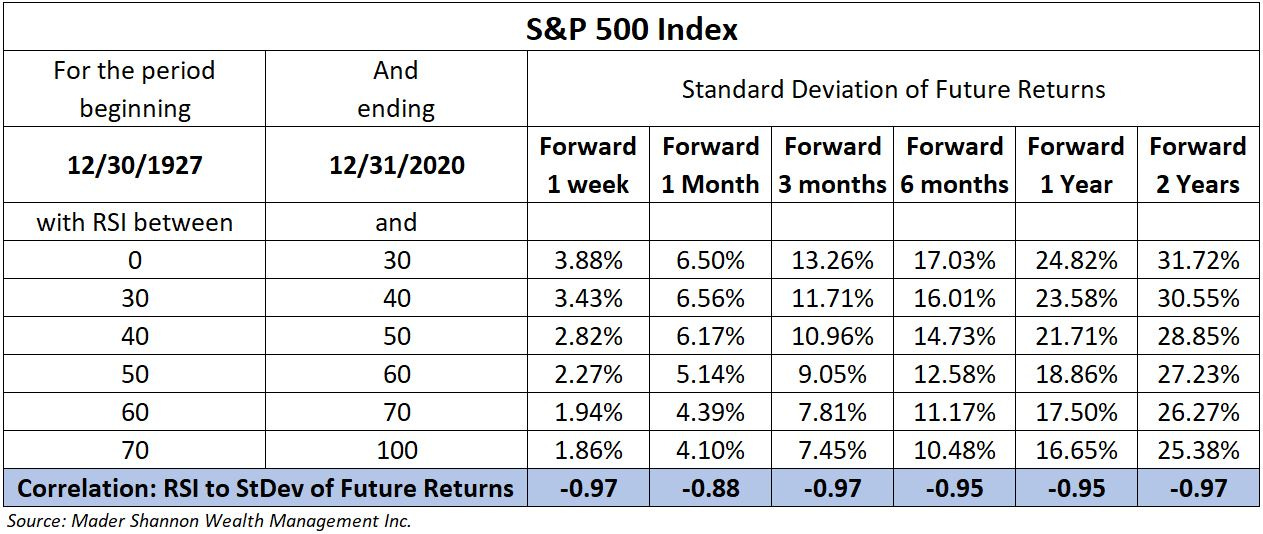
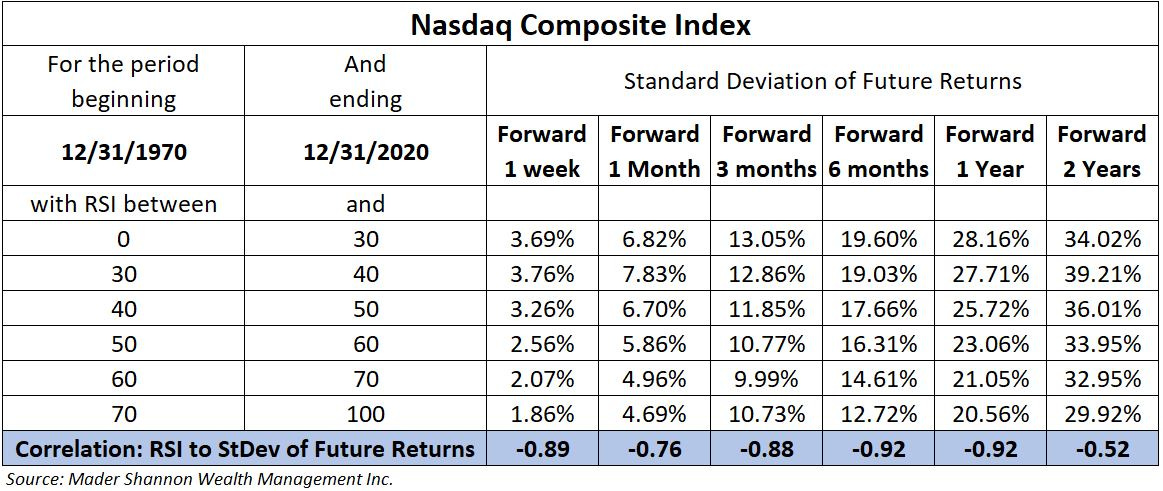
Moreover, it’s held not just for the Dow Jones Industrial Average, but for the S&P 500 and the Nasdaq Composite, too.
Momentum is nearing extremes for some of the major indexes today. But when prices are ‘overbought’ or ‘oversold’, think less about what that means for the direction of the market and more about what it could mean for volatility.
Nothing in this post or on this site is intended as a recommendation or an offer to buy or sell securities. Posts on Means to a Trend are meant for informational and entertainment purposes only. I or my affiliates may hold positions in securities mentioned in posts. Please see my Disclosure page for more information.
The post Momentum and the Volatility of Future Returns first appeared on Grindstone Intelligence.


