Monitoring Momentum Divergences
The S&P 500 and Dow Jones Industrial Average both touched new records last week. I don’t know of a world in which new all-time highs are bearish. In fact, a quick historical study shows that healthy returns tend to follow new highs in prices. Nothing lasts forever though, so it pays to be aware of potential reversal indicators. And instances of one such indicator have added up in recent weeks.
The relative strength index (RSI) is a momentum oscillator created by J. Welles Wilder Jr. that measures the speed and magnitude of recent price changes. One of the most common interpretations of RSI is that a reading greater than 70 (on a scale of 0 to 100) indicates ‘overbought’ levels, signaling prices may be primed for a pullback. A reading below 30, on the other hand, is called ‘oversold’, and hints at a possible bounce. This simple interpretation has a mixed historical record for timing reversals (overbought readings can get even more overbought, and vice versa), though extended readings do measurably tend to impact volatility.
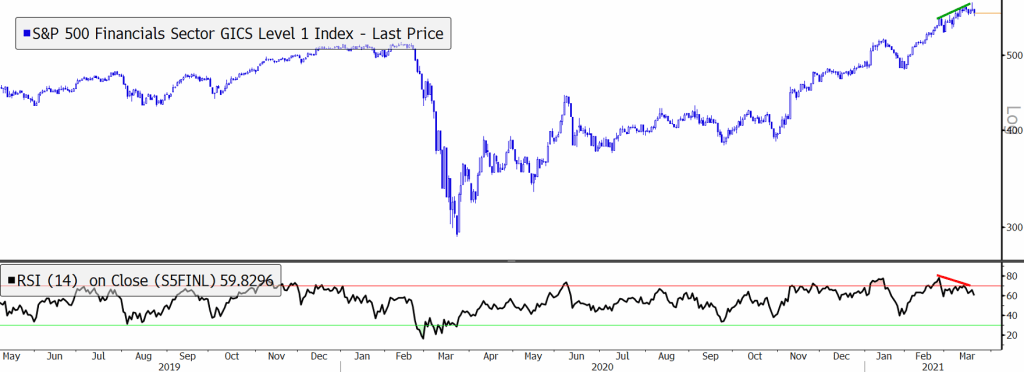
Another way to use RSI – and the subject of this particular post – is to identify when trends may be slowing through the observation of momentum divergences. A momentum divergence occurs when prices set a new, incremental high, but RSI fails to do so. Divergences often require corrective action, through sideways or falling prices, but they aren’t perfect timing mechanisms – the existing trend can continue for an extended period even after the divergence first appears. For a valid signal, it’s important for prices to confirm weakening momentum with an initial move lower.
Potential divergences (those currently lacking price confirmation) are piling up at both the index level and in individual stocks. Here are a handful to keep an eye on in the coming weeks.
The S&P 500 has made 3 successive new highs since getting overbought in January, but momentum has declined on each successive rally.
The Russell 2000 Index was posting strong RSI levels in February, but failed to get back above 70 on the most recent advance.
At the sector level, Financials and Communication Services have seen momentum falter over the last month, while prices have continued higher.
For each of these groups, a break below the March lows would act as confirmation of the signal, and could spell trouble for stocks in the coming quarters.
Nothing in this post or on this site is intended as a recommendation or an offer to buy or sell securities. Posts on Means to a Trend are meant for informational and entertainment purposes only. I or my affiliates may hold positions in securities mentioned in posts. Please see my Disclosure page for more information.
The post Monitoring Momentum Divergences first appeared on Grindstone Intelligence.


