October Technical Market Outlook
At the outset of every month, we take a top-down look at the US equity markets and ask ourselves: Do we want to own more stocks or less? Should we be erring toward buying or selling?
That question sets the stage for everything else we’re doing. If our big picture view says that stocks are trending higher, we’re going to be focusing our attention on favorable setups in the sectors that are most apt to lead us higher. We won’t waste time looking for short ideas – those are less likely to work when markets are trending higher. We still monitor the risks and conditions that would invalidate our thesis, but in clear uptrends, the market is innocent until proven guilty. One or two bearish signals can’t keep us on the sidelines.
Similarly, when stocks are trending down, we aren’t looking to buy every upside breakout we see. We can look for those short opportunities instead, or look for setups in other asset classes.
Today, storm clouds are brewing. Interest rates are on the rise, and the US Dollar is in the midst of an historic move higher. Both were headwinds in 2022, and their resurgence has had the same effect this year. The S&P 500 is off 7% from its July peak.
Despite advocating for a more cautious approach to equities in our last two monthly outlooks, it’s been our opinion that the recent selloff was merely a pullback within a longer-term uptrend. After all, pullbacks of 5-10% are quite common within bull markets, and the months of August and September are typically some of the weakest. Now we’re forced to question whether we’ve been too sanguine about the outlook. Is this the start of a much bigger decline?
An extended bear market would be starting from pretty logical levels. The area near 4500 is the 423.6% Fibonacci retracement from the entire 2007-2009 decline. The market has respected these levels over the last 10 years, so we should, too. The next leg of this young bull market can’t begin until we’ve absorbed all the overhead supply from this major resistance zone.
Here’s a closer look at a few more key levels we’re watching. The most important near-term level is 4310. That’s the 61.8% retracement from last year’s bear market, and also the swing high from last summer. If the SPX can’t hold that, we’ll be looking for support down near 4150. That was a significant area of resistance in the spring, and it also happens to be the 161.8% retracement from the COVID selloff. Our base case continues to be that this is a consolidation within an ongoing uptrend. Things are messy between 4150 and 4500, so it could take some time to get the resolution higher, but that’s our expectation. Supporting our view is that prices have managed to stay out of oversold territory (even if just barely).
A sustained break below the spring highs would change our minds. That would be a clear sign that bears are in control, and we’d start looking at the world through a different lens.
Easy to be bearish…
There are plenty of reasons not to like this market. Breadth is weak and getting weaker. Just 12% of S&P 500 stocks are above their 50-day moving average, and two-thirds are below their 200-day.
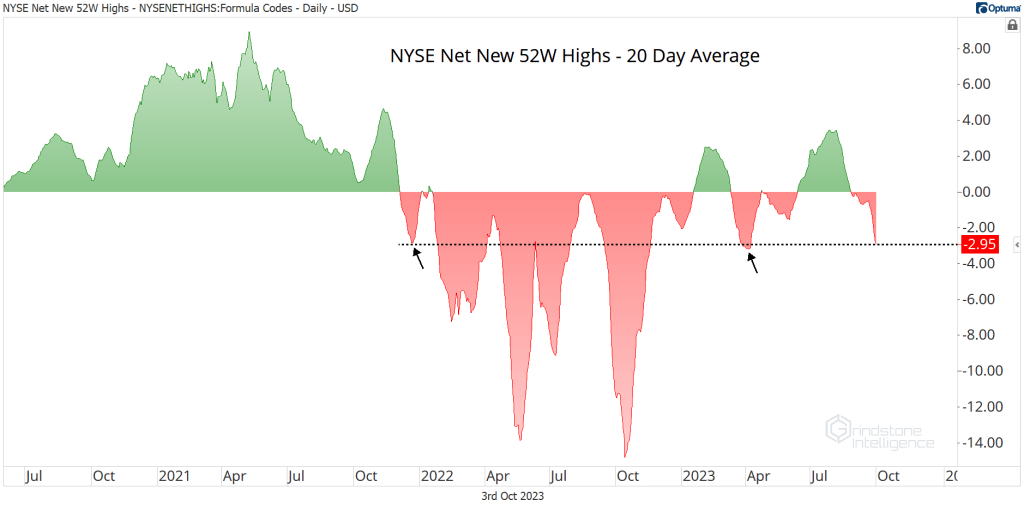
And we’re seeing an expansion in the number of new lows. The net number of new lows on the NYSE is on par with the weakness we saw in December 2022 (before the market peaked) and March 2023 (after the market bottomed). A further weakening in the net new highs index would be more consistent with a renewed bear market than a continuing bull.
Weakness is even more pronounced in the smallest of stocks. One question we have to ask ourselves when thinking about a bear market is, “Who’s going to lead us lower?”
We’d have an answer if the micro-caps can’t rally back above their pre-COVID highs, a support level that’s held since last summer.
One place that bearishness seemingly hasn’t reared its head is in ratios that we use to gauge risk appetite. When investors are worried about the future, they tend to favor businesses that offer relative stability, like Consumer Staples and Utilities. That’s not happening today.
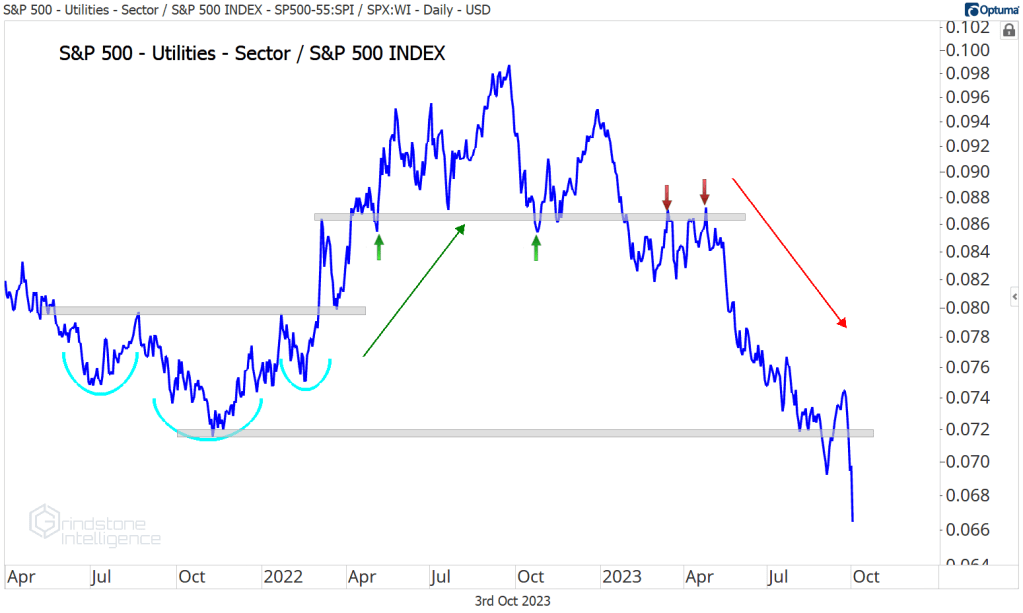
The Consumer Staples sector has been underperforming Consumer Discretionary all year, and the Utilities just dropped to new lows relative to the S&P 500.
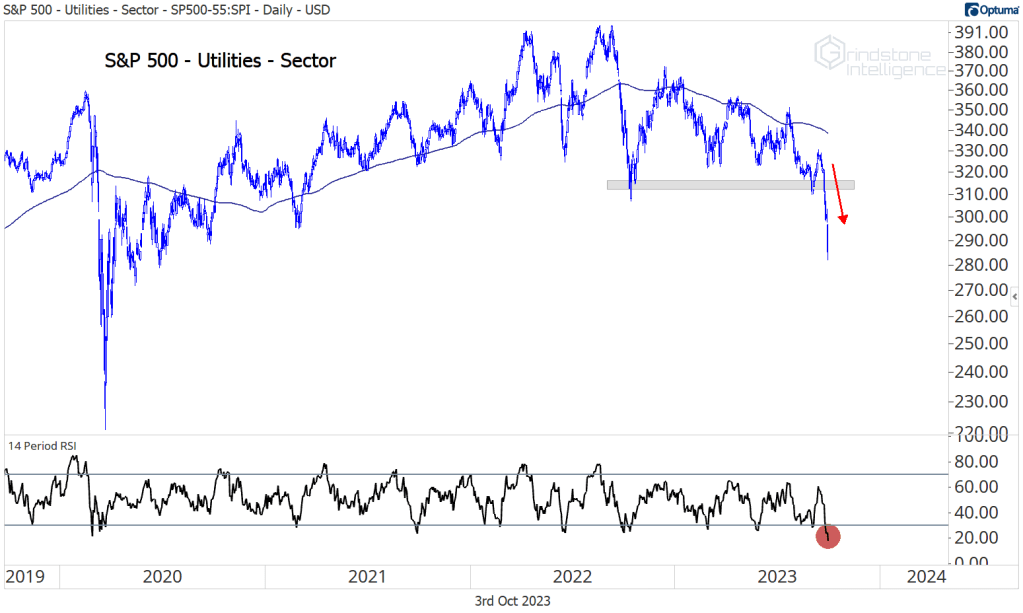
But is that a sign of investors favoring risk, or has something changed? Utes and Staples aren’t just lagging – they’re breaking down. The Utilities sector is at 3-year lows and daily RSI just hit the lowest level since October 2008.
We think that inflation and interest rate dynamics have muddied these formerly useful ratios. The rates charged by Utilities companies are highly regulated, and the price elasticity of demand for consumer goods is rising. That makes it tougher to maintain margins in a rising cost environment. And interest rate shifts are reshaping asset allocation preferences. For more than a decade, central banks around the globe held interest rates at artificial lows, forcing investors to take more risk in order to achieve their financial goals. Savers who’d once been happy with a 5% CD down at the local bank instead looked toward stable, high dividend stocks like the ones you’d find in the Utilities and Consumer Staples sectors. Now that risk-free interest rates are at 15-year highs, we’re seeing asset allocation preferences shift back.
In short, risk appetite isn’t as healthy as it initially appears.
Was it just a seasonal decline?
It all comes down to this, we suppose: Was the selloff in September just a seasonal phenomenon? Stocks are supposed to fall in September. That’s what they’ve historically done.
But now we get to see Mr. Market’s true colors. The fourth quarter has been the best time to own stocks. Will it be so again?
We write about some of our favorite stocks and share other investment ideas each week with Members and Subscribers. Here are links to our most recent sector and asset class reports.
(Premium) Information Technology Sector Deep Dive – September
(Premium) Communication Services Sector Deep Dive – September
(Premium) Consumer Discretionary Sector Deep Dive – September
(Premium) Utilities Sector Deep Dive – September
(Premium) Health Care Sector Deep Dive – September
(Premium) Real Estate Sector Deep Dive – September
(Premium) Consumer Staples Sector Deep Dive – September
(Premium) Industrials Sector Deep Dive – September
(Premium) Materials Sector Deep Dive – September
(Premium) Energy Sector Deep Dive – September
(Premium) Financials Sector Deep Dive – September
(Premium) FICC in Focus – September
The post October Technical Market Outlook first appeared on Grindstone Intelligence.


