Oil Prices Diverging From Energy Stocks
There were plenty of moves to watch last week: Stocks rallied more than 3%. Bonds fell to their lowest weekly close since 2010. The U.S. Dollar rallied to its highest point in 20 years against the Euro.
Perhaps the most interesting development, though, was crude oil breaking down to its lowest levels since January.
Oil was trading near $95 earlier this year before war broke out in Eastern Europe, spurring crude prices higher. That area near $95 then acted as support on several occasions over the spring and summer. One of the first things I learned studying technical analysis was polarity. Broken support levels don’t just disappear, they become resistance. Levels matter whether prices approach them from above or below. And that’s exactly what happened with crude oil – it fell below $95 in early August, then got rejected at former support on a rally attempt.
Seeing Technical Analysis 101 in play out in real-time is always fun, but that’s not what stood out about oil’s move. What caught my eye is how well the S&P 500 Energy Sector has held up amid the decline.
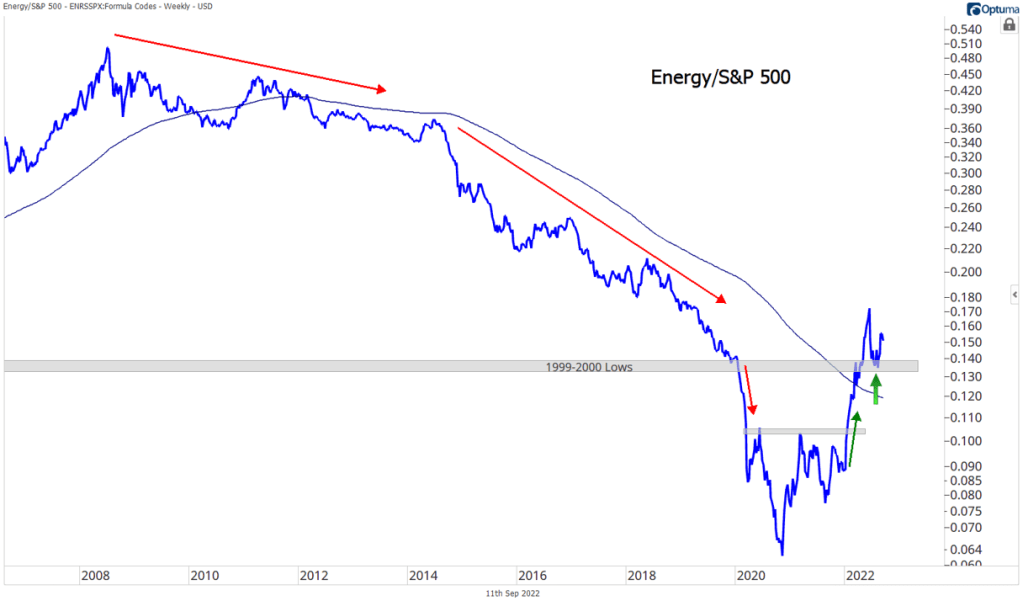
Energy stocks have been rising since July, and they’re still by far the best-performing sector in 2022, up 45%.
The sector is in a well-defined uptrend, with prices comfortably above a rising 200-day moving average. The 200 has been a great indicator for the group. I don’t consider moving averages to be places of support or resistance, but it’s hard to ignore how much price has respected this one going all the way back to 2018. We’ve seen reversal after reversal take place right at the moving average, and on the two cases the line has been clearly broken, the trend has shifted.
With crude oil breaking lower, it wouldn’t have been surprising to see Energy stocks follow suit. Especially since they’re pushing up against a pretty significant resistance level – one that’s sparked 2 major selloffs over the past 15 years. Who could forget the 2008 peak, back when crude was near $150 per barrel? Or the 2014-2016 selloff, where crude fell from over $100 to less than $30?
Those weren’t fun times to be invested in the Energy sector. In fact, it wasn’t much fun to be an Energy investor at any time after 2008, at least up until the last 18 months. From the 2008 peak to the COVID lows, Energy stock prices fell by 75% and underperformed the S&P 500 index by nearly 90%.
So why should this time be any different? Oil prices are falling, doesn’t that spell doom for the companies producing and refining it? Maybe, but this isn’t 2008. U.S. shale is far more developed than it was back then, and drillers are far more efficient. Oil prices peaked out around $130 after Russia invaded Ukraine, but they’ve spent most of the last year closer to $100. That’s a far cry from the $150 peak more than a decade ago, yet sector earnings over the last 12 months are substantially higher than they were in 2008.
It’s not 2014, either. Executives are much more disciplined with capital spending and production, and the smaller, less efficient players have been absorbed by larger ones. The producers today are cash flow positive at much lower oil prices than they were 8 years ago. What’s more, oil prices in the 5 years after the 2014 collapse averaged less than $55 per barrel, yet they’re still above $80 today. That’s a lot of margin gains to consider. Maybe that’s why Energy names continue to lead.
Lower oil prices certainly aren’t good for Energy stocks.
But judging by the sector’s recent performance, they aren’t as bad as they used to be.
Nothing in this post or on this site is intended as a recommendation or an offer to buy or sell securities. Posts on Means to a Trend are meant for informational and entertainment purposes only. I or my affiliates may hold positions in securities mentioned in posts. Please see my Disclosure page for more information.
The post Oil Prices Diverging From Energy Stocks first appeared on Grindstone Intelligence.


