(Premium) FICC in Focus
We keep waiting on silver to take a leadership role.
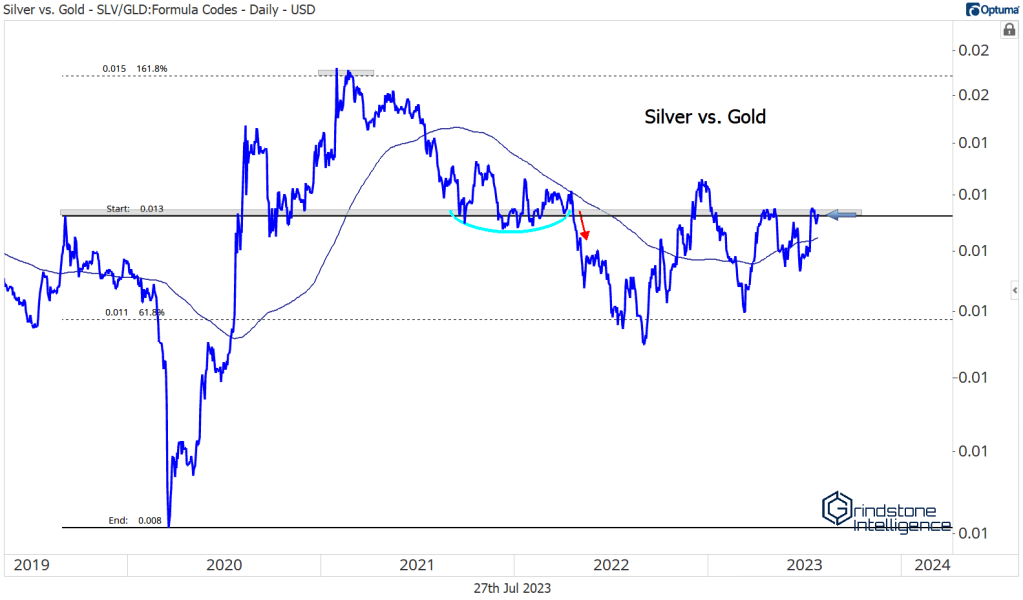
Prices for silver and gold tend to be highly correlated, but silver tends to move in greater magnitudes. As such, when precious metals are rising, we expect silver to outperform. That’s what we’ve typically seen during gold’s best runs. These days, silver refuses to lead.
Towards the end of last year, precious metals prices surged, with gold jumping from near $1600 to above $1800 by January. Similarly, silver jumped 30% from its October lows over that time. Gold prices continued to rise with the new year. Silver did not.
That divergence caused us to turn pessimistic on gold’s rally, and our concerns turned out to be well-founded. Gold and silver both dropped sharply in February. They’ve each recovered since then, but the Silver/Gold ratio is still struggling to gain ground. It’s battling the 2019 highs, which have marked a key rotational level for the past 4 years.
A relative breakout for silver would be a very positive development for both metals, in our opinion, so we’ll be watching this one closely in the coming days and weeks.
On its own, silver continues to hold up. There’s plenty of overhead supply to absorb, and the word ‘messy’ comes to mind when you see all the chop we’ve been dealing with for the past few years. Be that as it may, though, silver is above a rising 200-day moving average, and it has been since March. The one thing we know is that it’s not in a downtrend.
We can’t say the same about Palladium, another precious metal. It’s now at its lowest level since 2018, and any bounce will be resolutely contested by a key rotational level just below $1600. If anything, we want to be selling Palladium on rallies, not hoping for a reversal out of the blue.
Silver’s lackluster moves and palladium’s outright weakness have helped keep a lid on gold, which continues to hang near all-time highs. Buyers have managed to get prices back above near-term support at $1950, which should stave off a decline back to the low end of this multi-year range.
The problem with holding gold throughout this period is not so much that prices are falling. We’re only 4% from the April peak. the opportunity cost is where it hurts. Stock prices have been screaming higher since gold’s peak.
Timeframes are important here. Since the S&P 500 peaked in January 2022, gold has still been the better bet. The recent trend has clearly shifted in favor of equities, though. The stocks vs. gold ratio has broken the downtrend line from the peak and is further above the 200-day moving average than at any time over the last 18 months. That’s a stark shift from April, when it looked like the ratio was set to resolve lower.
Things could shift back in favor of the yellow metal if it breaks out of this big consolidation range. Each time buyers push prices up toward $2070, they absorb more overhead supply. At some point, there won’t be any sellers left. How high could the metal go on a breakout above $2070? We’re eying $3200. That’s the 1794% Fibonacci retracement from the 1990s decline. Prices have respected these retracement levels all the way up: The hiccups in 2006 and 2008 occurred near Fib levels, the ceiling from 2013-2019 was the 684.4% retracement, and right now, were stuck below the 1109% retracement. It would make a lot of sense to go up and touch the next one. $3200 might even be a conservative expectation – prices rallied a lot more after the 2004 breakout.
Base metals
While precious metals work on resolving higher, base metals are just trying not to set new lows. For now, they’re doing a good job of that. Check out the Invesco DB Base Metals Fund bouncing off the former lows again this summer:
It’s still not in an uptrend by any means, but at least we’re not seeing support get broken.
For more positive action, we’re going to need to see a bullish resolution out of copper. Copper’s doing its best to turn things around after struggling for most of this year. Price is above an upward sloping moving average, so we know this isn’t a downtrend. But unless we can set some higher highs and break the downtrend line from the peak, we simply can’t see a reason to be long copper or the DBB.
Energy
The bears fumbled their opportunity.
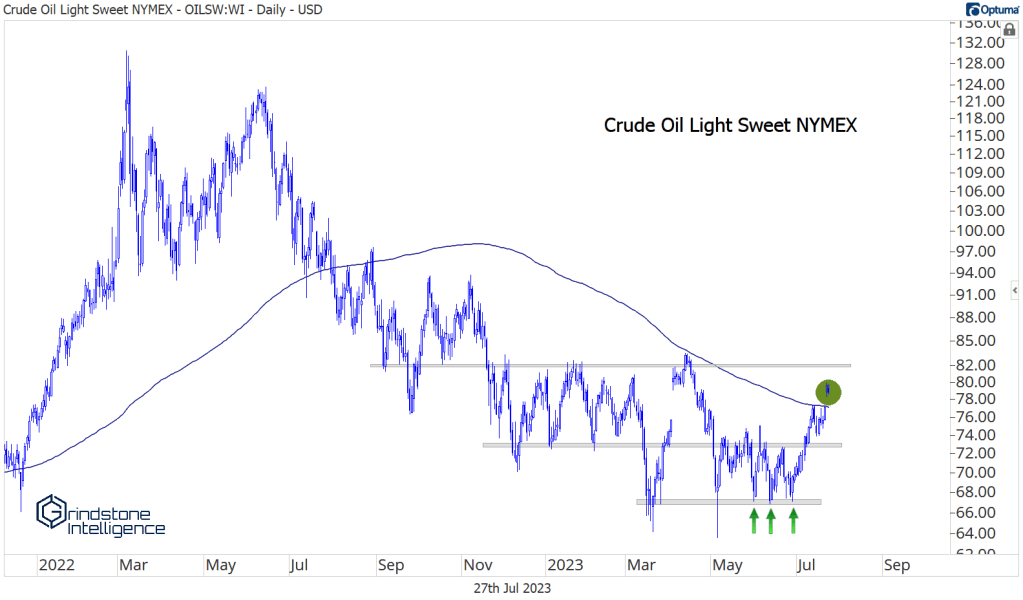
Crude oil was vulnerable below $73. It even dropped as low as $63 one morning, before buyers stepped in to defend it. Now, prices are back above the first key level of resistance. That doesn’t mean we want to be aggressively buying oil here – at least not until we get above $83 and really show signs that a new uptrend is in place – but we can have confidence that the immediate threat of lower oil prices is now in the rearview mirror.
That’s what we wrote about crude two weeks ago in our Energy sector note. Since then, oil prices have continued to surge. We gapped above the 200-day moving average for the first time in almost a year, leaving sellers gasping for breath in the rearview mirror.
We still would prefer not to own oil outright until we see a new uptrend in place. That would be on a break above $83 a barrel.
But we’re seeing relative strength elsewhere in the energy space. Gasoline (UGA) is at new 52-week highs after breaking out above stiff resistance that had been in place since last fall.
We’re using Fibonacci retracements from the 2020 decline to help identify key levels. A failed breakout above the 216.8% retracement started this consolidation last year, and we’re targeting a $115 longer-term, which is the 423.6% retracement.
And since Fibs are fractal in nature, we can use a new retracement on recent action to identify shorter-term risk levels. The 61.8% retracement from last year’s decline sits at $65, and should act as support on any pullbacks. We’re also using the 161.8% retracement from that decline to set a near-term target of $90.
The Softs
Did we lose track of the Duke brothers? Orange juice is off to the races again!
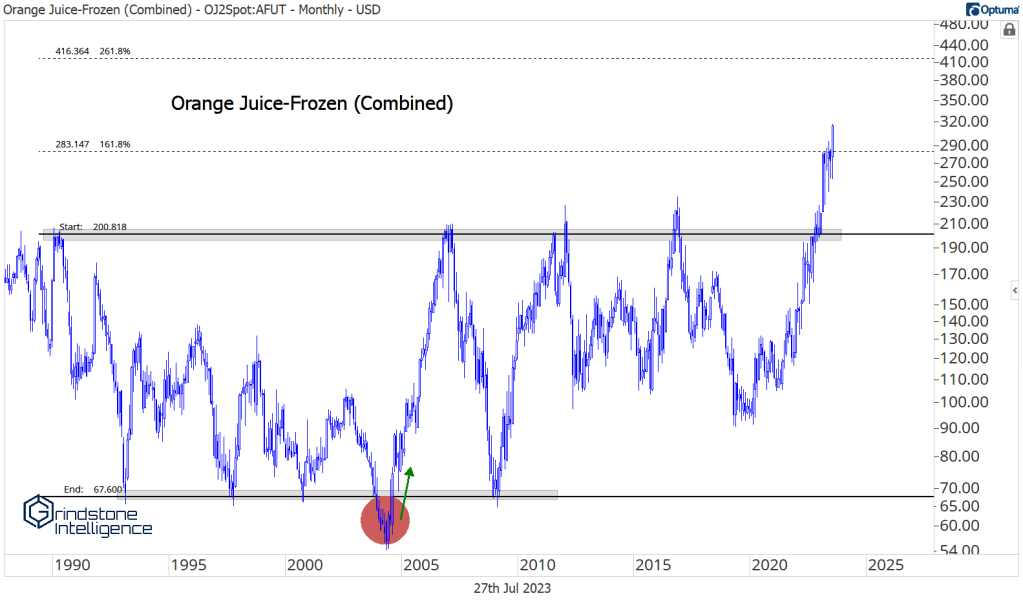
Last time we checked in on OJ was in May, when we noted that it had reached the 161.8% retracement from a 30-year range. We surmised that prices would likely stall out at that level, and our suspicions were confirmed as OJ did nothing for the next few months. Now, that consolidation has resolved higher:
Here’s a big picture look:
It feels like crazy talk to say that the next level for Orange Juice is all the way up above $400 – that’s the 261.8% retracement from the 1990-2020 range – but it seemed a bit crazy to target $280 on the initial breakout last fall, too. Sometimes prices do crazy things. It’s not our job to question them. It’s our job to listen and pay attention.
Cattle prices continue to break out, too. A move to $200 isn’t out of the question.
And Sugar has recovered above its 2016 highs after a sharp selloff in June. With our risk clearly defined at $23.50, we’re looking for a rally to $32 in Sugar, which is the 161.8 retracement from the big 2016-2018 decline and also lines up with the all-time highs from back in 2011.
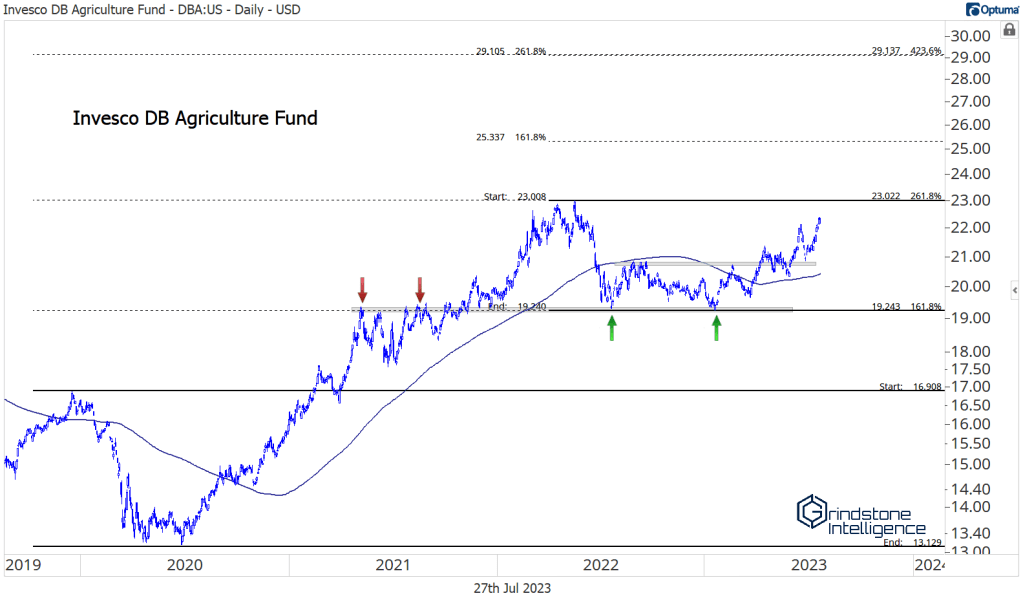
DBA might be the easiest way to play the strength in Ags. It’s not breaking out to new all-time highs, but we’re nearing a challenge of last year’s peak at $23. On a breakout, we’re looking at an initial target of $25.30, with the idea that longer-term we could go all the way up to $29.
Just one more…
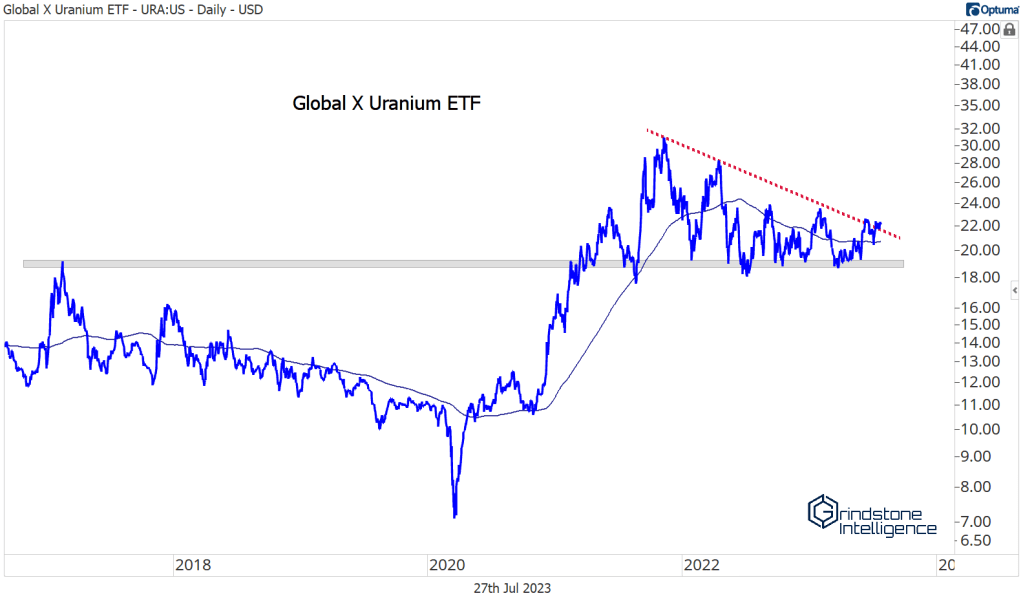
Uranium is one of the best setups in the entire commodities space. URA has been consolidating above support for 2 years after it completed a long-term bearish-to-bullish reversal in 2020. Our risk here is very clearly defined for URA: we don’t want to own it if it drops below 18. But if we’re above that, we think URA can go back to the 2021 highs at 31. Longer-term, it could go much higher.
Currency Land
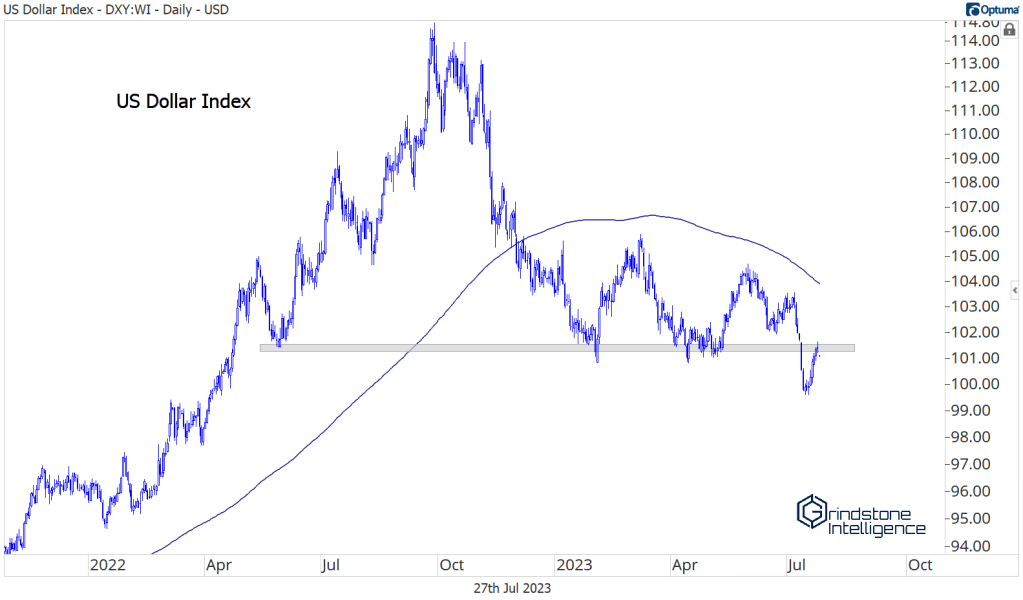
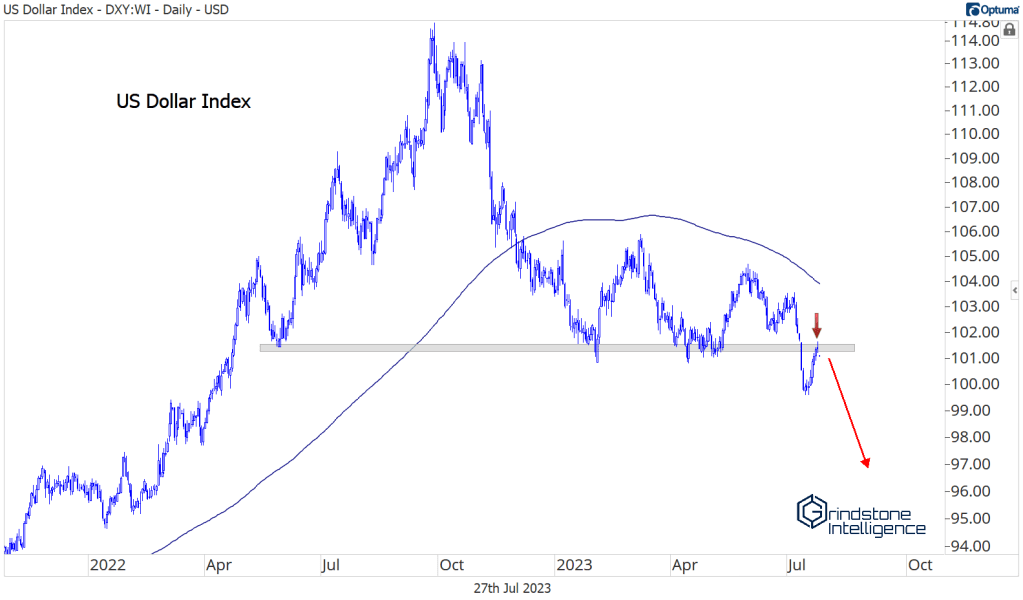
The US Dollar Index is at a make-or-break level, in our opinion. After falling to new 52-week lows earlier this month, the index has rallied back to the initial breakdown level.
This is a really important one, because the US Dollar was a major headwind for stocks last year. Each time the Dollar moved higher, equity prices dropped to new lows. The US Dollar Index peaked last September, and shortly afterward, stock prices set their bear market low. Then the correlation between the Dollar and stocks slowly disappeared as currency moves stabilized.
A falling Dollar index would be consistent with more gains in stocks. So is that what we have here? A backtest of former support before resuming the trend lower?
Or is it going to be this one? A failed breakdown that sparks renewed strength in the Dollar and becomes a headwind for stock prices once again?
We aren’t sure, but we’re keeping a close eye.
The Japanese Yen tested resistance vs. the Dollar after losing 12% of its value from mid-January. With the BOJ still in easing mode, the Yen faces a structural disadvantage here. However, a surprise move from the BOJ to ease yield curve control in the months ahead could be the catalyst that sparks a reversal. Did we say months? How about tonight at the BOJ meeting? Reports this afternoon are saying they’ll discuss a ‘tweak’ to YCC policy.
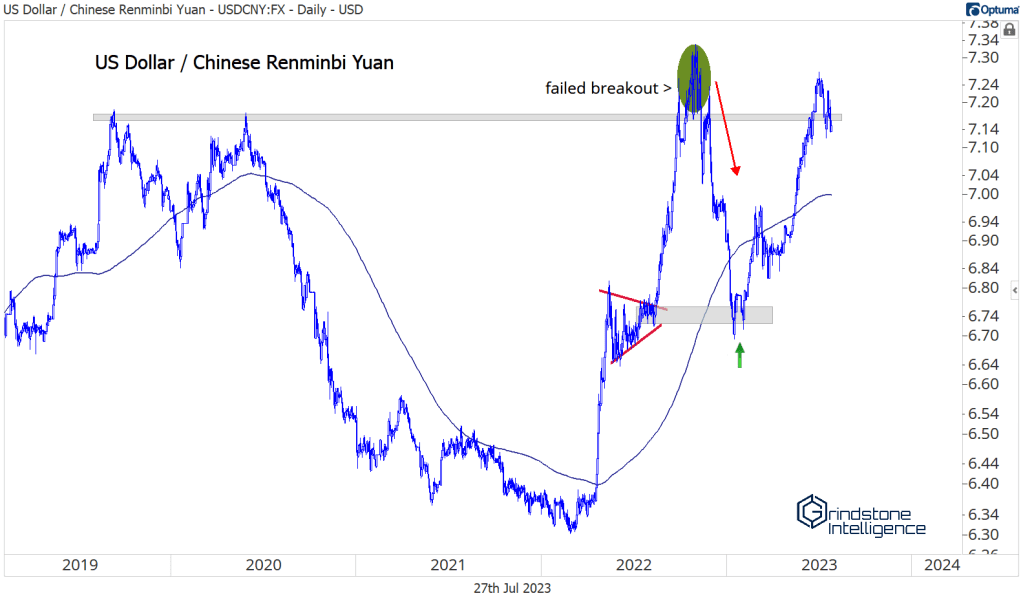
This move in the Dollar/Yuan is worth keeping an eye on, too. We’re working on what could be another failed breakout, as the Chinese government tries to stabilize both their economy and the wild moves in exchange rates.
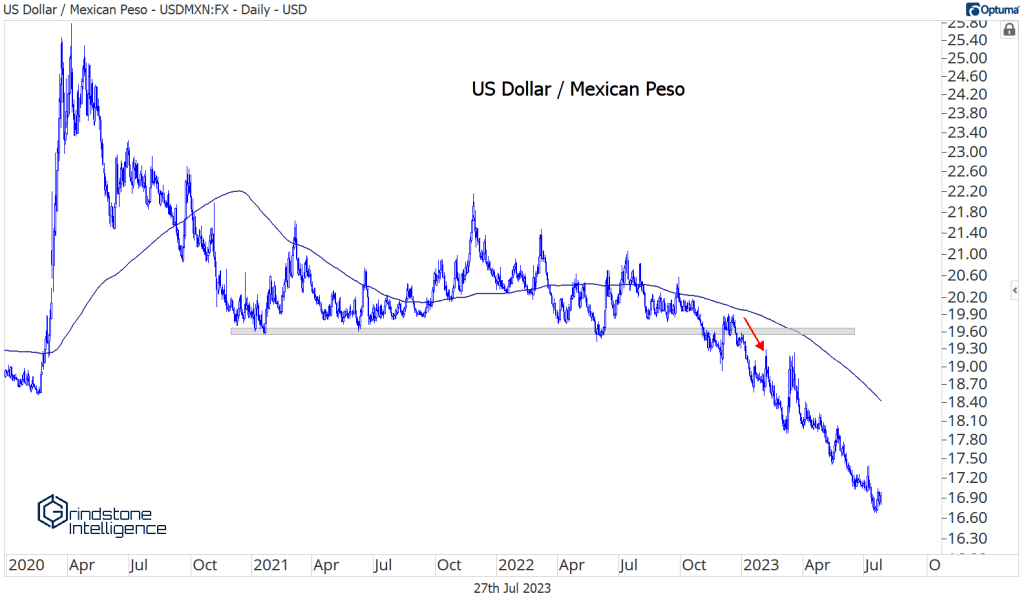
One of the few places where the trend is clear is in the USD/MXN cross. The Peso is setting multi-year highs against the Dollar, and shows no signs of stopping. Interestingly, this cross tends to move with the VIX. Stronger Peso = lower vol and higher stocks.
The Risk-On Environment
The Peso is telling us that this is a risk-on environment. Stock prices have been telling us that for awhile, too, and not just on an absolute basis. Stocks have been ripping higher vs. bonds.
Even within bonds, we’re seeing evidence of risk appetite. Emerging market bonds are breaking out relative to US Treasurys. Would investors be buying risky emerging market debt if they thought the world was on the verge of collapse? We think not.
And credit spreads are nearing 1-year lows. We’ve all but erased the post-SVB spike. Again, would credit spreads be drifting toward lows if investors were trying to avoid risk?
So in our asset class allocations, the market is telling us we want to be overweight riskier assets and underweight risk-off assets. With that in mind, let’s take a look at the trends in bonds themselves:
The trend isn’t up. At best, bonds are range-bound. At worst, they’re consolidating after a steep selloff in 2022, and they’re preparing to head lower.
We’d prefer the former. Lower bond prices and higher interest rates would be a headwind towards more gains in equities. But as long as rates are stable, we think that’s supportive of higher prices for stocks.
Check out TLT, the long-term Treasury ETF. It’s below a flat/falling 200-day moving average, but it hasn’t really deteriorated since setting a swing low at year-end. As long as TLT can continue to hold above that key level of support, we think the higher probability outcome is for higher stock prices.
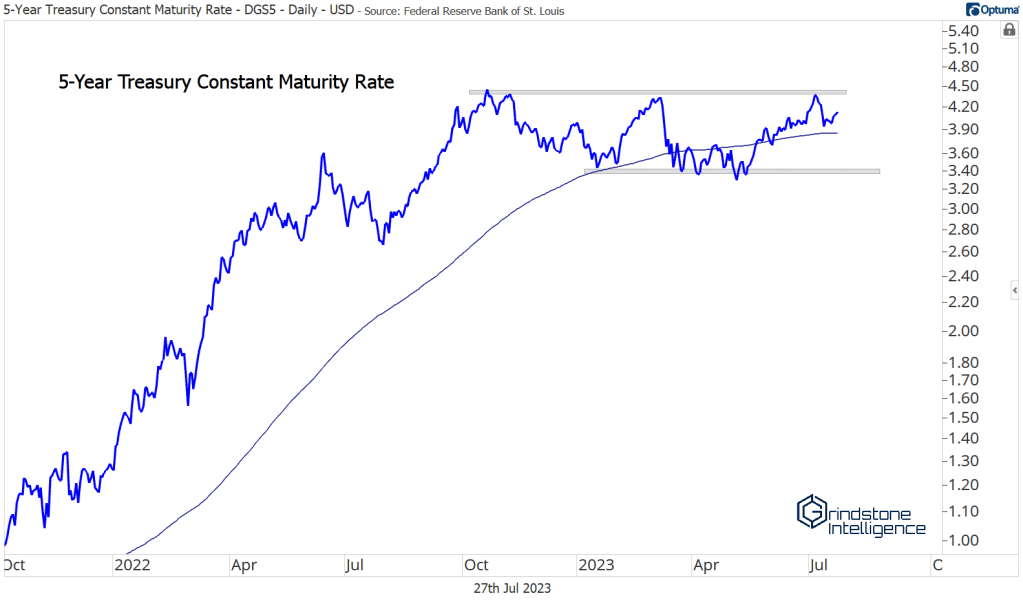
Keep an eye on 5-year Treasury yields, which have a history of being an early mover along the yield curve. If 5s are breaking out above 4.50%, we need to be seriously reassessing our appetite for risk, and we need to be wary of a broad move lower in bond prices.
Crypto
Just when we started to think Bitcoin was ready to feature more prominently in these monthly updates…
Bitcoin still hasn’t been able to absorb all this overhead supply from the summer 2021 lows. Listen, this isn’t a downtrend. We’re setting higher highs and higher lows. Price is above a rising 200-day. The uptrend line from the lows is intact. So we don’t see much reason to short Bitcoin. But we also have no reason to be long until we can break out above this key resistance level. When/if it does, the risk/reward will be heavily skewed in our favor, and we’ll be targeting short-term move above $40,000. Right now, the best course of action is to just leave it alone.
The post (Premium) FICC in Focus first appeared on Grindstone Intelligence.


