

(Premium) FICC in Focus – August

We’re experiencing a bit of déjà vu this month.
It seems like we’ve traveled back in time to 2022, when only two things seemed to matter: interest rates and the US Dollar. Those familiar foes have returned to the fore of the investment landscape, pressuring stock prices along the way.
Each time interest rose last year, the S&P 500 fell. And each time rates offered a reprieve, stocks rallied in relief. Look at how closely the two moved together:

Unsurprisingly, the stock market bottomed around the same time that interest rates reached their peak last fall. With 10-year Treasury yields stabilized, we saw stocks scream for most of 2023.
Now, rates are breaking out to new highs. The yield on 10-year Treasurys just reached its highest level since 2007.
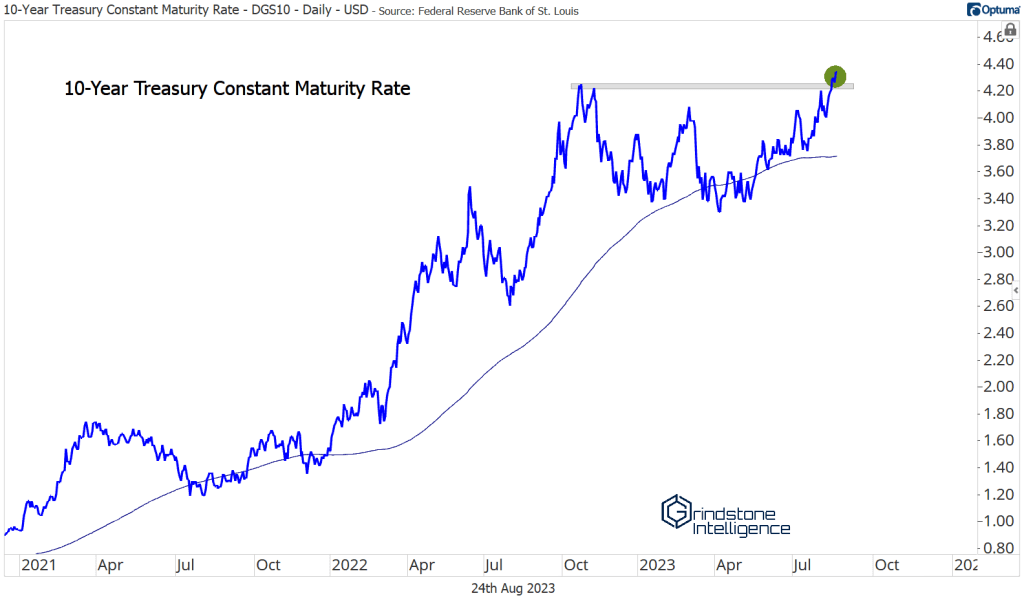
It’s not just the 10s, either. Rates are moving higher across the middle and long-ends of the curve. Here’s the breakout in 5-year yields.

And in 30s, which are at their highest point since the European Debt Crisis in 2011.

What’s got rates moving to the upside again? Blame a reacceleration in growth.
It’s still early in the quarter, but data for Q3 has been overwhelmingly strong so far. Following retail sales, housing starts, and industrial production reports last week, the Atlanta Fed’s GDPNow GDP estimate (a model based solely on data that’s already been reported) was revised up to a 5.8% annual rate. That’s roughly triple the Blue Chip consensus and would mark the fastest pace of growth since the early 1980s (not including the post-COVID rebound). And today, the number was revised to 5.9%(!).
Faster growth is good, though, right?
Of course, but there are two sides to every coin. Faster growth has economists talking about a ‘no-landing’ scenario, where inflation reaccelerates before reaching the Fed’s 2% annual target, and monetary policy officials are forced to keep hiking.
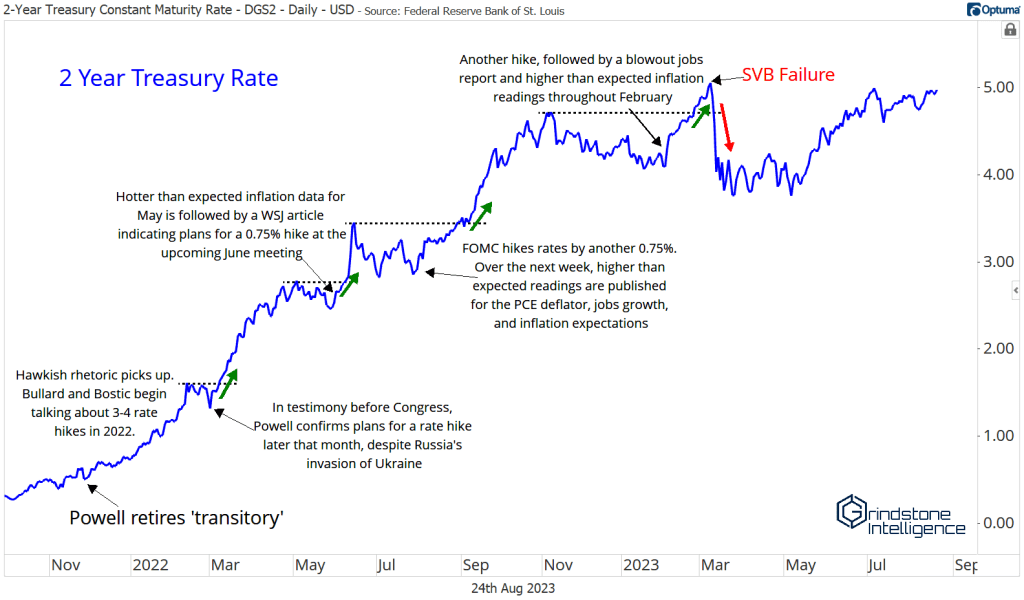
Market participants aren’t fully pricing in that risk, at least not yet. We think the 2-year Treasury yield is a good proxy for market expectations of the Federal Funds rate. And for now, 2-year yields are still on par with their pre-SVB highs – not above them.
Clearly, though, we’re no longer expecting rate cuts like we were back in April, because investors are less concerned about a recession on the horizon. How do we know that? Because we’re still seeing clear signs of risk appetite in the marketplace.
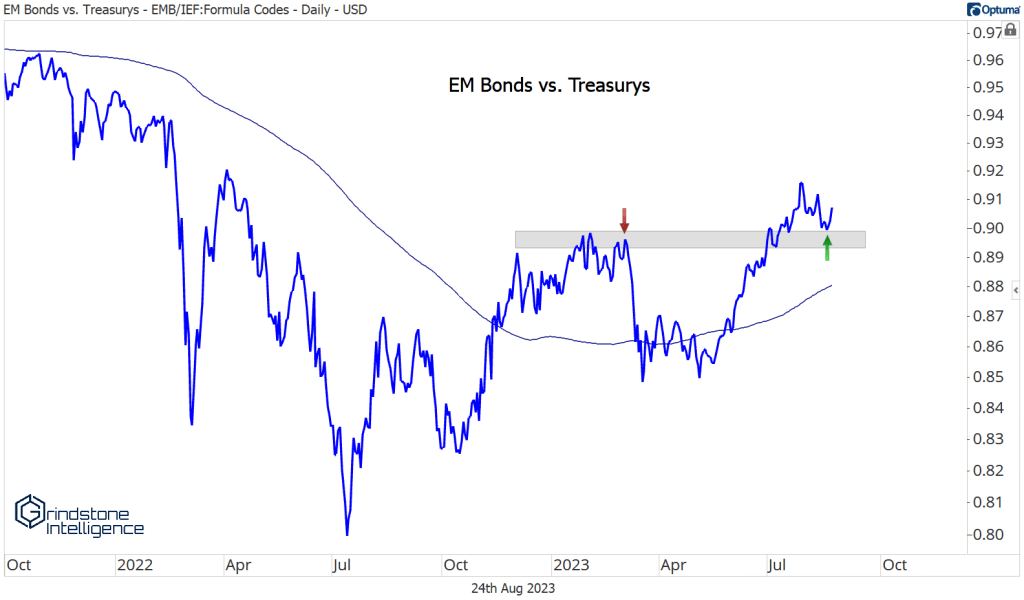
Emerging market bonds are breaking out relative to US Treasurys. Would investors be buying risky emerging market debt if they thought the economy was on the verge of collapse? We think not.
Credit spreads are just off of 1-year lows after fully erasing the post-SVB spike. Again, would credit spreads be contracting if investors were trying to avoid risk? No.

That puts us in contrast with the action we saw in markets last year. In 2022, interest rates were rising because inflation was out of control and it seemed inevitable that rate hikes would tip the economy into a recession. This time around, inflation is much more subdued, and we’re dealing with an ultra-resilient economy.
Bonds are breaking down and rates are seemingly backstopped by ramping economic activity. At the same time, credit rating agencies are downgrading US debt along with that of major banks. It’s no surprise that finding bond bulls has been pretty hard. That has our contrarian bone tingling.
In short, we think this is a good place to be buying some bonds.
Check out this failed breakdown in 30-Year Treasury bond futures:
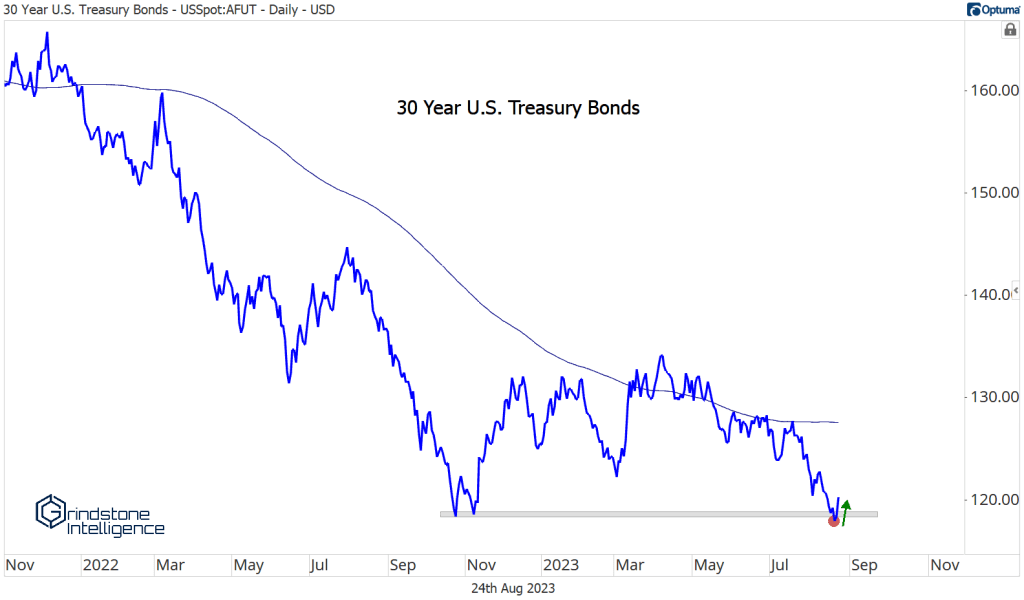
We like the setup in TLT, the iShares long-term Treasury ETF. We want to be buying down here near last year’s lows with a target of the year-to-date highs at $110. But we only want to be long if we’re above last year’s lows. If TLT is below $91.50, the consensus view is winning out, and we shouldn’t be betting against it.

Here’s what’s really catching our eye: the ratio of stocks to bonds (SPY vs. TLT). We used this chart to show investors’ preference for equities through the spring and summer.
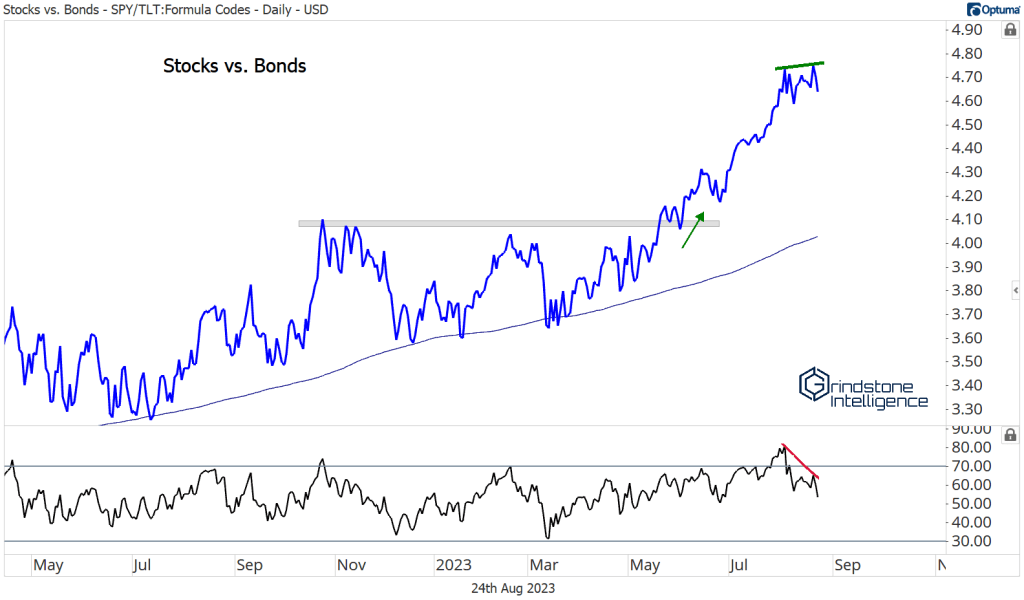
Now, we’ve got a massive bearish divergence shaping up. Momentum went from the strongest reading since 2016 at the beginning of August, to not event reaching overbought on the latest rally. That sets the stage for a big mean reversion in favor of TLT.
It’s time to buy some bonds.
Energy
We’ve been talking for the last month-and-a-half about how the bears fumbled their opportunity in oil. It’s only fair to call out the bulls for making the same mistake.
Bears were on the ropes when crude was above $82, but the buyers weren’t able to step in and deliver the finishing blow. Now, prices are rangebound once more. We’re leaning towards the belief that oil will resolve higher, but there’s no reason to have a strong opinion on the world’s most important commodity while we’re stuck between $73 and $82.

Similarly, Gasoline failed to break above an important resistance level. We’ve been using Fibonacci retracements from the 2020 decline to help identify these key levels. A failed breakout above the 216.8% retracement started this consolidation last year, and that’s where we just failed again. Like crude, we believe this resistance level will be surpassed in time. But there’s no reason to have a strong opinion as long as UGA is below $75.
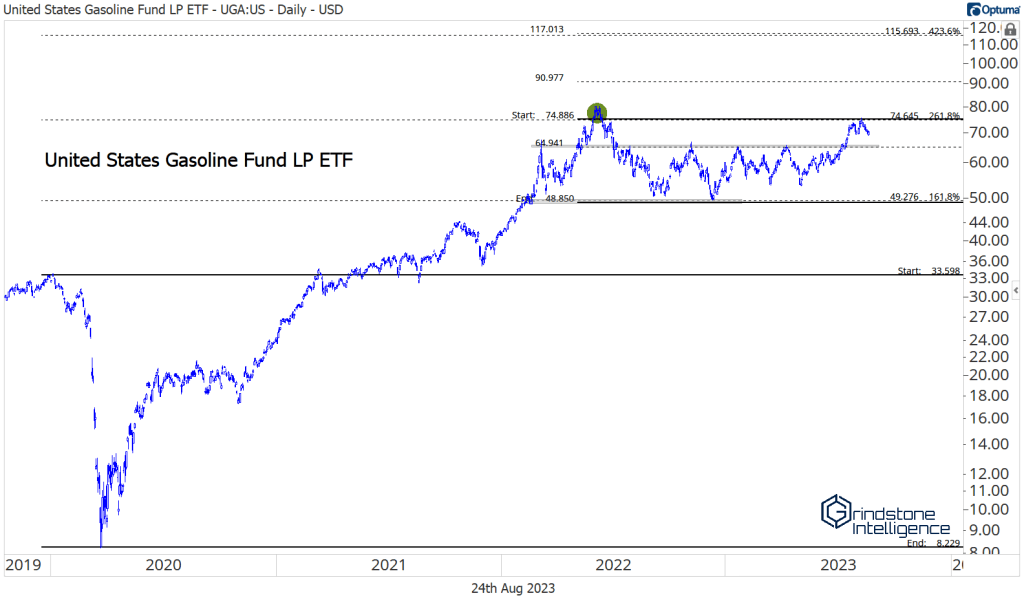
Since Fibs are fractal in nature, we can use a new retracement on recent action to identify shorter-term risk levels. The 61.8% retracement from last year’s decline sits at $65, and should act as support on any pullbacks. We’re also using the 161.8% retracement from that decline to set a near-term target of $90 on a breakout above $75.
Natural gas isn’t showing the same bullish characteristics as crude and gasoline. This one is best left alone.

While energy commodities try to gain some momentum, base metals are trying to stave off a break to new lows. For now, they’re doing a good job of that. Check out the Invesco DB Base Metals Fund bouncing off the former lows again this month:

It’s still not in an uptrend by any means, but at least we’re not seeing support get broken.
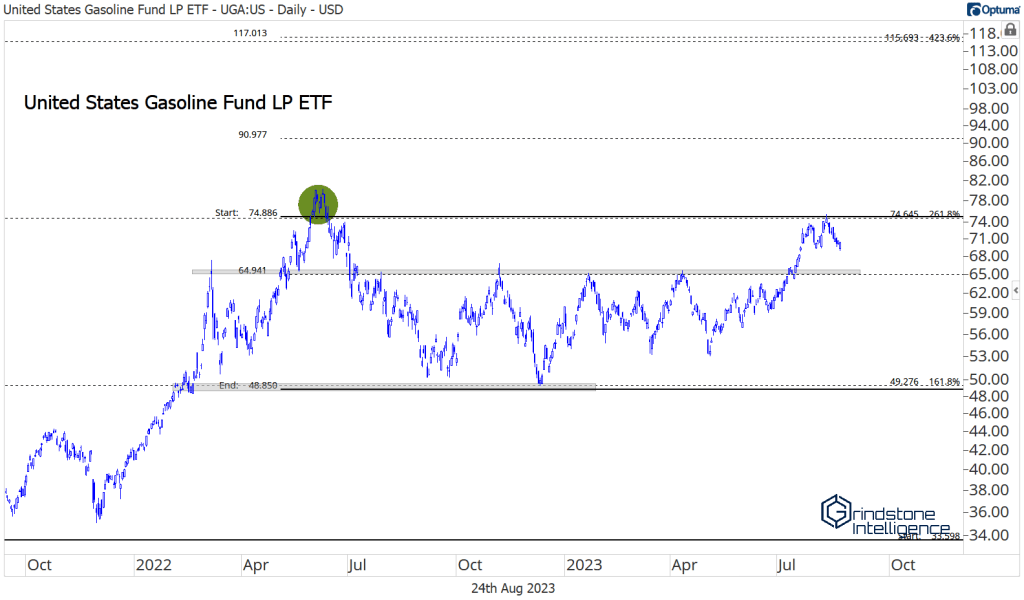
For more positive action, we’re going to need to see a bullish resolution out of copper. The metal with a PhD in economics isn’t yet buying the story of renewed economic strength (perhaps because growth in China and Europe isn’t showing the same vigor).
Copper’s doing its best to turn things around after struggling for most of this year, but it failed to stay above resistance on a breakout to start the month. We can only be bullish copper above $4.00.
Precious Metals
We keep waiting on silver to take a leadership role.
Prices for silver and gold tend to be highly correlated, but silver tends to move in greater magnitudes. As such, when precious metals are rising, we expect silver to outperform. That’s what we’ve typically seen during gold’s best runs. These days, silver refuses to lead.
Towards the end of last year, precious metals prices surged, with gold jumping from near $1600 to above $1800 by January. Similarly, silver jumped 30% from its October lows over that time. Gold prices continued to rise with the new year. Silver did not.
That divergence caused us to turn pessimistic on gold’s rally, and our concerns turned out to be well-founded. Gold and silver both dropped sharply in February. They’ve each recovered since then, but the Silver/Gold ratio is still struggling to gain ground. It’s battling the 2019 highs, which have marked a key rotational level for the past 4 years.
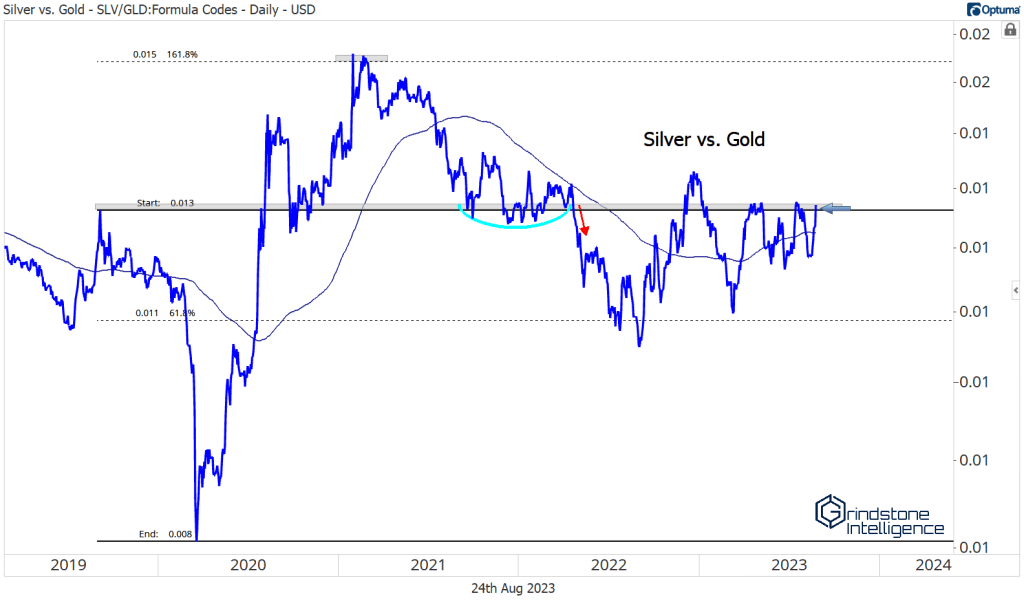
A relative breakout for silver would be a very positive development for both metals, in our opinion, so we’ll be watching this one closely in the coming days and weeks.
On its own, silver has strung together a handful of good days. There’s plenty of overhead supply to absorb, and the word ‘messy’ comes to mind when you see all the chop we’ve been dealing with for the past few years. Still, this isn’t a downtrend. If forced to choose, we’d err towards betting on higher prices.

Silver’s messy consolidation is mirrored by gold, which can’t seem to absorb all this overhead supply. Prices actually set incremental lows over the last few weeks – something silver didn’t do.
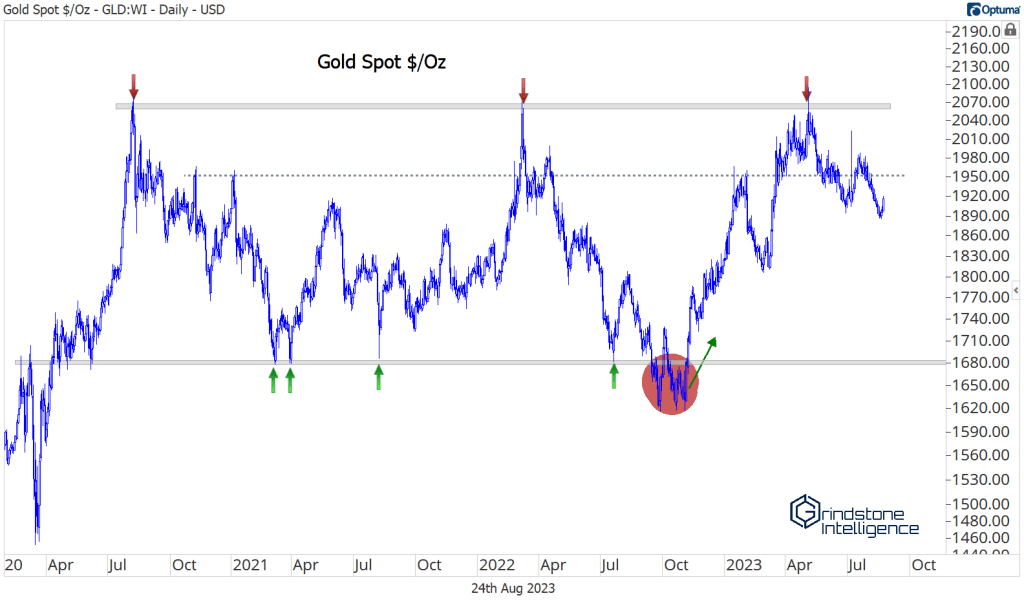
Buyers have stepped in over the past few days, though, and it happened at a pretty logical level. Here’s GLD (the SPDR Gold Shares ETF) finding support at the volume weighted average price from the September 26 closing lows:

We like the AVWAP because it shows the average buyer experience since that significant turning point last fall. That ‘average’ buying point has the same psychological impact of the highs and lows we usually identify as support and resistance on a chart.
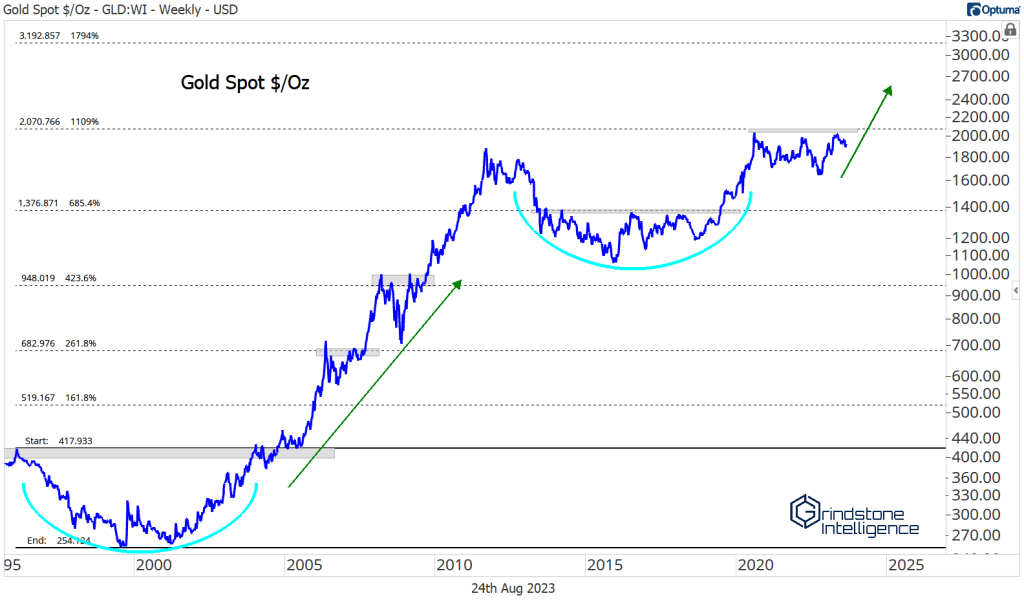
Maybe this time, a rally will be enough to get past the hump of those former highs. Each time buyers push prices up toward $2070, they absorb more overhead supply. At some point, there won’t be any sellers left. How high could the metal go on a breakout above $2070? We’re eying $3200. That’s the 1794% Fibonacci retracement from the 1990s decline. Prices have respected these retracement levels all the way up: The hiccups in 2006 and 2008 occurred near Fib levels, the ceiling from 2013-2019 was the 684.4% retracement, and right now, were stuck below the 1109% retracement. It would make a lot of sense to go up and touch the next one. $3200 might even be a conservative expectation – prices rallied a lot more after the 2004 breakout.
The Currency Landscape
Did you think we’d forgotten about that other familiar foe? The US Dollar is on track to close higher the sixth straight week.
We haven’t seen a run like that since 2021, and if the index rises again next week, it’ll be the second-longest streak of the century (surpassed only by the 12-week rise in 2014)
Dollar strength has been associated with weakness in equities for the past three years. Look how strong the negative correlation has been between the DXY and the SPX over that period.
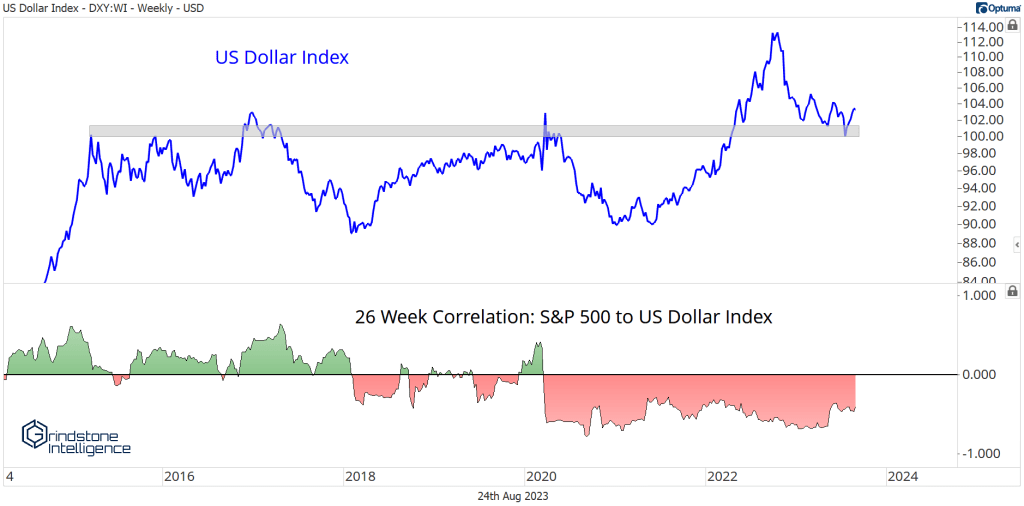
We can see how close that relationship was last year. Each time the Dollar rallied, stock prices fell. and each time the Dollar faded, stock prices rallied in relief.

For most of 2023, the Dollar has been rangebound, which was all the tailwind we needed for the S&P 500 to climb to new 52-week highs. The recent failed breakdown for the Dollar has restored the relationship.

Some Other Noteworthy Charts
A healthy dose of mid-summer rain across much of the Midwest in July pushed corn prices to multi-year lows. We’re eying a potential bullish momentum divergence that’s been shaping up over the past few weeks, though. Momentum failed to reach oversold territory on the most recent decline, which could spark a failed breakdown and a sharp reversal higher. That would accompany reports of struggling crops as the nation faces a brutal heat-wave.

Uranium is one of the best setups in the entire commodities space. URA has been consolidating above support for 2 years after it completed a long-term bearish-to-bullish reversal in 2020. We think URA can go back to the 2021 highs at $31. Longer-term, it could go much higher.

We’re using $24 as a risk-level for new entries – those are the swing highs from 2H2022 and from earlier this year. If we’re above that, we want to be long URA.

The Bitcoin rally is on hold. It might even be over.
Last week, BTC dropped to its lowest level in months after failing to absorb overhead supply from the 2021 lows. It’s now below the 200-day for the first time since January.

We have no reason to be long until Bitcoin is breaking out above that key resistance level. When/if it does, the risk/reward will be heavily skewed in our favor, and we’ll be targeting short-term move above $40,000. Right now, the best course of action is to just leave it alone – it could easily retest last year’s trough.
The post (Premium) FICC in Focus – August first appeared on Grindstone Intelligence.