(Premium) FICC in Focus: Gold Breakout on Hold, Dollar Bounces Back, Rates on the Rise
Once again, gold finds itself stuck below its former highs. Will the long-awaited breakout ever materialize?
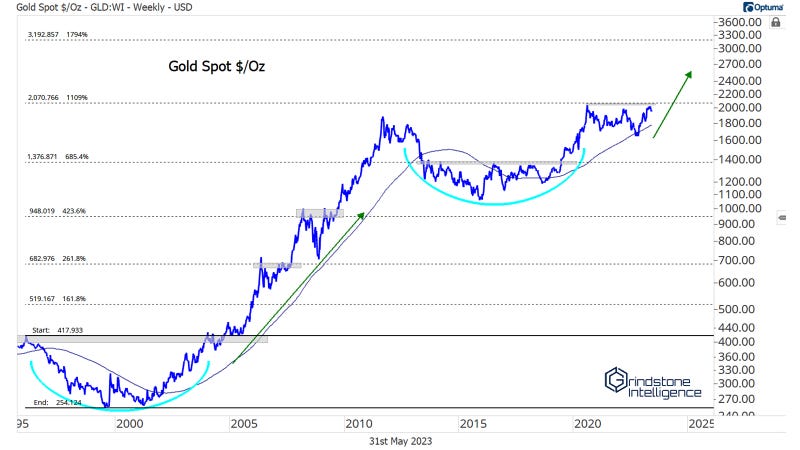
Just a few weeks ago, it looked as though gold would finally reach new highs. Alas, the breakout was not meant to be – at least not yet. May saw gold fail once again at 2100.
In the near-term, 1950 is the most important level. That price marked reversals in the fall of 2020 and again earlier this year. The principle of polarity suggests this former resistance level should now offer support, and bulls could make another run at those highs.
And each time buyers push prices up toward that resistance, they absorb more overhead supply. At some point, there won’t be any sellers left, and this consolidation should resolve in the direction of the underlying trend. How high could the metal go on a breakout above 2100? Above 3000. That’s the 1794% Fibonacci retracement from the 1990s decline. Prices have respected these retracement levels all the way up: The hiccups in 2006 and 2008 occurred near Fib levels, the ceiling from 2013-2019 was the 684.4% retracement, and right now, were stuck below the 1109% retracement. It would make a lot of sense to go up and touch the next one. That might even be a conservative expectation – prices rallied a lot more after the 2004 breakout.
None of that can happen with prices still just below resistance from those 2020-2022 highs. And if we fail to hang above 1950, gold could be stuck in this range for much longer.
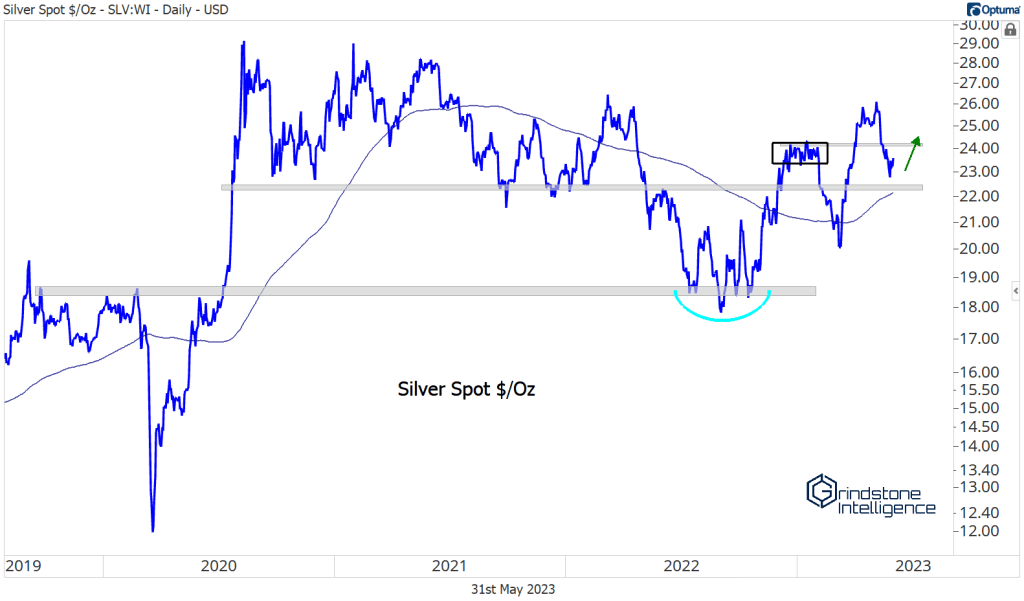
Silver is the thorn in gold’s side, dragging it lower on each rally attempt. Silver and gold tend to be highly correlated, but silver tends to move in greater magnitudes. As such, when precious metals are rising, silver should outperform. Instead, silver refuses to lead. Notice how the silver/gold ratio failed again at its 2019 highs last month at the same time gold was trying to breach 2100.
Silver’s relative weakness in January (black rectangle below) was the proximate cause of the February selloff in precious metals, too. Fortunately, this gives us a very clear technical level to work with. If silver is back above those January highs, we can approach the group from a more bullish stance, and we’ll be leaning toward new all-time highs in gold. But as long as silver is below 24, we need to stand on the sidelines.
Gold’s direction from here has big implications on asset allocation decisions, too. The SPX vs. Gold ratio is coiling up. Stocks are trying to break an 18-month relative downtrend line, and gold is trying to reach its best level since early 2021. Whichever way this pattern resolves, look for a big move.
We’ve already seen gold break out relative to copper. That only solidified an uptrend that had been in place since last summer.
Of course, gold’s relative strength has been more about the absolute weakness in copper. It’s at its lowest level of the year and appears poised to test last summer’s lows. For now, copper is stuck in a sideways trend – we can’t turn bullish unless it recovers above 4.00, but a bearish approach doesn’t make since either with prices in the middle of the 2H22 trading range.
We’d turn incrementally more negative on copper if its peers continue to show weakness. The Invesco DB Base Metal Fund is flirting with multi-year lows, thanks to weakness in aluminum and zinc. If those two continue dropping, we can’t expect copper to do the opposite.
Base metals are heavily influenced by economic activity. So is the price of energy. And oil prices are saying the same thing as copper: activity is weakening. Crude is stuck below a falling 200-day moving average and once again finds itself below $70 a barrel.
We don’t see a compelling reason to own oil right now (though an OPEC+ meeting this weekend could force us to change course).
Elsewhere in the metals space, Palladium is stuck in a clear downtrend. Check out that textbook polarity: Former resistance becomes support, then turns back into resistance.
What About Mr. Powell?
Remember when everyone thought the Fed was finished raising rates? Think again. Economic activity continues to be resilient, inflation remains stubbornly high, and financial conditions have loosened somewhat in the wake of the recent rally in stock prices. That’s given some FOMC members pause when it comes to their planned pause. Chair Jerome Powell opened the door for a stoppage in hikes at last month’s post-meeting press conference, but recent speeches indicate that a consensus is far from formed. Presidents Logan, Bullard, and Mester have all expressed a preference for more hikes this year and so have Governors Waller and Bowman. Meanwhile, Governor Jefferson and Presidents Bostic and Harker all favor holding rates steady at the June meeting. Larry Summers (who is not a Fed member, but nonetheless holds some sway in the economic community) believes rates will need to go at least 50 basis points higher this year to control inflation.
The result is that markets are increasingly pricing in a higher terminal rate. The 2-Year Treasury yield, which tends to be good proxy for the future path of the Federal Funds Rate, has jumped 0.75% from its May lows.
Treasury yields on the long end of the curve are rangebound. The 30-year yield is stuck between 3.5% and 4%. 10-year Treasurys, meanwhile, have put in a floor above last June’s highs. Structurally, it’s hard to argue that this is anything but a consolidation within a longer-term uptrend. We certainly don’t see evidence of a downtrend.
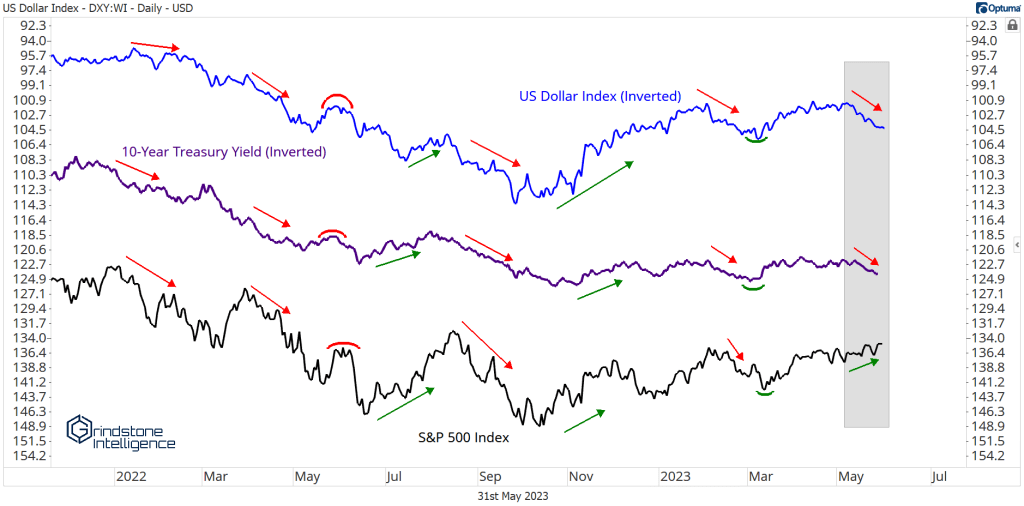
A move higher in yields could resurrect a familiar problem for investors. Throughout 2022, stocks, bonds, and the US Dollar were all highly correlated. Each time rates and the Dollar moved higher, equities responded by falling to new lows. When the Dollar peaked and rates stopped going up, that’s when the S&P 500 began to rally.
So what might happen if the DXY and rates find renewed strength? Apparently, nothing. The S&P 500 is shaking off the recent tightening, and set new year-to-date highs just last last week.
We can see clearly in the chart below how the relationship has changed. Last year – and especially last fall – the negative correlations were as strong as they’ve ever been. This year, we’ve seen those correlations disappear (Dollar vs. SPX) or completely reverse (10-Year vs. SPX).
We’re not sure that will last if we get major resolutions. For now, the DXY is range-bound between its 2015-2020 highs and the March peak. As long as that’s the case, we think the Dollar is a non-factor. If we see this consolidation resolve higher, though, don’t expect stocks to continue ignoring action in the currency markets. If the DXY is above 106, we need to be cautious.
Checking in on Crypto
The crypto landscape hasn’t changed much over the past few months. Bitcoin has been stuck between 18,000 and 30,000 for most of the last 14 months. We were bearish following the breakdown last November, but flipped our stance to a neutral position when prices surged back into the trading range at the start of the year. The level to watch is 30,000. If we’re above that, then we need to be approaching Bitcoin from a bullish perspective.
Longer-term, we’re using Fibonacci retracement levels from the 2017-2018 decline to define risk. Time and again, we’ve seen these levels mark key turning points, and we think they’ll continue to be relevant. 45,000 is be our initial target on a break above 30,000, and then we’ll be looking toward the all-time highs up near 70,000.
The post (Premium) FICC in Focus: Gold Breakout on Hold, Dollar Bounces Back, Rates on the Rise first appeared on Grindstone Intelligence.


