(Premium) FICC in Focus: Metals Meltdowns, Uninteresting Rates, and Some Eye-Catching Developments in Currencies
The Federal Reserve held rates constant at this month’s FOMC meeting, an unsurprising outcome after the latest CPI report showed price pressures continuing to moderate. The quarterly Summary of Economic Projections showed that the median Fed participant sees two more quarter-point hikes by year-end. That would imply a terminal rate of 5.50%- 5.75% for this cycle, and the highest Fed Funds rate in 20 years.
Jerome Powell spent this week reinforcing his view that more hikes are on the way, but the recent decision to not raise rates after doing so at every meeting for more than a year is a clear signal that this hiking cycle is nearing its end. Modest changes to the terminal rate aren’t the same as what happened in 2022, when the Fed went from talking about one 0.25% hike at year-end, to implementing the fastest tightening cycle in 40 years. Here’s a brief recap of the timeline for those that have blocked last year’s turmoil from their minds:
Of course, inflation could always surprise us by reaccelerating. (We aren’t economists, after all, and, even if we were, we’d probably be terrible at predicting the path of future activity. The latest GDP report proved that even predicting the past can be quite perilous.) If it does, the Fed may well respond by tightening policy to a level that no one expects.
For now, the market is discounting the likelihood of that scenario. Inflation was a problem for asset prices last year because higher inflation meant higher interest rates, and higher rates meant a stronger US Dollar. We shared with our subscribers many times an overlay of Treasury yields, the US Dollar Index, and the S&P 500 index, pointing to how tightly correlated the 3 were.
But long-term interest rates peaked last year, around the same time that equity markets bottomed (and when CPI less shelter dropped to normalized levels). The market’s expectations of the Fed’s terminal rate hasn’t changed much since then either.
Now that long-term rates have stabilized, they’ve stopped impacting equity returns. The correlation between interest rates and stocks has reverted to a pre-COVID normal.
This new era of high and stable interest rates is a welcome sight for holders of fixed income. But for those looking for price appreciation, bonds aren’t very attractive at all. The ratio of stocks vs. bonds has broken out above its October highs.
Bonds are underperforming gold, too. This ratio of GLD to TLT recently broke out of a 10 year base.
For bonds to once again be attractive from a capital appreciation perspective, interest rates will have to break lower from their current consolidation ranges. The thing most likely to trigger that? Recession.
And the yield curve says a recession is on its way.
Normally, longer-dated bonds yield a higher rate of interest to their holders. Sometimes, though, those term premiums turn negative, resulting in an inverted yield curve. And each time that’s happened over the last 50 years, a recession has followed. Few economic indicators have a better track record.
Some economists have tried to downplay inversions as a forecasting tool in recent years, pointing to experimental central bank policies that have distorted market prices. They made the same argument when the curve briefly inverted back in 2019. A recession followed anyway. True, that recession was caused by a global pandemic and economic shutdowns, not a credit crunch, but we still don’t have a historical case of the economy avoiding recession after an inverted curve.
And right now, the curve is more inverted than it’s been in decades.
To be clear, this tool has a great record when it comes to forecasting recessions. It’s just not so good at timing them. On average, inversions have preceded recessions by about 18 months. Excluding the 2019 occurrence, which was disrupted by COVID, that average grows to 21 months. But the range of outcomes has been wide. The six recessions since 1978 have begun in as few as 11 months (1981) or as many as 34 months (2001) after the yield curve first signaled that something was awry.
We’re currently at the 12-month mark. An average outcome implies that recession will begin early next year. But there’s also precedence for a recession that doesn’t start until 2025! Yes, a recession could very well be on its way. But we need to look elsewhere for confirmation.
We’re not seeing signs of economic stress in credit spreads. When the outlook turns dour, corporate yields should rise relative to risk-free Treasury yields. We can see that relationship clearly in the past 3 recessions, and even during scares that didn’t evolve into outright economic declines, like the 2011 European debt crisis, and the manufacturing downturn in 2015-2016. If a recession is imminent, credit spreads should be rising.
Right now, credit spreads are trending lower. They peaked last October, and failed to set a new high even during the spring banking crisis.
The bond market is discounting near-term economic malaise. That, coupled with current trends in stock prices, indicates we should be underweight fixed income until the trend in interest rates shifts.
Currencies
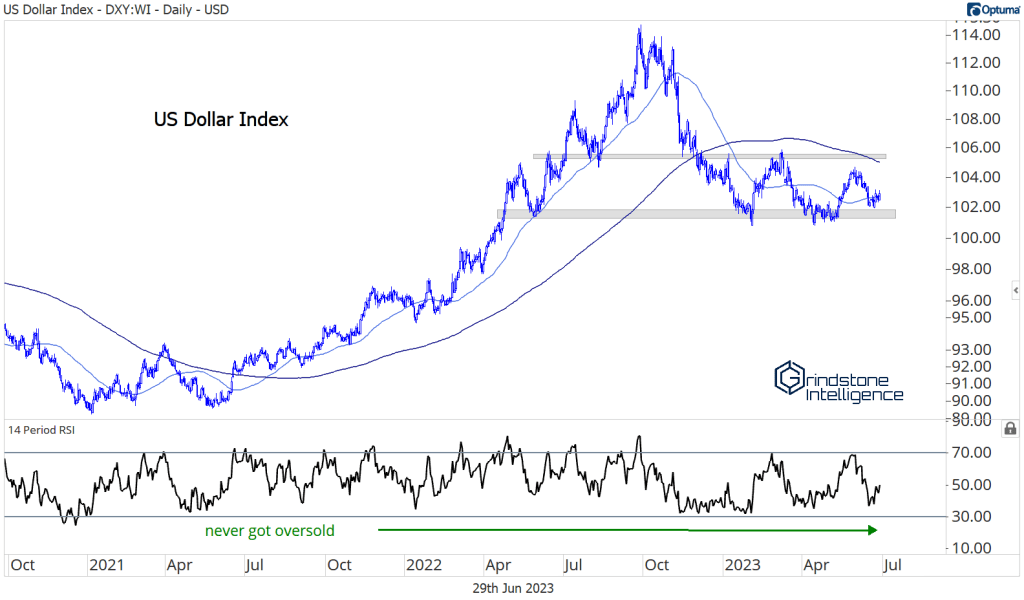
Like interest rates, the US Dollar was a major headwind for stocks last year. Each time the Dollar moved higher, equity prices dropped to new lows. The US Dollar Index peaked last September, and shortly afterward, stock prices set their bear market low. Just like with interest rates, the correlation between the Dollar and stocks has disappeared now that currency moves have stabilized.
The DXY has been rangebound since the start of the year. It sits atop a flat 50-day moving average, midway between support and resistance. In other words, there’s no trend to be found over a shorter-term timeframe.
Longer-term, though, the Dollar’s uptrend is still intact. Momentum stayed out of oversold territory throughout the entirety of the pullback, and the index is above 100, which was formerly stiff resistance from 2015 to 2020. That level is now acting as support.
Beneath the surface of the Dollar Index (which is heavily weighted towards the Euro), we’re seeing strength relative to Asian currencies – especially against the Chinese Renminbi. The Yuan has lost 8% of its value since mid-January, and the cross is breaking back out above its 2019 highs. Last October, a similar breakout turned into a failed move. But not all failed moves result in long-term trend reversals, and neither did this one. We don’t want to be betting on China as long as USD/CNY is above 7.15
The Japanese Yen has been similarly weak. It’s lost 12% of its value since mid-January. This chart is a good example of why we don’t put much faith in traditional ‘patterns’. Our brains as humans can’t help but draw them, but our brains are easily fooled. It looked like a classic head-and-shoulders top. Instead, the consolidation resolved in the direction of the underlying trend. (This, we think, is why many traditional technical analysis patterns have such poor track records. Most are reversal patterns, when, by nature, trends are always more likely to persist than to reverse.) In any case, the Dollar has found renewed strength vs. the Yen.
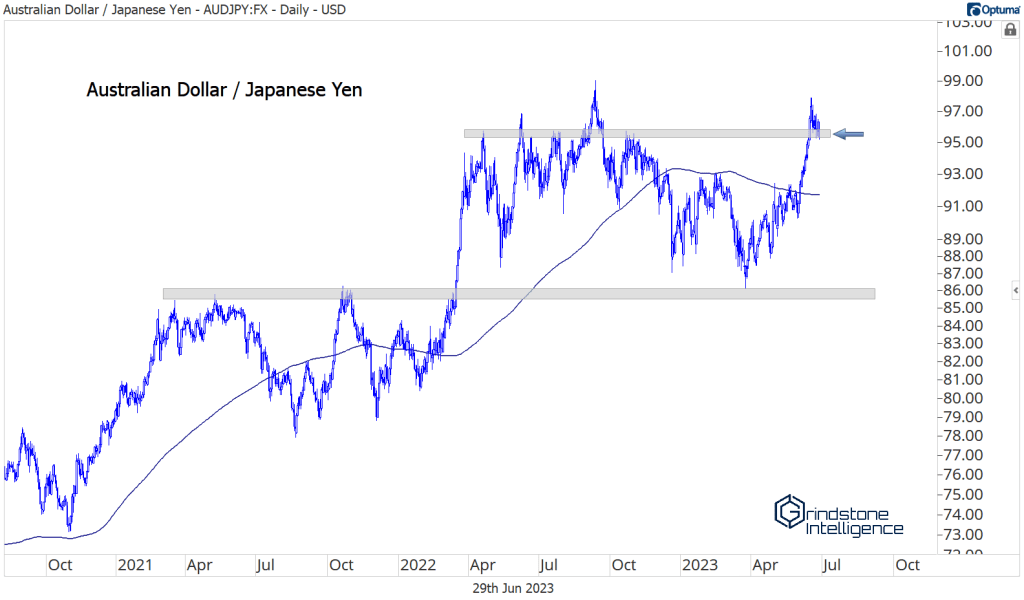
Elsewhere in the land of currencies, the AUD/JPY cross caught our eye. The Australian Dollar is knocking on new highs relative to the Yen after a year-long consolidation above support. The AUD is considered a risk-on commodity currency and the Yen a safe haven. As such, this cross tends to move with global commodity prices.
A successful breakout would be quite telling.
Commodities
If commodities are to return to their form, it has to start with the most important commodity out there: crude oil.
Crude has been hanging between 65 and 80 all year, frustrating buyers, but failing to really reward the bears. Support continues to hold at 67. The more times a level is tested, the more likely it is to break. Oil, though, seems intent on proving everyone wrong. We’d rather not own it until a clearer uptrend is established, which would require a move above 82. Rangebound, choppy markets aren’t our cup of tea.
A break below 67 would certainly catch our eye. This level near 70 has some memory, going back to the 2018 highs. If crude is definitively below that area of support, we’d want to be erring towards the bearish side. It could easily drop back toward 55.
There’s good reason to believe that this support level will continue to hold, however. Check out the Invesco DB Energy Fund, DBE. It’s found some buyers at a key former resistance level, which marked major turning points in 2015, 2018, and 2021. This would be a logical place to initiate a rally.
Natural Gas could be the trigger. Nat Gas has been a terrible place to be for US investors – UNG just hit its lowest levels ever.
We don’t want to be blindly buying things that are stuck in deep, protracted downtrends, but UNG is putting together an impressive resume for a potential reversal. Momentum is working on a bullish divergence and prices are setting higher highs on rallies. If this turns into a failed breakdown and UNG moves back above 9.00, we could be in for an explosive move higher. A double or triple wouldn’t be out of the question. Let’s not get ahead of ourselves, though. We absolutely can’t own this thing below 9.00.
Copper is stuck below resistance, mirroring recent struggles in energy. The high water mark in November and December acted as support throughout the spring. But when copper fell back below 4.00 in April, the picture darkened considerably. The weakness flew in the face of what should have been happy news: the long awaited reopening of the Chinese economy.
Instead, China’s rebound has been lackluster, and Dr. Copper’s reputation as an economic forecaster remained untarnished. We don’t want to own copper below 4.
However, the setup there isn’t that clean for shorts.
It’s much better in the Invesco Base Metals Fund. With copper below 4 and break below 17.40 in the DBB, we can be betting on lower prices for DBB with a target down near 15.50. If either copper or DBB are above our risk levels though, we don’t have a reason to be betting against either one.
Precious metals haven’t fared any better. In fact, Palladium has fared quite a bit worse. It’s now at its lowest level since 2018, and any bounce will be resolutely contested by a key rotational level just below 1600. We want to be selling Palladium on any rallies.
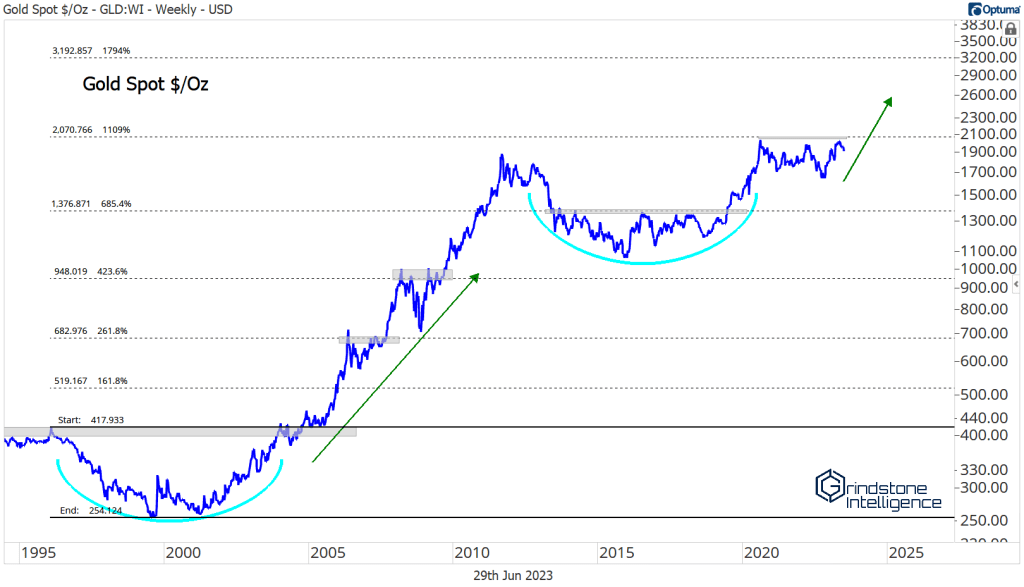
Palladium’s collapse foretold another failed breakout attempt for gold. Not only did gold get rejected at the former highs, it’s now fallen below 1950, a level we believed the bulls needed to hold if they were going to make another near-term run.
Each time buyers push prices up toward 2100, they absorb more overhead supply. At some point, there won’t be any sellers left, and this multi-year consolidation should resolve in the direction of the underlying trend. How high could the metal go on a breakout above 2100? Above 3000. That’s the 1794% Fibonacci retracement from the 1990s decline. Prices have respected these retracement levels all the way up: The hiccups in 2006 and 2008 occurred near Fib levels, the ceiling from 2013-2019 was the 684.4% retracement, and right now, were stuck below the 1109% retracement. It would make a lot of sense to go up and touch the next one. That might even be a conservative expectation – prices rallied a lot more after the 2004 breakout.
None of that can happen with prices still below resistance from those 2020-2022 highs. And if we fail to get back above 1950, gold could be stuck in this range for much longer.
Silver has been a thorn in gold’s side, dragging it lower on each rally attempt. Silver and gold tend to be highly correlated, but silver tends to move in greater magnitudes. As such, when precious metals are rising, silver should outperform. Instead, silver refuses to lead. Notice how the silver/gold ratio failed at its 2019 highs at the same time gold was trying to breach 2100.
On an absolute basis, silver is working hard to find some support at the 2021 lows, which coincide with the metal’s rising 200-day moving average. Holding above 22.50 would be a step in the right direction, but at this point, we’d need to see a jump above 27 and some relative strength before we’d be convinced a longer-term trend was in place.
If the breakout in gold ever comes, we don’t want to miss out. We’re watching it closely. In the meantime, the opportunity cost of holding gold while we wait for a potential move is simply too high.
Earlier this year, it looked as if gold would continue to outperform stocks as it set multi-year relative highs compared to the S&P 500 index. But gold fumbled its chance, and now equity bulls have the upper hand. We want to be owning more stocks right now, not more gold.
One of the few places in commodities that’s performed well has been agriculture. The Invesco DB Ag fund resolved higher from an 8-month base earlier this year, and accelerated in June to 52-week highs. It’s given quite a bit of that move back, but we’re still above the breakout level.
Sugar has been one of the leaders. It broke out to 10-year highs in April, then climbed another 13%. In the last week and a half, though, it’s given all that back and more. Sugar is back below its 2016 highs. We can’t be long unless it recaptures that level.
And it certainly could. Live Cattle futures did the same thing earlier this year. They broke out, failed to hold the move, and then quickly recaptured the highs.
Uranium might be the single best setup in the entire commodities space. URA has been consolidating above support for 2 years after it completed a long-term bearish-to-bullish reversal in 2020. Our risk here is very clearly defined for URA: we don’t want to own it if it drops below 18. But if we’re above that, we think URA can go back to the 2021 highs at 31. Longer-term, it could go much higher.
We still aren’t sure where to house cryptocurrencies in these reports. Do they belong with commodities like gold and silver? With currencies like the US Dollar and the Euro? Fortunately, the regulators don’t seem to know what to do with them either.
Bitcoin is making a case to be featured more prominently in our work, so we’ll have to figure that out. For the last year, we’ve had no good reason to focus on it, since prices were stuck below overhead supply at 30,000, and above support at 18,000. Now, Bitcoin is testing the upper-end of that range in earnest, and, with momentum in a bullish range, looks ready for a breakout.
We want to be buying BTC on a break of the April 2023 highs, with a target of 44,000. That level is the 261.8% retracement from the 2017-2018 decline. You can see how much prices have respected these Fib levels in the past, so we think they’ll continue to respect them going forward. If Bitcoin blows right past that potential resistance level, don’t be surprised if it climbs all the way to new highs.
The post (Premium) FICC in Focus: Metals Meltdowns, Uninteresting Rates, and Some Eye-Catching Developments in Currencies first appeared on Grindstone Intelligence.


