(Premium) FICC in Focus – September
What do we want to own?
That’s the question we ask ourselves every day. Stocks? Bonds? Commodities? Crypto? Cash? The answer doesn’t have to be like flipping a light switch. It’s not like we want to be all in on stocks on Monday, then all in on Treasurys by Tuesday afternoon. Instead, the answer to “What do we want to own?” evolves slowly over time. Our minds gradually change as new evidence comes in, and our decisions follow those slowly-formed opinions.
Stocks have been the place to be since last fall. There’s not much argument about that. In recent weeks, though, the tide seems to have turned in favor of other asset classes. Commodities are leading the way. Check out the ratio of the Invesco DB Commodity Fund (DBC) vs. the S&P 500 below. We’ve broken the downtrend line, momentum just reached overbought territory for the first time all year, and the ratio crossed above the 200-day moving average. It’s a bit early to definitively call this the start of a new uptrend, but at the very least, this year-long downtrend has weakened considerably.
The strength in DBC began with a successful retest of the October 2021 highs back at the end of May. Since then, price has set a series of higher highs and higher lows, recapturing the 200-day along the way.
It’s pretty clear which commodities are leading the charge. Check out the weekly Relative Rotation Graph below, where we’re comparing 4 commodity funds – Energy, Agriculture, Base Metals, and Precious Metals – to the overall commodities space. It’s all about Energy. Energy is in the ‘Leading’ quadrant, while the other three are all mired in the ‘Lagging’ one.
Energy
Thank the rally in crude oil that began after bears failed to capitalize on a May breakdown. Since then, crude has jumped more than 40%, including gains in 10 of the last 12 weeks. This area near $92 was resistance in the fourth quarter of last year, though, and we’re seeing sellers step in here again. That could very well mean the rally has run its course. Or it could just be that we’re taking a breather before we begin another leg higher. Notice how momentum just got more overbought than at any time since prices peaked in early 2022? That’s not something you typically see during a protracted downtrend.
What’s more, the 50-day moving average recently crossed above the 200-day, an indicator commonly referred to as a ‘Golden Cross.’ The Golden Cross has a mixed historical record (like all indicators do). It’s had a fair track record when it comes to oil prices over the last 15 years, though. In the chart below, the green areas are when the 50DMA > 200DMA, and red is when the 50DMA < 200DMA. You can see how well the moving average indicator catches the big uptrends and misses the most severe drawdowns. Where it runs into trouble is when prices are rangebound, like they were from 2011-2014 and 2018-2019.
The question is, are we in a choppy, rangebound market for crude? Or a new uptrend? In either case, we don’t want to be short from any sort of intermediate-term perspective.
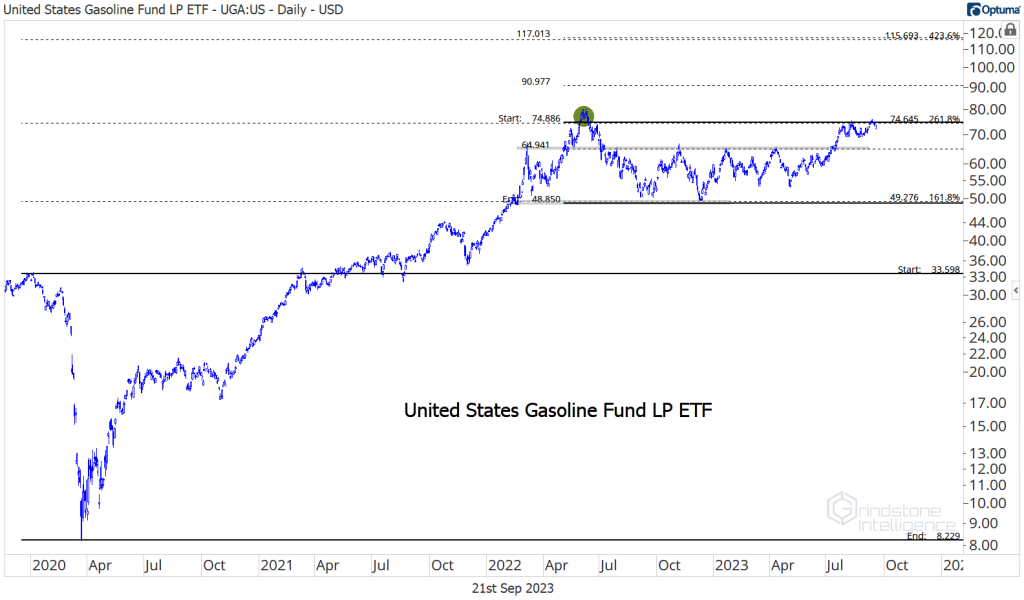
We might get our answer from gasoline prices first. We’ve been using Fibonacci retracements from the 2020 decline to help identify key levels in the US Gasoline Fund (UGA). A failed breakout above the 216.8% retracement started a consolidation last year, and prices have been struggling with resistance at that level again in recent weeks.
Since Fibs are fractal in nature, we can use a new retracement on recent action to identify shorter-term risk levels. The 61.8% retracement from last year’s decline sits at $65, and should act as support on any pullbacks. We’re also using the 161.8% retracement from that decline to set a near-term target of $90 on a breakout above $75. A sustained breakout would act as confirmation of the new uptrend in crude oil. However, UGA has to deal with this bearish momentum divergence first.
Base Metals
Commodities, more so than other asset classes, move in response to changes in supply and demand. Crude’s summer strength has bucked concerns about weakening demand from slow growth in China. Instead, it’s been a supply story, as significant production cuts from OPEC and its allies have pushed the global oil market from surplus into deficit.
Base metals are often correlated with oil, since the demand drivers for the two commodities are very similar. But since oil’s rally this time around has been supply-driven, base metals aren’t seeing the same benefit. DBB is hovering near multi-year lows.
The DBB is comprised of three metals: Copper, Aluminum, and Zinc.
Copper was the first to bottom last July, and looked to be a leader in the early days of the year. Unfortunately, China growth concerns came to the fore around that time, and prices have given back most of the gains. Now, copper is testing the uptrend line from last summer’s trough.
Aluminum bottomed last fall and has followed the same path in 2023. On the bright side, buyers have stepped in at last year’s lows and prices just broke the year-to-date downtrend line.
Zinc, meanwhile, has been the worst performer. It fell to multi-year lows in the spring and is pretty clearly still within the midst of a downtrend. A break above the July highs would be a step in the right direction, though, and would probably coincide with strength across the base metals space.
Precious Metals
Within the precious metals space, we’re still waiting on silver to take a leadership role. If we sound like a broken record… sorry? The broken record has saved us from some serious heartache over the last 6 months. And if the broken record ain’t broke, don’t fix it.
Prices for silver and gold tend to be highly correlated, but silver tends to move in greater magnitudes. As such, when precious metals are rising, we expect silver to outperform. That’s what we’ve typically seen during gold’s best runs. These days, silver refuses to lead.
Towards the end of last year, precious metals prices surged, with gold jumping from near $1600 to above $1800 by January. Similarly, silver jumped 30% from its October lows over that time. Gold prices continued to rise with the new year. Silver did not.
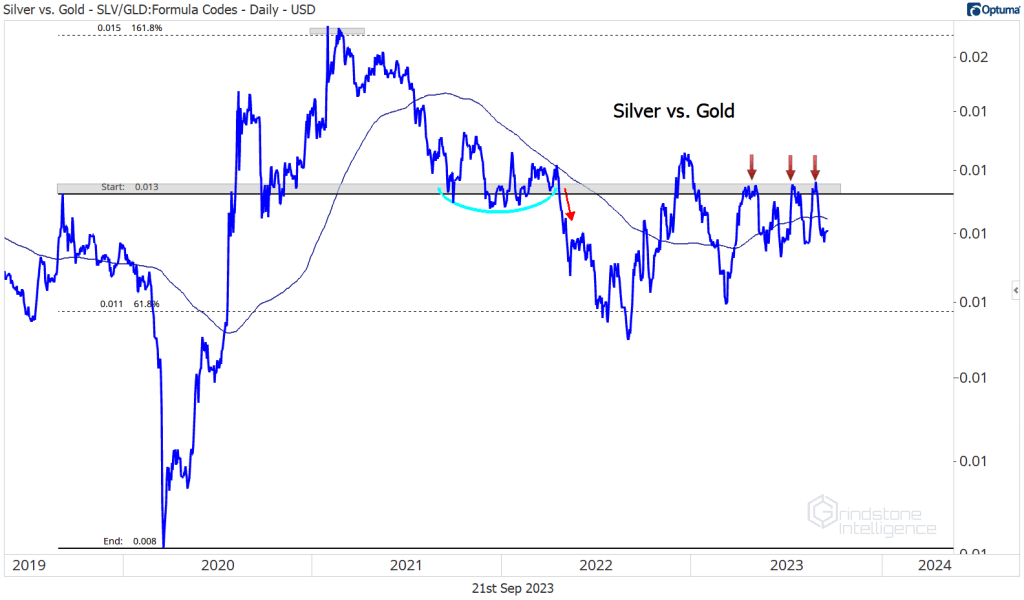
That divergence caused us to turn pessimistic on gold’s rally, and our concerns turned out to be well-founded. Gold and silver both dropped sharply in February. They’ve each recovered since then, but the Silver/Gold ratio is still struggling to gain ground. It’s battling the 2019 highs, which have marked a key rotational level for the past 4 years. We failed there again last month.
An eventual relative breakout for silver would be a very positive development for both metals, in our opinion, so we’ll be watching this one closely in the coming weeks and months.
On its own, silver at least hasn’t gotten any worse. There’s plenty of overhead supply to absorb, and the word ‘messy’ comes to mind when you see all the chop we’ve been dealing with for the past few years. Still, this isn’t a downtrend. If forced to choose, we’d err towards betting on higher prices.
Silver’s messy consolidation is mirrored by gold, which can’t seem to absorb all this overhead supply. This isn’t a downtrend, but it’s not an uptrend either. There’s just not much reason to be involved unless/until we see some sort of resolution.
If that bullish resolution does come, how high could gold go? We’re eying $3200. That’s the 1794% Fibonacci retracement from the 1990s decline. Prices have respected these retracement levels all the way up: The hiccups in 2006 and 2008 occurred near Fib levels, the ceiling from 2013-2019 was the 684.4% retracement, and right now, were stuck below the 1109% retracement. It would make a lot of sense to go up and touch the next one. $3200 might even be a conservative expectation – prices rallied a lot more after the 2004 breakout.
Keep an eye on Palladium, too. This bullish momentum divergence that’s shaping up isn’t much, but it’s something.
Agriculture
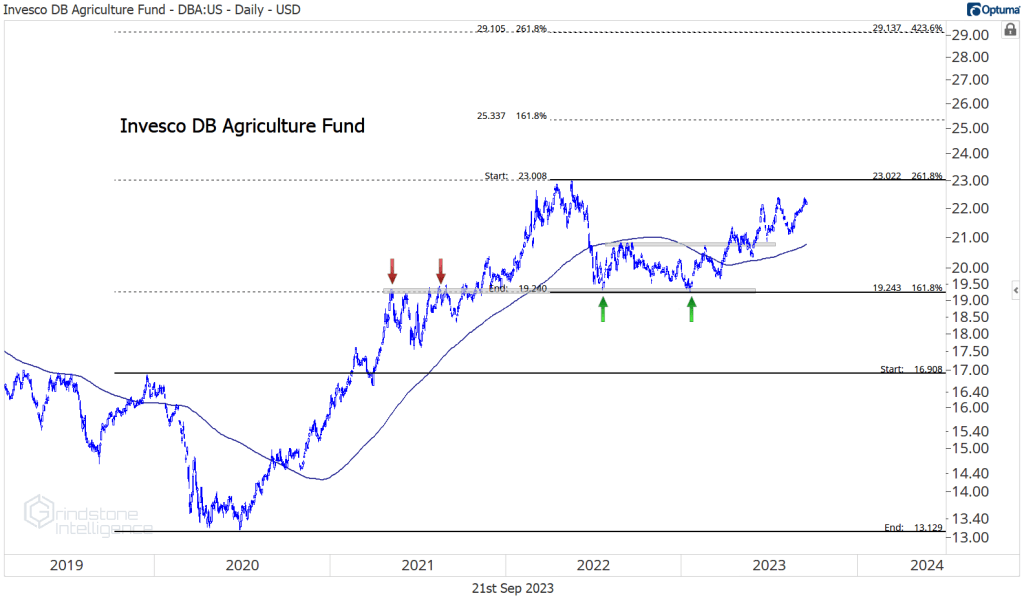
The Ags have been a pleasant surprise for investors throughout 2023, steadily rising even throughout the first half of the year while other commodities were fading. The Invesco DB Agriculture Fund (DBA) has stalled out since the end of June, but structurally, this is still a consolidation within the context of a longer-term uptrend.
Within the Ags, how can we not mention Orange Juice? Those Duke brothers are out of control.
We acknowledged in July how crazy it was to be talking about a $400 target for OJ, but all it does is keep going up. It seemed a bit crazy to target $280 on the initial breakout last fall, too, but here we are. That $400 target is the 261.8% retracement from the entire 1990-2020 range. It may sound crazy, but sometimes prices do crazy things.
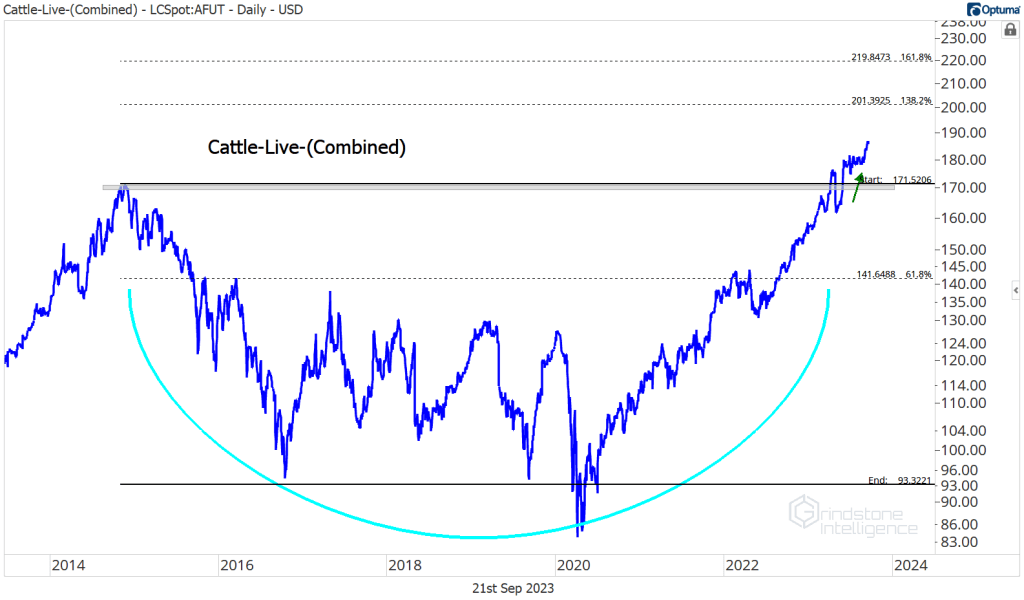
Cattle prices continue to break out, too. It’s frustrating for those of us just trying to buy a couple of ribeyes every now and then, but, alas, complaining about higher prices at the grocery store doesn’t change reality. We’ve been looking for a move to $200, which is the 138.2% retracement from the 2015-2017 decline.
On the other side of the trend, we’ve been watching for a potential bullish reversal in corn. A healthy dose of mid-summer rain across much of the Midwest in July pushed corn prices to multi-year lows. Momentum failed to reach oversold territory on the most recent decline, though, creating a bullish divergence that could spark a failed breakdown and a sharp reversal higher. We’re not crop specialists, but we do follow people that are. They’re saying a bullish catalyst could come from more rain. At this point, more rain doesn’t do much to improve the crop – it only delays the harvest.
Currency
It’s a bit of a travesty that our talk of currencies has been relegated to the bottom half of this report. After all, is there anything more important than the US Dollar these days? We’re on pace for the 10th straight week of gains for the US Dollar Index, a feat matched only once (2014) in the history of the index. And for the last few years, the Dollar has had a strong negative correlation with stocks.
We can see how close that relationship was last year. Each time the Dollar rallied, stock prices fell. and each time the Dollar faded, stock prices rallied in relief. For most of 2023, the Dollar was been rangebound, which was all the tailwind we needed for the S&P 500 to climb to new 52-week highs. But the sharp rally in the DXY over the last 10 weeks has restored last year’s relationship.
So what’s next?
In our August technical outlook, we highlighted the resistance area near $105 for the US Dollar. A move above that level, we said, would force us to reevaluate a lot of our opinions about the market. Now that we’re here, we’d be surprised if we just blow right past $105 without any trouble – but we were pretty surprised to see 9 (and maybe 10) straight weeks of gains, too.
The Euro cross comprises a bulk of the Dollar Index, so it’s not surprising that the EUR/USD and the DXY look pretty much the same (assuming you flip one on its head of course). For the EUR/USD longer term, the level is 1.05. If we’re below that, then news agencies will start talking about ‘parity’ again, and the Dollar’s recent rally will get a lot more attention.
However, the Dollar is already back to last year’s highs if you look at some of its Asian counterparts. In China, the government is working overtime to stabilize a real estate crisis and stimulate faltering economic activity while keeping their currency from falling out of bed. With the Yuan already at its weakest level in 15 years, they have limited options.
And against the Japanese Yen, it’s been all higher highs and higher lows since the January bottom. The Bank of Japan, under the relatively new leadership of Governor Ueda, is unlikely to change short-term interest rate targets at this week’s meeting, as they monitor an increasingly fragile economy. However, Ueda may give further clarity on future plans to end negative interest rate policy. He’s already taken steps toward that end, including raising the cap on long-term interest rates in July, which the BOJ hoped would improve liquidity in that market. Those moves to normalize policy haven’t helped to stem the currency’s bleeding, but a hawkish shift while the Fed, ECB, and BOE are all pivoting toward rate pauses could change the narrative around the Yen.
We’re also keeping our eye on another cross with the JPY. The Australian Dollar is knocking on new highs relative to the Yen after a year-long consolidation above support. The AUD is considered a risk-on commodity currency and the Yen a safe haven. As such, this cross tends to move with global commodity prices. A resolution higher would indicate risk appetite in the currency markets.
Fixed Income
It’s not just the Dollar that’s a problem for stock prices. Rising interest rates haven’t been helpful either.
Each time interest rose last year, the S&P 500 fell. And each time rates offered a reprieve, stocks rallied in relief. Unsurprisingly, the stock market bottomed around the same time that interest rates reached their peak last fall. With 10-year Treasury yields stabilized, we saw stocks scream for the first half of 2023.
But now rates are trying to start another leg higher. A reacceleration in growth expectations is the culprit. The Atlanta Fed’s GDPNow is tracking at nearly 5% growth for the third quarter, far higher than where the Blue Chip consensus began the quarter, at roughly 0%. Strong consumer spending is the biggest driver of the rebound, but every subcomponent is contributing.
Better-than-expected growth has the Fed looking at higher-than-expected rates next year. In June, the FOMC projected 100 basis points of rate cuts next year. In the September SEP, they cut that number in half.
Don’t be fooled into thinking the Fed has to stick to these projections. The median estimate implies a level certainty that doesn’t exist. Check out the range of estimates for 2025: the most hawkish FOMC member sees rates above 5.5% by then, while the most dovish sees them down near 2.5%. Even in a committee often derided for groupthink, there’s nothing that remotely resembles a consensus about what the future will look like.
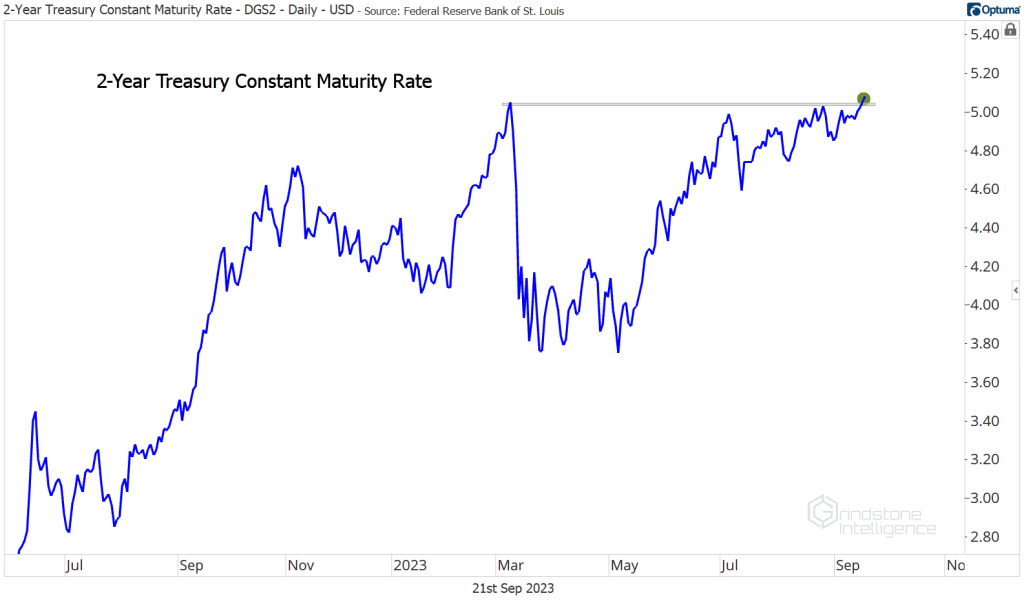
In any case, markets are responding to the risk of more action from the Fed. The 2-year Treasury yield, which tends to be good proxy for the future path of the Federal Funds Rate, just reached new cycle highs. That means we’ve fully erased the scare that came with the SVB failure in March.
It’s not just the short end, either. Rates are moving higher across the curve. Ten year Treasurys this morning are at their highest levels since 2007.
Thirty year yields are breaking out, too.
The risk with tighter Fed policy, of course, is that the Fed will do what it almost always does. They’ll push the economy into a recession. With clear risks on the horizon – student loan payments resuming, a potential government shutdown, labor strikes – perhaps the Fed has already gone too far?
The bond market would disagree with that notion. If bond investors were truly concerned about recession, would they be pushing credit spreads to their lowest level in a year?
Would they be going out the risk spectrum and buying emerging market bonds instead of Treasurys? Probably not.
Of course, the market isn’t infallible. It’s entirely possible that the long-awaited recession is on the horizon – that consumer spending will fall off a cliff, that activity will grind to a halt, bankruptcies will start to climb. In that case, will inflation still be a problem and will the Fed still be thinking about higher rates for longer? We don’t know, but we think the narrative could change pretty quickly.
That’s why we’re keeping our eye on the stocks vs. bonds ratio. Momentum for the ratio has stalled out since June, setting the stage for a potential reversal in favor of the bonds. And if this week’s move higher in interest rates reverses course? Well, you know what they say about failed moves: from failed moves come fast moves in the opposite direction.
One more to watch
Uranium is one of the best setups in the entire commodities space. Perhaps it’s not fair to include URA in this report, since it technically tracks a group of companies with Uranium-related operations. But bullish setups are worth highlighting no matter their composition.
URA has been consolidating above support for 2 years after it completed a long-term bearish-to-bullish reversal in 2020. We first pointed this one out back in June, and we still think it can go back to the 2021 highs at $31. Longer-term, it could go much higher.
The post (Premium) FICC in Focus – September first appeared on Grindstone Intelligence.


