(Premium) Health Care Sector Deep Dive – September
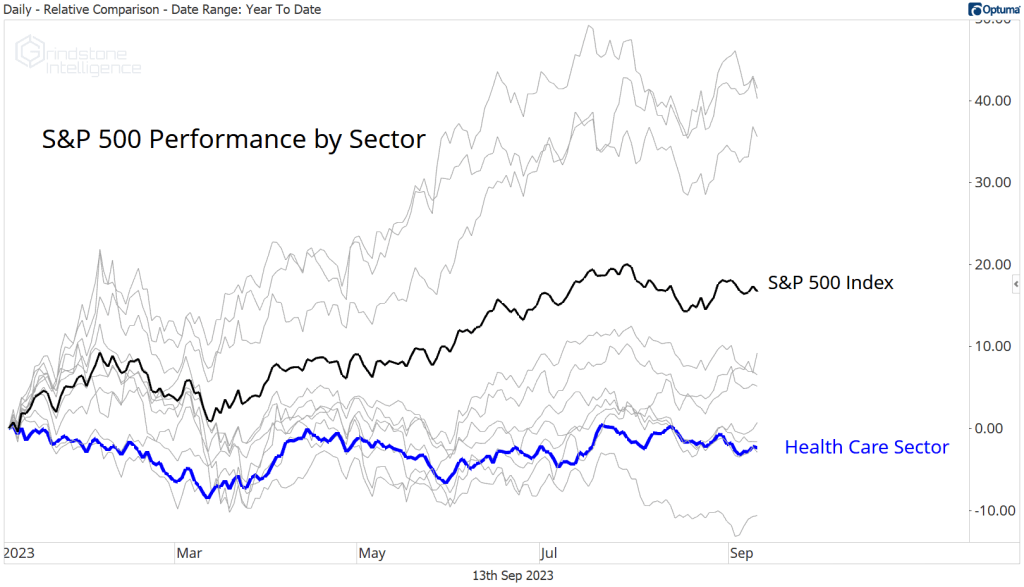
The Health Care Sector is near the bottom of the year-to-date sector derby. The benchmark S&P 500 index has risen 16.8% before dividends, but that gain hasn’t been broadly distributed. Health Care stocks are down 2%.
The problem isn’t really that Health Care is in a downtrend. The problem is there’s no trend at all. We use a couple of basic rules to quickly identify uptrends and downtrends here at Grindstone.
Is the current price above a simple moving average?
Is moving average sloping up or down?
And for Health Care, the answer to both is a big fat ¯\_(ツ)_/¯
Price is right on top of a flat average of trailing prices – and that’s true whether we choose a short-term 50-day moving average or the long-term 200-day. What’s more, the sector is right in the middle of a 2 year trading range.
There’s just no trend to be found in Health Care.
At least not for the large cap sector. When we look past the biggest names, we start to see a weaker picture. Small cap Health Care just broke down to multi-year lows.
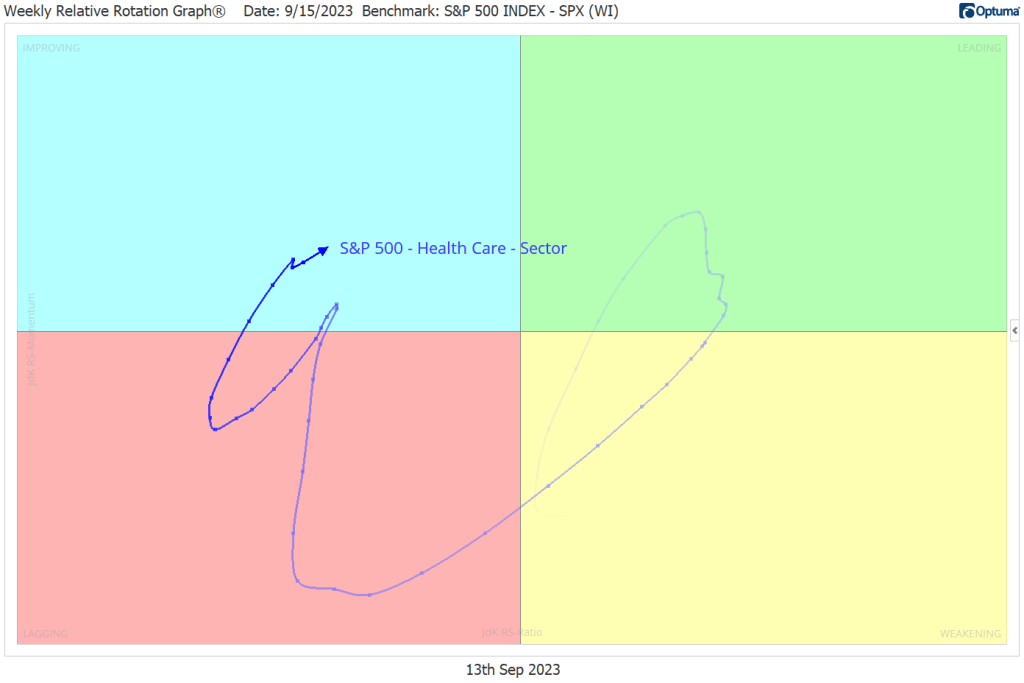
We see a similar picture when we look at the trends in relative strength. For the large caps, Health Care has risen out of the Lagging quadrant of the weekly Relative Rotation Graph and into the Improving quadrant.
What’s even more encouraging is that we’re in the midst of the most bullish period for Health Care. The sector has outperformed the S&P 500 index in September by an average of more than 1% since 1990. And it’s tended to outperform of the final three months of the year, too.
The small cap sector, though, is stuck firmly in the Lagging quadrant of the RRG.
The weakness in the small caps warns something isn’t quite right beneath the surface.
And if we look deeper at the large caps, that underlying weakness becomes clear. The equally-weighted S&P 500 Health Care sector just broke to new multi-year relative lows.
That tells us the recent strength has been mostly attributable to just a handful of the largest names in the space.
The experience of most stocks in the sector, meanwhile, has been decidedly less impressive.
Almost 60% of Health Care constituents are in long-term technical downtrends. Just a quarter are in long-term technical uptrends.
Shorter-term trends are even weaker: just 18% of members are in uptrends, and 69% are in downtrends.
Breadth in Health Care is bad and getting worse.
Digging Deeper
The best performing sub-industry in the sector all year has been Health Care Supplies. They’re up 25% in 2023. However, that group was up 35% by February 2, and they’ve been largely rangebound ever since.
We can see how the strength in Health Care Equipment and Supplies has faded in the months since: they’re now in the Lagging quadrant of the Health Care sector RRG. Pharma, meanwhile, is the leader these days, and Biotech is rapidly improving.
Leaders
Eli Lilly is the best performing large cap stock over the last 4 weeks. Lilly is clearly not in a downtrend. It just hit new all-time highs, price is above an upward-sloping moving average, and momentum is in a bearish range. However, the stock could have some trouble as it runs into potential resistance from the 685.4% Fibonacci retracement from the summer 2021 selloff. Prices have respected other retracement levels from that decline over the last 2 years, so why would we be surprised if they did so again? There’s no reason to take a position in LLY until we see how it responds to $600.
Moderna has been another big winner over the last month, but that hasn’t altered the structural downtrend that’s in place. We acknowledge that we might have already seen the low for Moderna, but making that bet is making a bet against the continuation of the existing trend, which is always the lower probability outcome. If the stock is back above former support from the 2022 lows, then we can start thinking about this one from the long side. Otherwise, it’s a no-touch at best and a short at worst.
Boston Scientific is on the leaderboard, too, as it challenges the highs set earlier this year. Resistance came from the 138.2% retracement from the 2020 decline near $55. Longer-term, the uptrend is intact as long as BSX can stay above $46, but new entrants can use $55 as a level to manage risk as we target a move to $60.
Losers
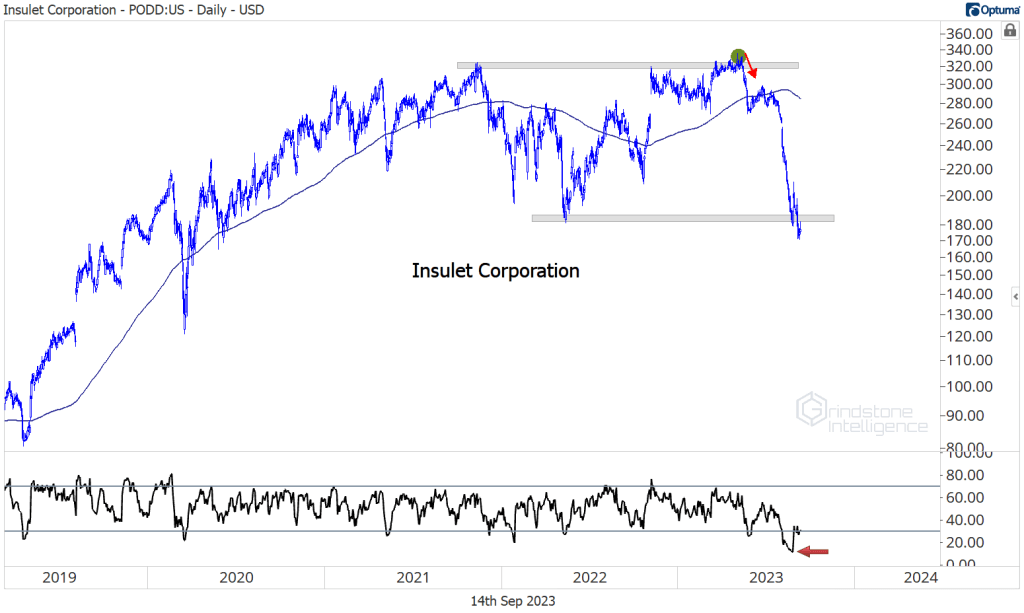
Insulet is a prime example of why managing risk is so important. It was one of the best performing stocks in the world from 2019 to May 2023, when it was setting all-time highs. It would have been easy to fall in love with this stock and think prices could never go lower. Instead, the breakout in May turned into a failed move. From failed moves come fast moves in the opposite direction:
One more to watch
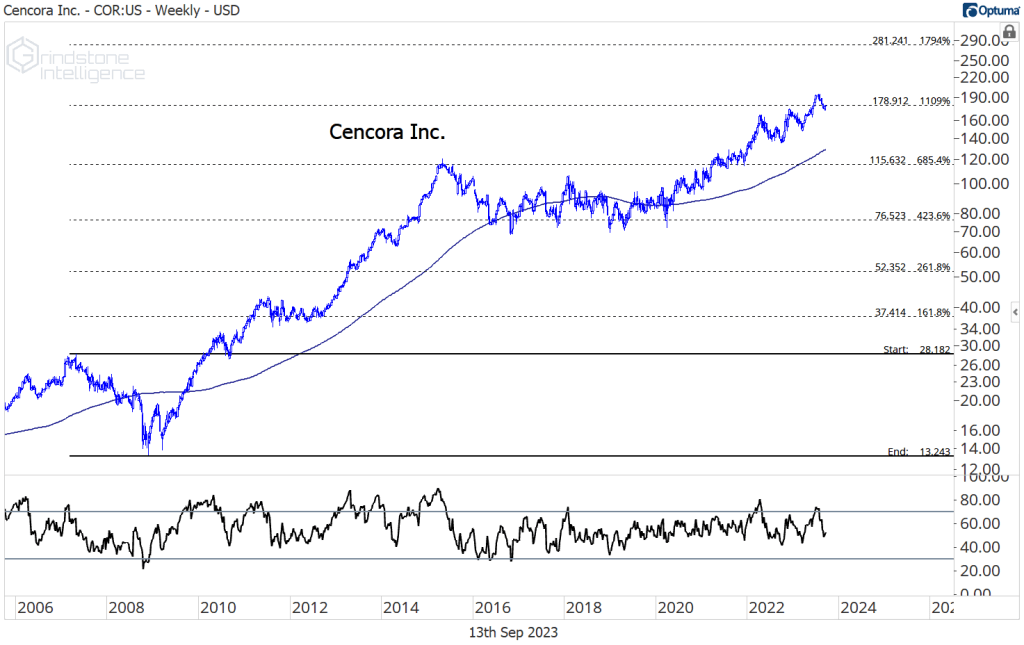
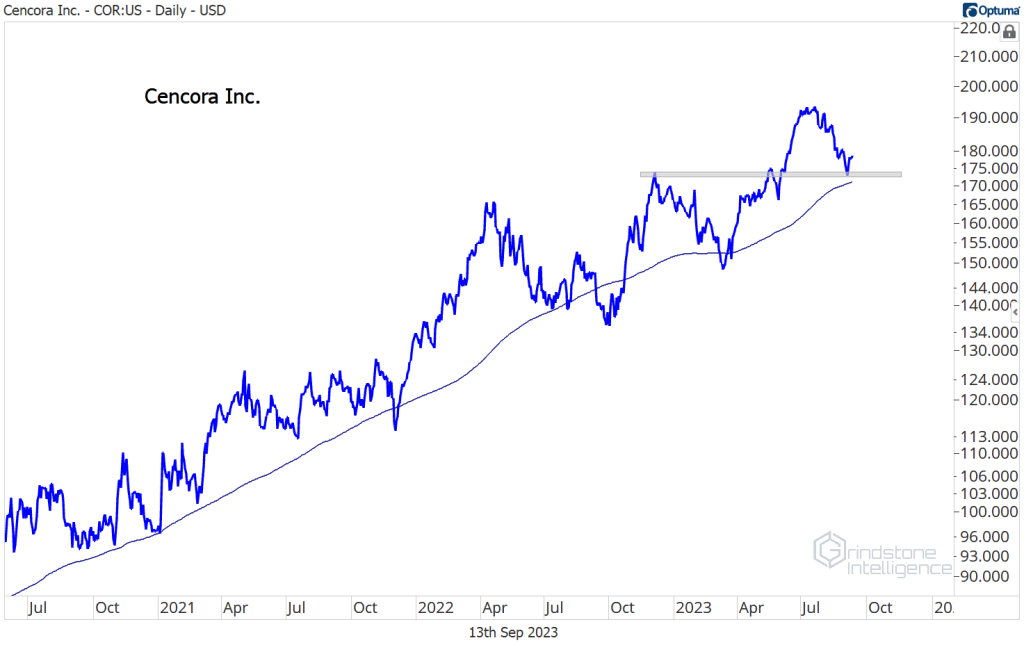
While we aren’t so sure about the company’s choice to give up one of the best ticker symbols of all time, we can’t knock the performance of the share price. Cencora (formerly AmerisourceBergen, symbol ABC) is one to keep an eye on. We’re watching the 1109% Fib retracement from the 2007-2009 collapse, which we first breached earlier this year. COR went nowhere for 6 years from 2015 to 2021, as it digested the 685.4% retracement from that major selloff.
The bigger the base, the higher in space. We think Cencora will move past this resistance area in short order as it heads toward $280. Near term, we want to see it find support here at last year’s highs.
The post (Premium) Health Care Sector Deep Dive – September first appeared on Grindstone Intelligence.


