(Premium) Information Technology Sector Deep Dive
We’re not typically prone to hyperbole, but is there any chart more important than this one when it comes to the future of the equity markets?
Information Technology is the biggest S&P 500 sector by far, accounting for more than a quarter of the index. It took Tech 18 months to set new highs after peaking in December 2021, becoming just the second sector to do so (behind the Industrials). Then, just when Tech looked unstoppable, the rally faltered. The group fell 10% through the first half of August, undoing the breakout and forcing us to question whether the trend was set to reverse lower.
We’re still waiting on an answer.
The bulls can take comfort in the fact that momentum never reached oversold territory during the selloff, and we’ve been in a bullish momentum regime all year. But as long as Tech is below the December 2021 highs, the bears have the upper hand. We’re watching close as we test that level right now. Was the failed move a false start? Or was the breakout the final thrust of a huge, multi-year double top?
We’ll have to wait and see.
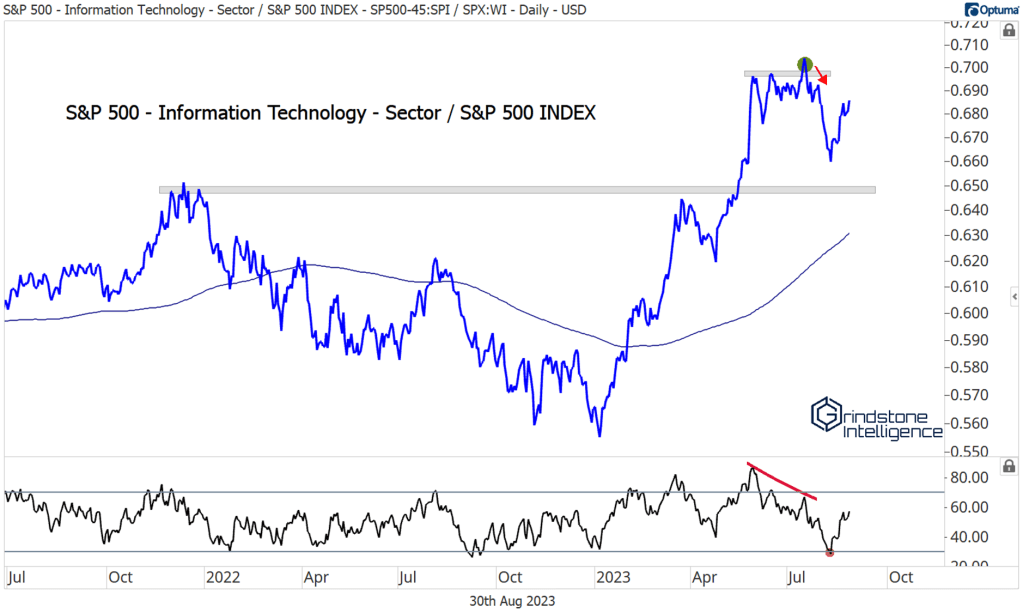
We downgraded Information Technology to Equalweight at the start of August, partially due to the chart above, but also because of the relative chart below. The failed breakout for Tech relative to the S&P 500 was even more pronounced, and coincided with a steep bearish momentum divergence.
Now, momentum is in a bearish range after the ratio touched oversold territory, which has us cautious about the recent rally. With the sector still above the relative highs it set in late-2021, we don’t see a reason to be negative on Tech. But we don’t have a reason to be overly bullish these days, either.
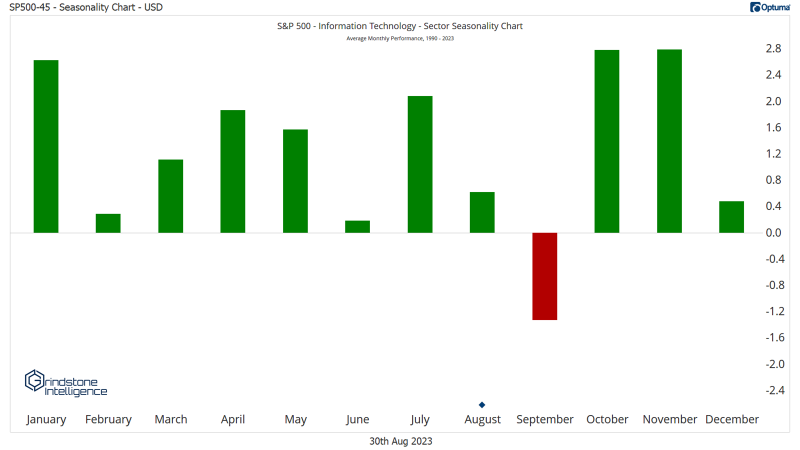
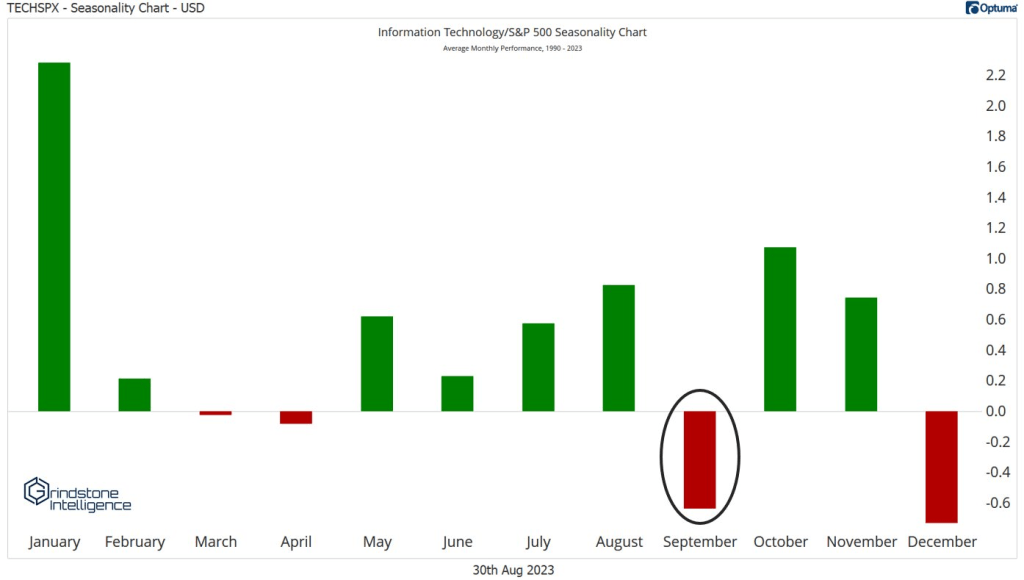
Especially since seasonality isn’t working in the sector’s favor. Seasonality isn’t gospel, and it’s always best taken with a grain of salt. Still, since 1990, September is the only month for which Tech has averaged a negative return. After an unusually weak August, we don’t think now is the time to be betting for a big rally.
To be fair, September tends to be a weak month for stocks overall. It’s not just a Tech problem. But Tech has also tended to underperform during the month. Here’s seasonality for the Tech/SPX ratio:
Whether Tech completely falls apart or not will depend in large part on how its largest component responds to the pressure. Apple gapped lower shortly after we pointed out a bearish momentum divergence in our last sector note. So far, it has managed to stay above the breakout level – a feather in the cap for the bulls. We expect that backtest was just the first skirmish within a longer battle, though. It will take either time or further price correction to repair the damage.
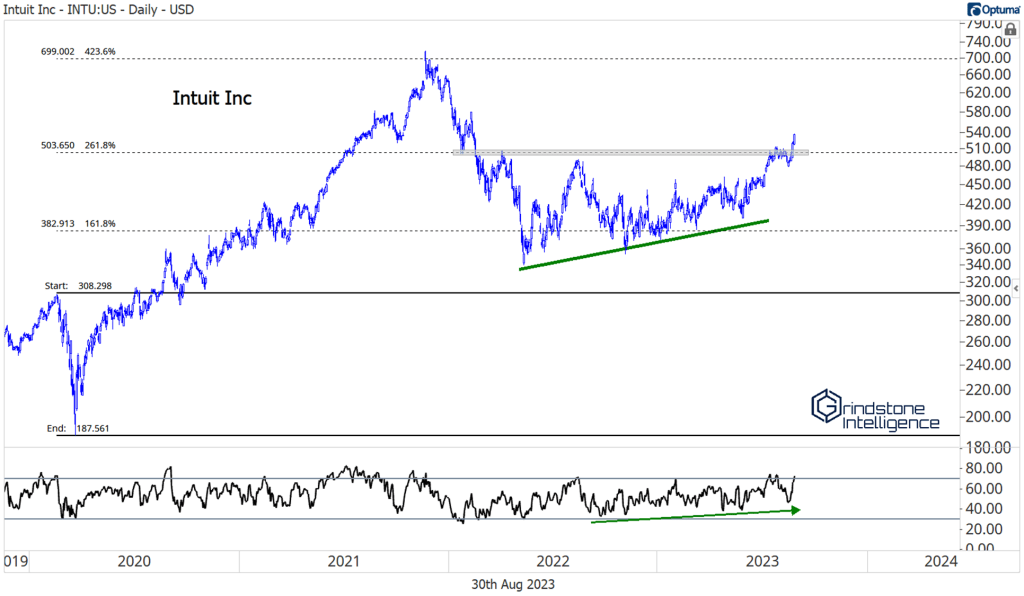
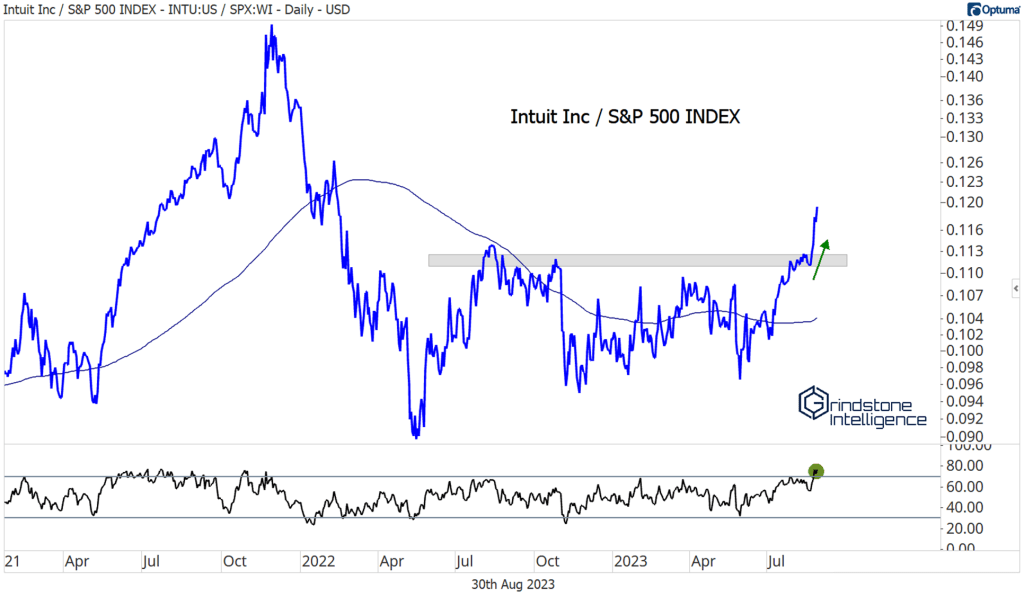
While we wait on Apple, we can focus instead on some other exciting stocks in the space. Intuit just broke out to new 52-week highs. Momentum had been building all year as the stock consolidated, and now that we’ve gotten the breakout, we think INTU can go back and test those former highs near $700. Given the other false breakouts we’ve seen, we only want to be long above $500.
What we really like about Intuit is the breakout we’re seeing on a relative basis. After a year of going nowhere, the ratio of INTU/SPX surged to new 52-week highs and got overbought in the process. That’s a clear sign that bulls are in control and gives us confidence that the stock can continue to outperform.
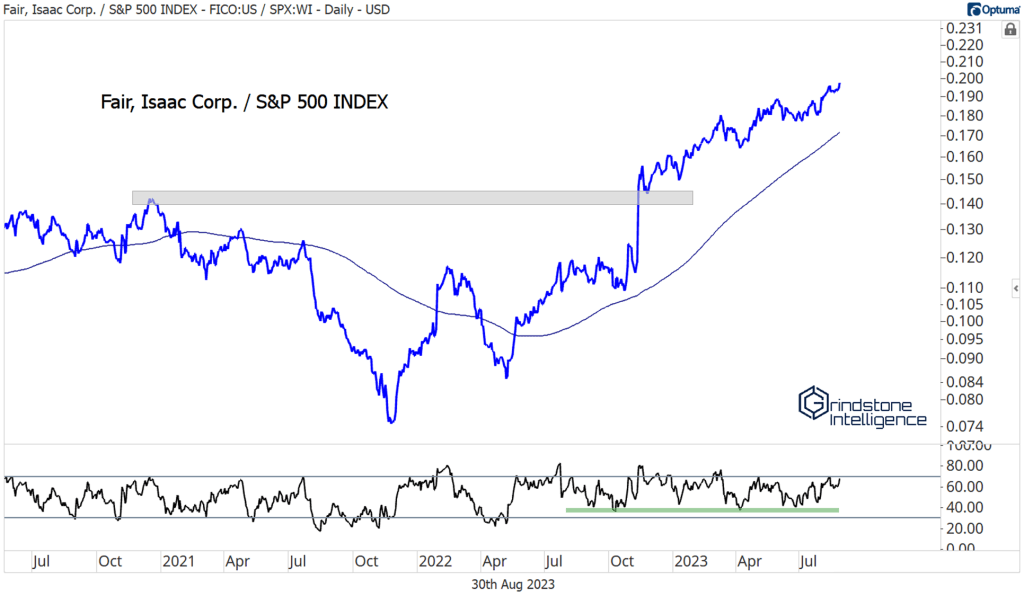
Fair Isaac is another that’s shown overwhelming relative strength. Compared to the S&P 500, the stock has been in rally mode all year, with momentum comfortably in a bullish range.
The same goes for the stock on an absolute basis. It’s rallied right past potential resistance at the 261.8% retracement from the COVID decline, and we’re setting our sights on the next key Fibonacci level, which is at $1250.
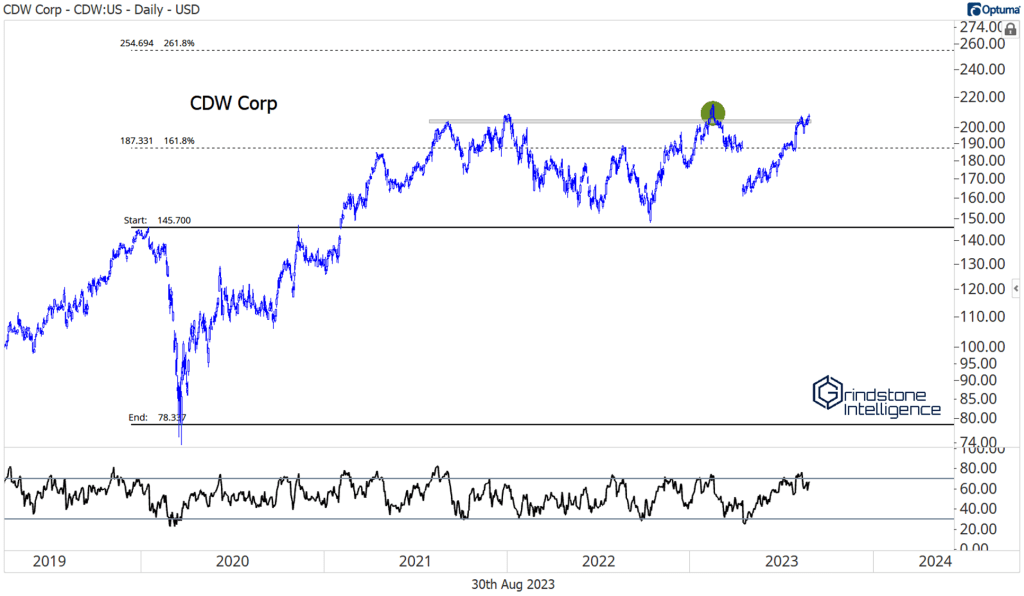
We’ve got a great new setup in CDW, which just broke back out above its 2021 highs. A failed breakout earlier this year sparked a sharp reversal that concluded with a big gap lower. It’s been all up from there:
Right now, we like CDW with a target of $255, which is the 261.8% retracement from the 2020 decline, and 20% higher from here.
The recent rally also improved CDW’s relative strength profile. Plotted against the benchmark index, the stock is back above a key area of former resistance, which acted as the from 2019 through 2022. The stock is poised to continue outperforming with that level now acting as support.
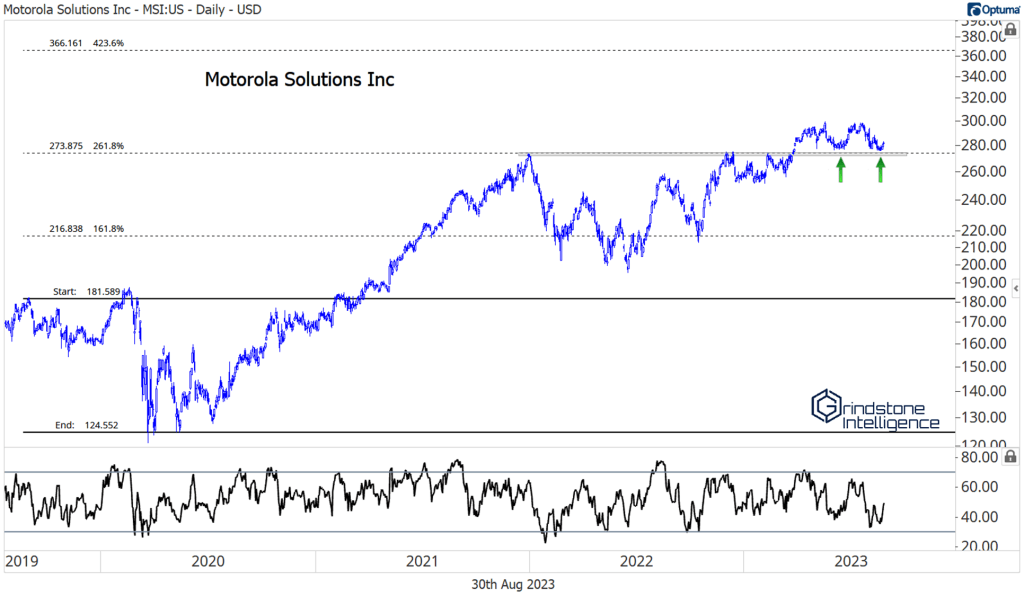
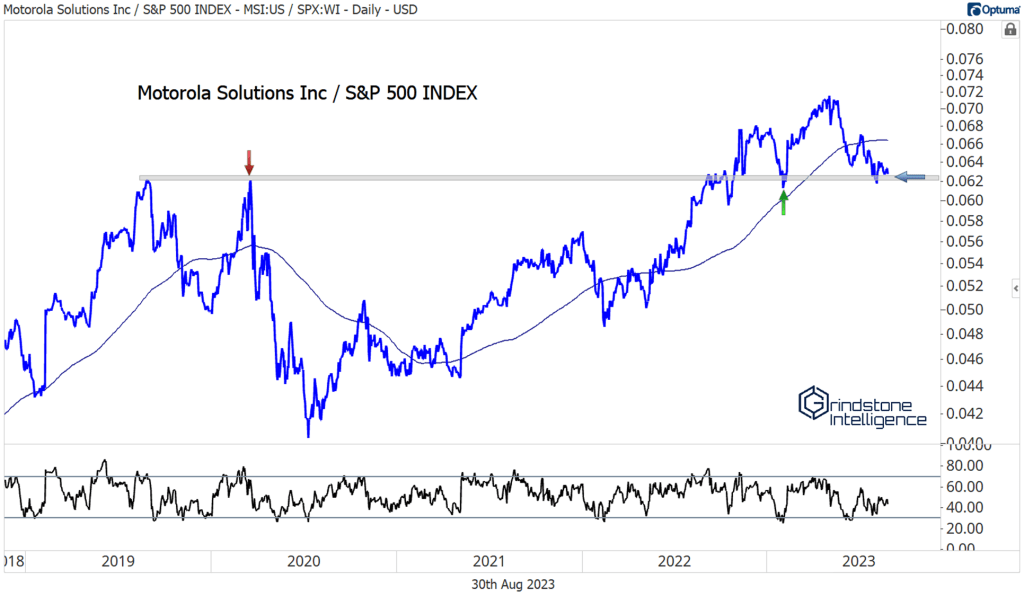
Motorola was one of the first to breakout earlier this year, then briefly pulled back to the initial breakout level, just above $270. Most impressive, we think, is how momentum has never even approached oversold territory this year. That’s something you don’t see in a downtrend. We like it long above the 2021 highs with a target above $360. Those who want to see more confirmation might want to wait until it breaks through 6-month resistance at $300.
We’d change our minds about MSI if it’s unable to stabilize here on a relative basis. Compared to the S&P 500, we’re testing a former resistance area from 2019-2020, which acted as support earlier this year.
The risk here is very well defined, which we like. We want to own MSI, but only if the ratio is above those former highs.
The post (Premium) Information Technology Sector Deep Dive first appeared on Grindstone Intelligence.


