(Premium) Information Technology Sector Deep Dive – September
Information Technology spent most of 2023 in the pole position. Earlier this month, the S&P 500’s largest sector was up more than 45% year-to-date. Weakness in the back half of September has erased nearly a third of those gains and pushed Tech from the top of the leaderboard.
Last month, we posited that this chart might be the most important in the world. Eighteen months after the sector first stalled out, kicking off a nasty bear market in 2022, we finally made it back to all-time highs. How Tech responded to those highs would tell us a lot about the health of the market overall. Four weeks later, we seem to have our answer: the bull market is on hold until further notice.
It’s the same thing for the sector’s biggest name. If Apple is stuck below $175, which is the 423.6% retracement from the 2020 decline, there’s no reason to be aggressively long. This isn’t a downtrend yet, but the uptrend is broken. Unless you like trading rangebound prices, there’s no reason to be invlolved.
Things are even weaker beneath the surface. The equally weighted sector never approached its own all-time high, and now it’s back below a key rotational area. Unless we’re back above this level of former support that’s now turned resistance, there’s not much reason to be excited about Tech as a whole.
The Tech sector’s relative weakness didn’t happen overnight. We can see the group moved into the Weakening quadrant of the weekly Relative Rotation Graph in the first week of August, after nearly 5 months in the Leading quadrant.
And once again, it’s clear that things are a bit worse beneath the surface. Small cap Tech is all the way down in the Lagging quadrant when compared to the rest of the small cap space.
It doesn’t help that Tech is in one of its toughest seasonal periods. Seasonality isn’t gospel, and it’s always best taken with a grain of salt. Still, since 1990, September is the only month for which Tech has averaged a negative return. And when viewed on a relative basis, only December is worse.
After an unusually weak August, September has been even worse than normal this year. The question is, can we bounce back in October, which has been the second best month for Tech over the last 30 years?
On a long-term basis, most stocks in the sector are holding up. Almost 60% are still above rising 200-day moving averages, despite a tough run over the last 2 months.
Shorter-term, though, the picture isn’t quite so rosy. Three-quarters of the group are below falling 50-day moving averages.
Unless we see some improvement soon, those weak short-term trends will start doing damage to the long-term structure of these stocks.
Digging Deeper
The top performing sub-industry in the sector for most of the year has been Semiconductors, which had gained nearly 90% YTD in July. They’re still atop the leaderboard, but they’ve given up a big chunk over the last few weeks, and are back to levels not seen since May.
The more recent winners are Technology Distributors, IT Consulting, and Application Software, which are all in the Leading quadrant of the weekly Relative Rotation Graph when compared to the rest of the sector.
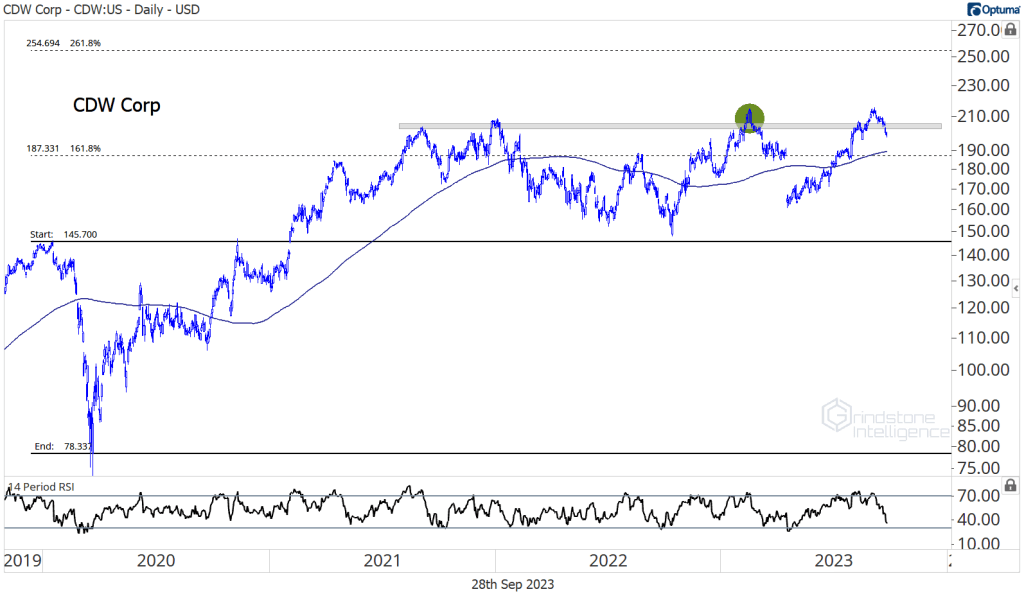
The Distributors group has just one member, CDW. CDW needs to get back above these former highs in a hurry, lest it suffers the same fate as other stocks in the sector that are now decidedly rangebound. If we’re above $205, we can target the 261.8% retracement of the COVID selloff.
Leaders
Only 5 stocks in the sector have managed to stay in the green over the last 4 weeks. Western Digital is up 41% for the year, but one could argue it’s still stuck in a long-term downtrend. The downtrend line from early 2021 is still intact, and we’ve yet to surpass the January highs. At this point, if either of those resistance levels breaks, so does the other.
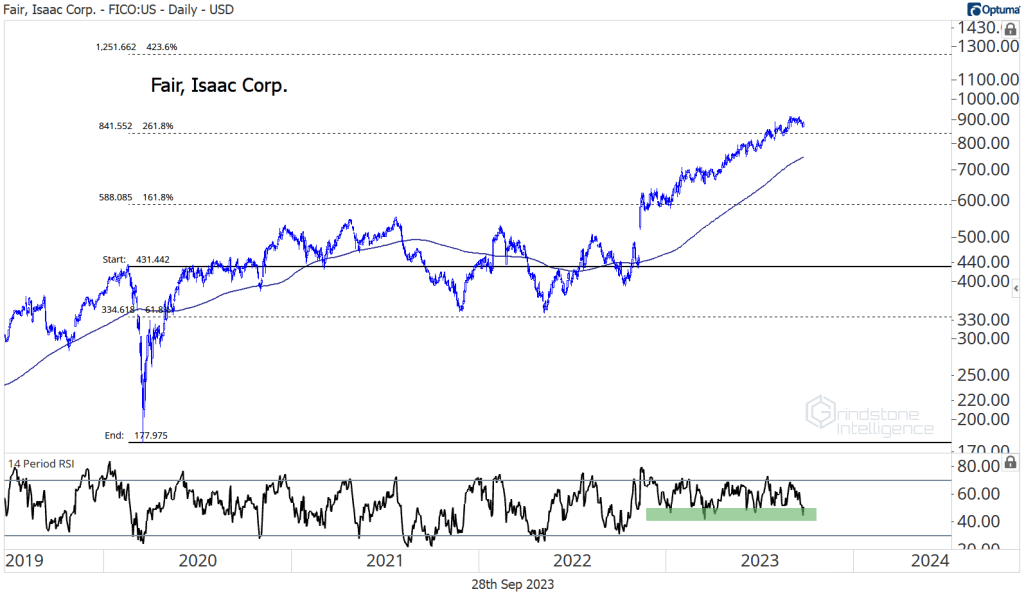
Fair Isaac is another big winner for the year, but unlike WDC, FICO is in a clear uptrend. It rallied right past potential resistance at the 261.8% retracement from the COVID decline, and we’re setting our sights on the next key Fibonacci level, which is at $1250.
Losers
SolarEdge is the sector’s worst performer over the last 4 weeks and for the year. This is a prime example of why we avoid things that are breaking down and setting new lows. Losers tend to keep on losing.
Growth Outlook
Tech is expected to lead earnings and sales growth over the coming two years.
That comes after a relatively weak performance in 2023, where sales are set to grow less than 5%, and earnings are expected to fall. Sharp rebounds in 2024 and 2025 are what analysts are anticipating – but for the sector to actually meet those EPS projections, profit margins will have to reach new highs. That seems unlikely.
One More to Watch
Intuit is backtesting a 1-year breakout level. Momentum had been building all year as the stock consolidated, and now that we’ve gotten the breakout, we think INTU can go back and test those former highs near $700. Given the other false breakouts we’ve seen, we only want to be long above $500.
What we really like about Intuit is the breakout we’re seeing on a relative basis. After a year of going nowhere, the ratio of INTU/SPX surged to new 52-week highs and got overbought in the process. That’s a clear sign that bulls are in control and gives us confidence that the stock can continue to outperform.
The post (Premium) Information Technology Sector Deep Dive – September first appeared on Grindstone Intelligence.


