Reversals and Resolutions: Checking in on Growth vs. Value - 11/21/2023
Happy Thanksgiving everybody. The next post will be on Monday, November 27.
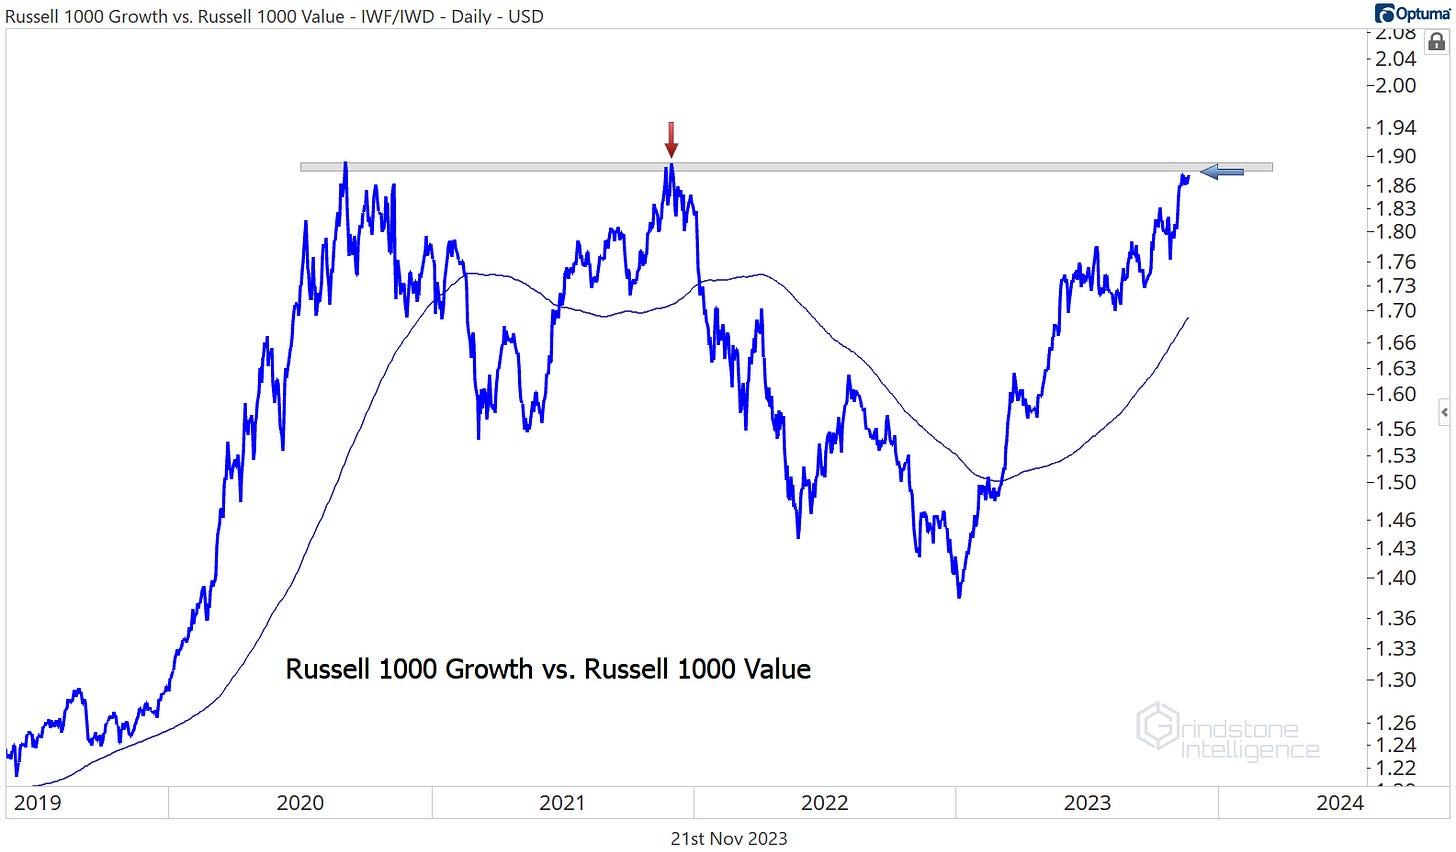
2022 was the year that Value made a comeback. For more than a decade, ‘Value Investor’ was synonymous with ‘Serial Underperformer’. From the lows in 2006 to the highs in September 2020, the Russell 1000 Growth Index outgained its Value counterpart by a whopping 180%. Last year, it gave up a quarter of those relative gains.
Value’s day in the sun didn’t last - with a changing of the calendar came renewed leadership from the old guard. Growth has been the leader all year, and now the growth/value ratio is right back to those September 2020 highs.
Will growth suffer the same fate it has each of the last two times we’ve been at this level? That depends on the Information Technology sector.
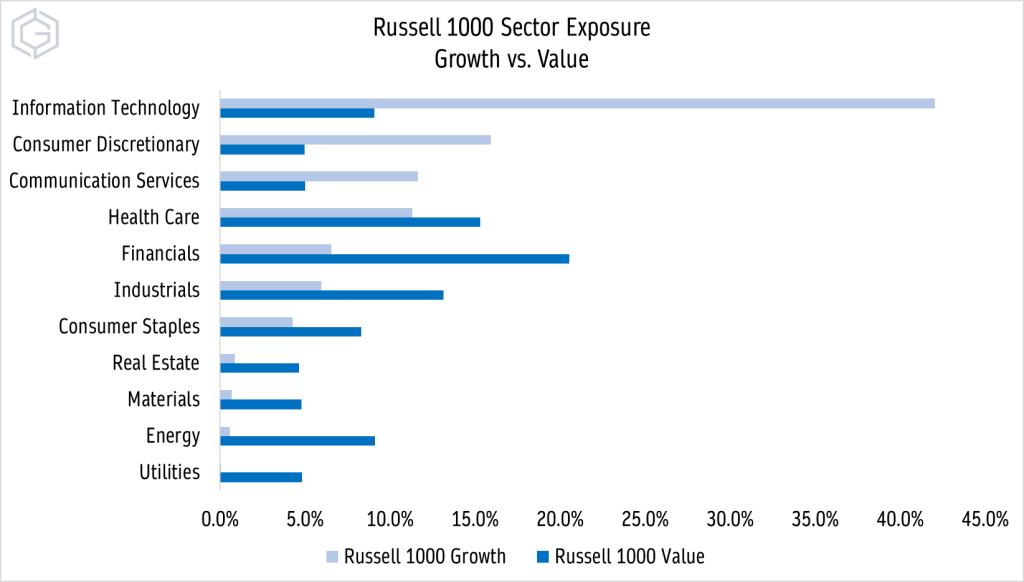
The Growth vs. Value discussion is really just another flavor of ‘Tech vs. everything else’. Check out the difference in sector exposure between the Russell 1000 Growth and Value indexes. Tech represents just 9% of Value, but 42% of Growth.
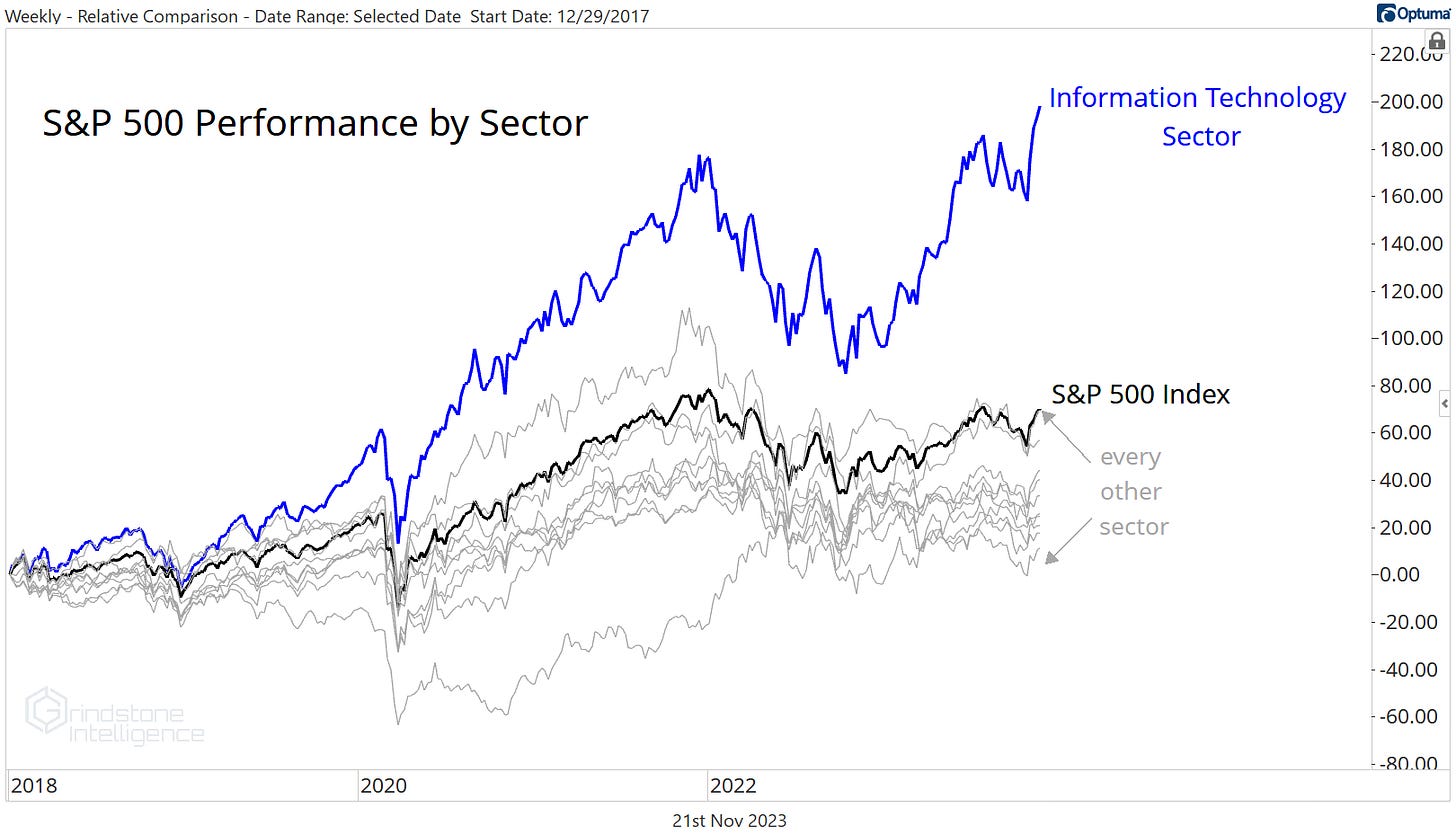
And Tech’s recent dominance can’t be overlooked. Compared to the rest of the benchmark index, it just broke out to new all time highs
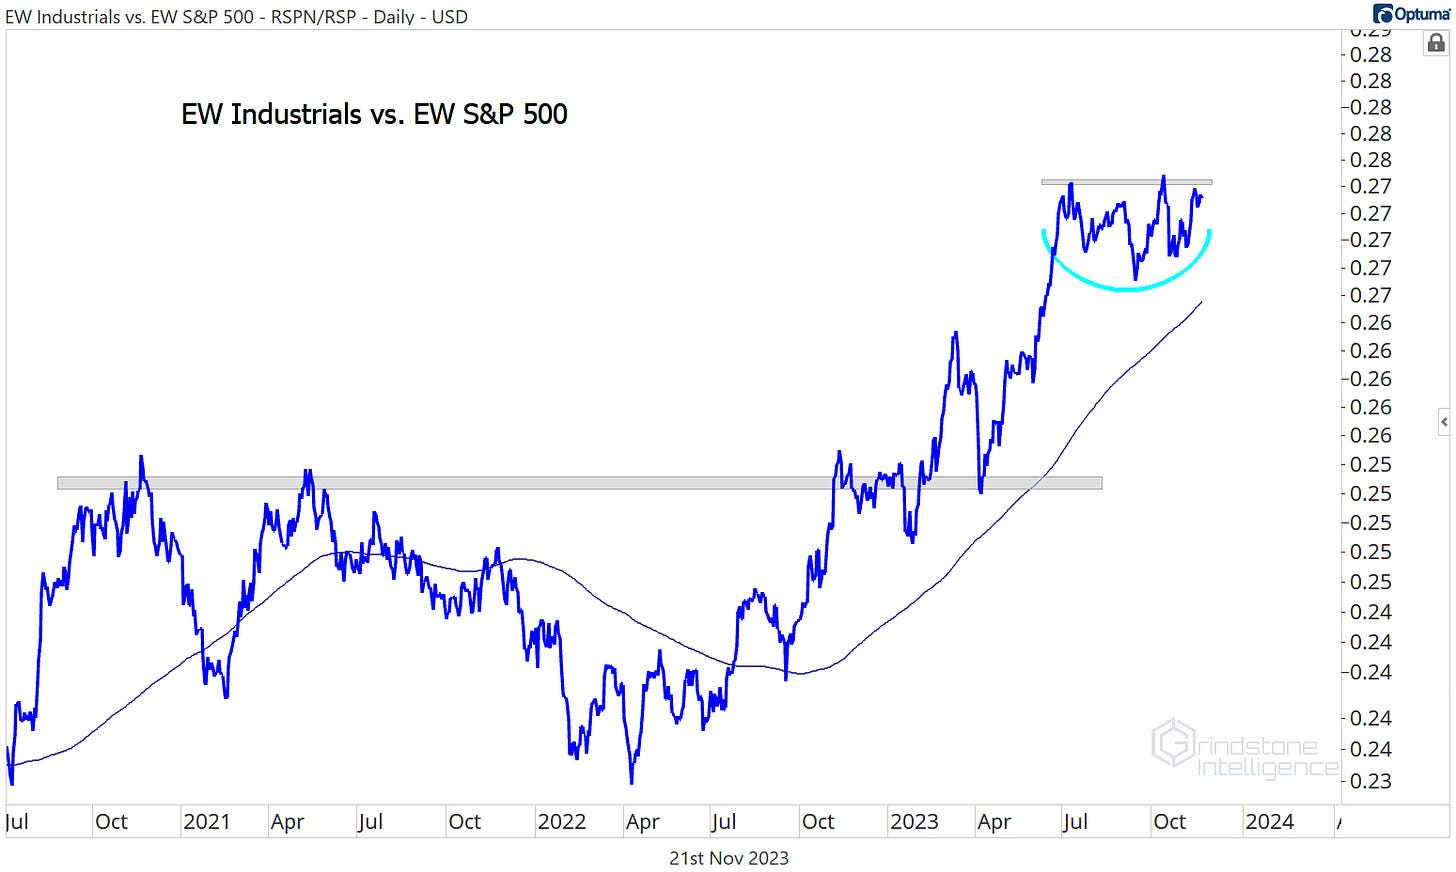
Don’t be fooled into thinking this is just a mega cap story, either. Sure, huge gains by juggernauts like NVIDIA, Apple, Microsoft, and Broadcom are fueling a big portion of the sector’s rally, but that doesn’t mean Tech’s outperformance isn’t broad. Check out the ratio of the equally weighted sector vs. the equally weighted S&P 500. Weighting each of the components equally instead of by market cap removes the outsized influence of the biggest Tech companies, and still the sector is setting new relative highs.
Yet we can’t ignore this potential area of resistance in the Growth vs. Value ratio. Those former highs have memory, and it’s hard to believe we’ll just blow right past them as if they aren’t there at all. If a shift does occur, it’ll mean that other sectors are stepping up to take a leadership role. Like the Financials.
The Financials are the biggest overweight in the Russell 1000 Value index, representing 20% of that index but just 6.5% of Growth. And the sector has been coiling up for a move relative to the rest of the S&P 500.
Usually we expect consolidations like the ones below to resolve in the direction of the trend, which has been down all year. But reversals are always possible, especially given the internal strength in the Financials that we discussed on Friday.
The Industrials are another important area to watch, making up 7% more of the Value index than the Growth. The equally weighted Industrials have outperformed the equally weighted S&P 500 for most of the last two years and are poised for a bullish resolution out of this 5 month consolidation pattern.
Keep in mind, though, potential reversals and resolutions are just that: potential.
For now, the only thing that matters is Tech’s continued dominance. The risk of ignoring that elephant in the room has been catastrophic over the last 6 years. Since the end of 2017, the other 10 sectors have all underperformed the benchmark. Not just underperformed Tech. No, Tech has been so dominant that it’s catapulted the performance of the entire S&P 500 above every other sector that comprises the index.
Bet against Tech at your own risk.
Until next time.


