

Sluggish Small Caps - 1/25/2024
Stuck in the mud

The S&P 500 is setting new all-time highs this morning, but one segment of the market has been notably absent from the rally over the last year: the small caps. Ever since the spring of 2022, the Russell 2000 has been rangebound between its pre-COVID highs and the 138.2% retracement from the 2020 decline.

The lack of participation has frustrated a lot of small cap bulls, especially since the small caps found their floor in June ‘22, months before the large cap indexes bottomed that October. On the other hand, there’s nothing bearish about what the small caps are doing. This isn’t a downtrend to be shorting - it’s just an extended consolidation that hasn’t yet chosen a direction.
Until we do get that resolution, the small caps will continue to show relative weakness. Compared to the S&P 500, the Russell 2000 is in a clear downtrend and just got rejected by overhead supply at the March 2020 lows.

There’s no reason to be overweight the small caps as long as the March 2020 lows are intact. The opportunity cost of not owning the large caps is just too big until we see clear and convincing evidence of a reversal in relative strength.
Not all small caps are created equal
Now, just because small caps as a whole are something we want to avoid doesn’t mean we have to ignore the space entirely. Not all small caps are created equal.
A big part of the reason the small caps lagged in 2023 and are behind in 2024 is simply sector exposure. Information Technology and Communication Services were the two best performing sectors in the S&P 500 index last year, and those happen to be the two largest underweights in the Russell 2000.

In the same vein, the two worst sectors in the S&P 500 since the October ‘22 lows have been Energy and Utilities - both of those sectors have higher weighting in the small cap index.
In short, not every small cap has to be avoided. There are plenty of strong uptrends beneath the surface, just like in the large cap space. Two-thirds of S&P 600 small cap index members are above 50, 100, and 200-day moving averages.

The Financials stand out, with more than 80% in short, intermediate, and long-term uptrends. We like PSCF, the small cap Financials ETF, above $48 with a target of $54, which is the 61.8% retracement from the 2021-2023 decline.

We highlighted the relative strength of the small cap Industrials in yesterday’s note, given they’ve outperformed every other sector over the last 12 months. They’re also outperforming the large cap sector. Here is PSCI trying to break out of a 3 year base relative to XLI. That failed move in December looks more like a false start than the start of a trend reversal - especially with momentum staying clear of oversold territory for the last year.

For PSCI, we’ve got a near term target of $120.

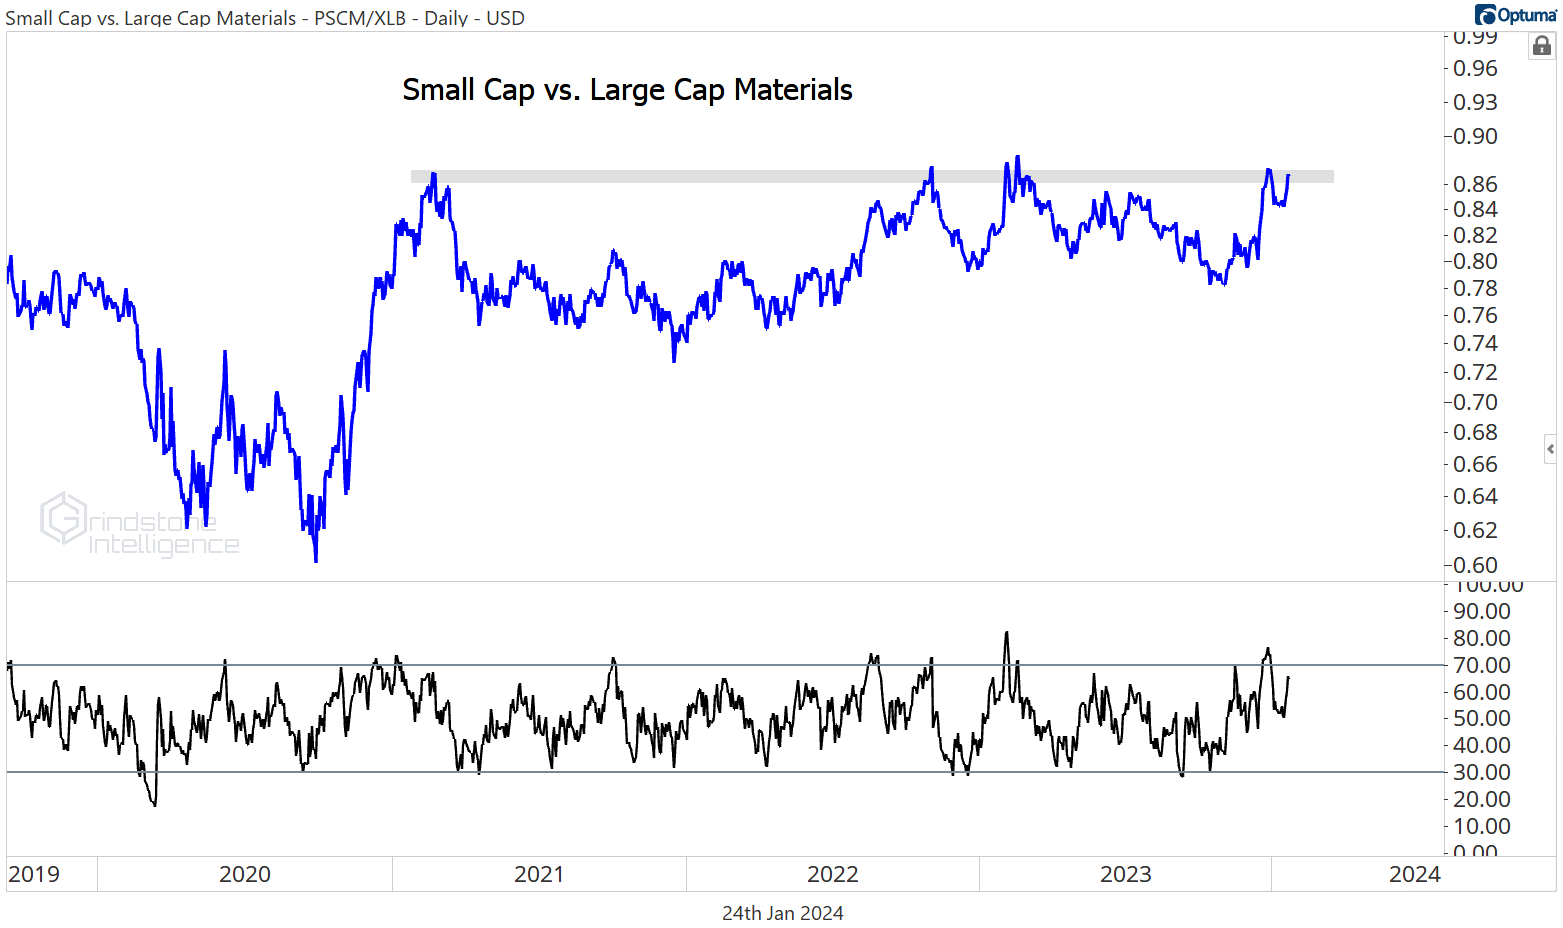
The risk-reward isn’t all that compelling for the Industrials right here, but the Materials offer a much better setup. If we get a breakout above $74 in the PSCM, we want to be long with a target of $100, which is the 261.8% retracement from the 2018-2020 decline.

We really like the relative strength we’re seeing for the small cap Materials relative to the large cap sector. Here they are trying to break out of a 3 year relative base.
There’s just as much relative strength in the small cap Staples. Check out this 5 year cup and handle pattern for PSCC versus XLP. The large cap Consumer Staples haven’t given us much to be excited about lately, but the small caps are much better.

And we’d be remiss if we didn’t address small cap Tech. This group has gone absolutely nowhere for the last 3 years, but PSCT is still in a long-term technical uptrend. We think the small cap sector will follow the leadership of large cap Tech to new highs. We can own this one above $43 with a target of $60.

That’s all for today. Until next time.