Tech Sector Outlook
Key themes and trade ideas within the market's most important sector
Tech continues to be unstoppable.
Just how unstoppable? Over the last 5 years, the Information Technology sector has risen more than 200%, 2x the return of the S&P 500 index. It goes even further than that, though. Tech’s dominance has been so extreme that every other sector has lagged the benchmark. 10 out of the 11 sectors are below ‘average’.
The run has helped the Tech sector completely erase the underperformance from the peak of the dotcom bubble. It took more than 20 years, but Tech is now setting new all-time highs compared to the rest of the market:
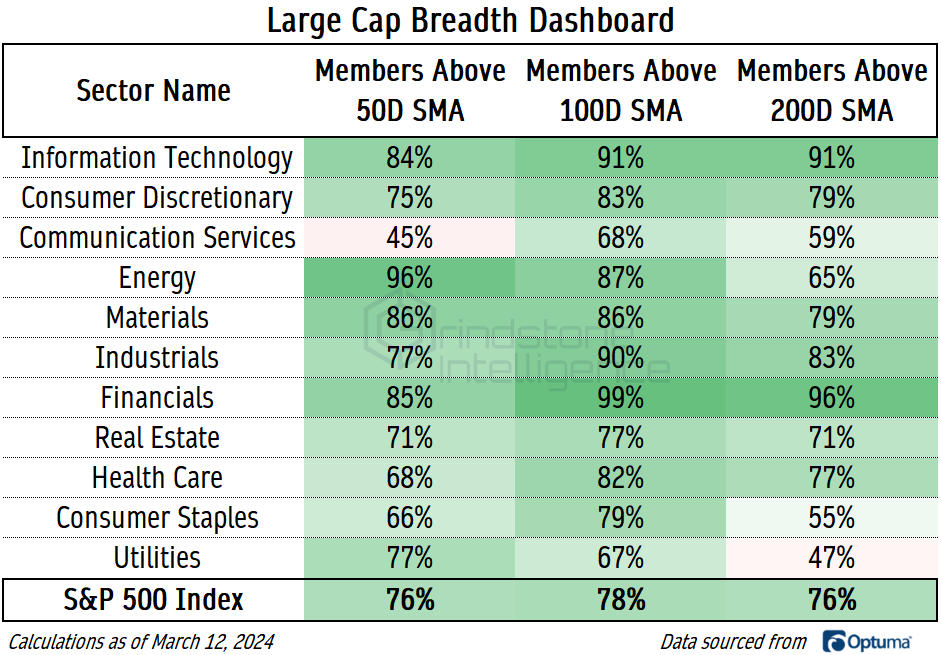
It hasn’t been just a handful of stocks driving all the gains, either, despite the popular narratives out there. The vast majority of Tech stocks remain in technical uptrends. 84% of the sector’s constituents are above their 50-day moving average and 91% are above their 200-day. Only the Financials sector shows stronger breadth characteristics.
Of course, stocks don’t go up in straight lines - not in perpetuity. And if Tech is going to run into trouble, this is a pretty logical place to do so.
The S&P 500 Information Technology sector index just hit the 161.8% retracement from the 2022 bear market decline. At the same time, RSI momentum is failing to confirm the latest move higher.
We’re seeing the same bearish momentum divergence when we look at Tech compared to the rest of the S&P 500.
To be clear, we’re not predicting a Tech sector crash. This is a bull market, and betting on lower prices during bull markets is a recipe for disaster. The more likely outcome in our opinion is consolidation for Tech while other areas of the market step in and take a leadership role. But before that happens, we need to see some confirmation.
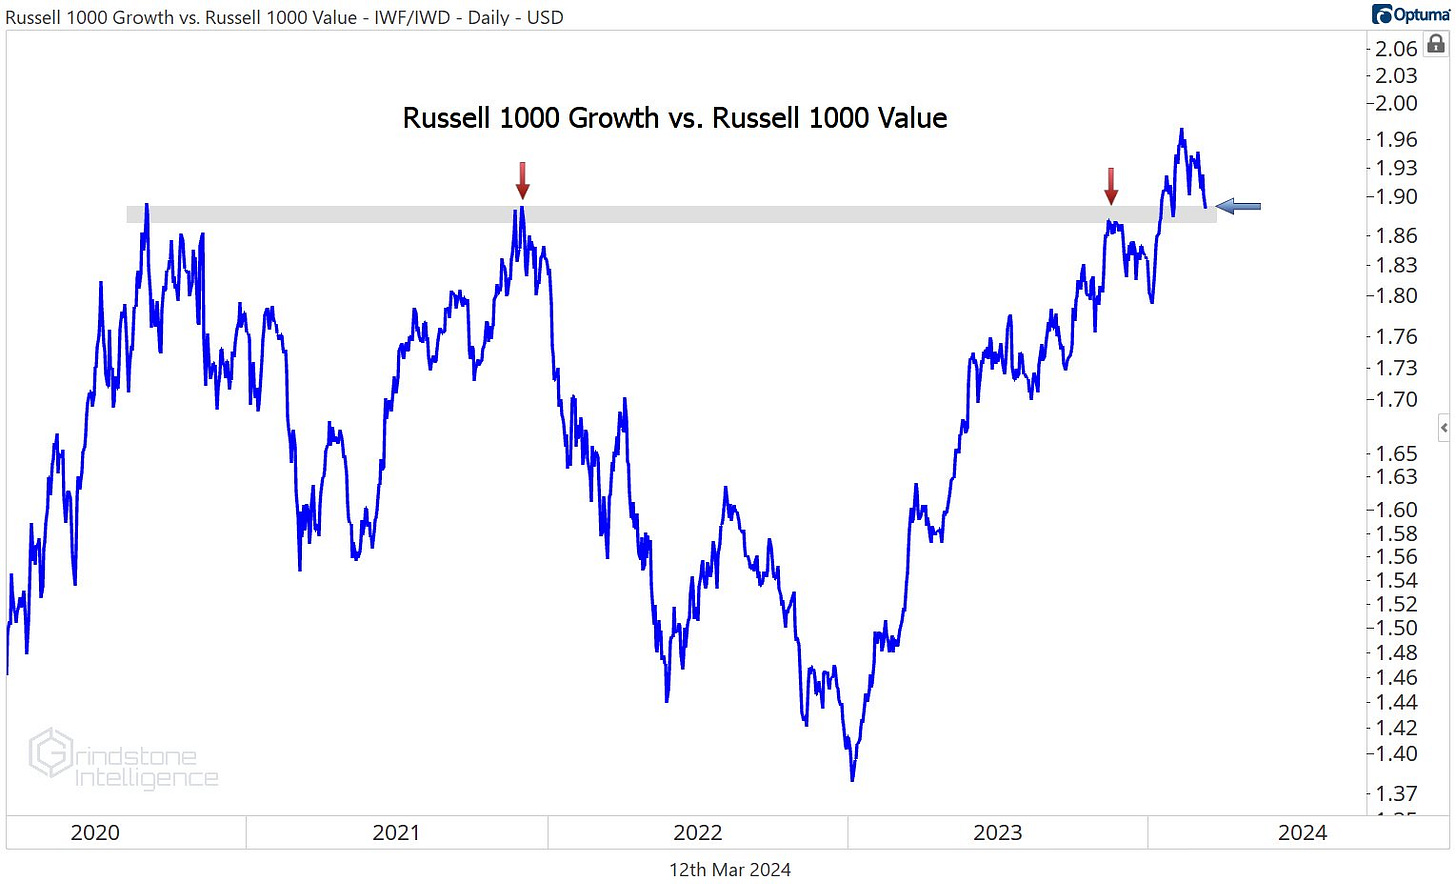
This is the chart to watch. The Russell 1000 Growth vs. Russell 1000 Value ratio is backtesting the neckline from a 3.5 year breakout. If this becomes a failed breakout for growth stocks relative to value, we might be sitting here 9 months from now talking about how the value-oriented Financials and Industrials were the leaders in 2024.
But if we see this support level hold instead, it’ll be because Tech continues to be a leader.
Digging Deeper
The Tech sector has dominated the S&P 500, and the semiconductors are dominating the Tech sector. The NVIDIA-led sub-industry has surged 140% over the last year.
Last month, we pointed out that NVDA had hit our target of $700, which was the 261.8% retracement from the 2021-2022 decline. The stock promptly reminded us that the strongest trends don’t care about the levels we draw on a chart.
Compared to the rest of the sector, momentum for NVDA reached its most overbought level ever. Contrary to how it sounds, that’s not a bad thing. It’s just more evidence of strength.
The next level of interest for us is the 423.6% retracement from the 2021-2022 selloff, which is up at $1060.
Broadcom has been another big winner in the semiconductor space. It resolved higher out of a 5-year base relative to the rest of the Tech sector last year and then just kept going.
We’re wary of new positions right here, though, since AVGO just hit our target of $1360, which is the 685.4% retracement from the 2020 decline. If it’s above $1400, we like Broadcom with a target of $2100. But we want to see it move past this potential area of resistance first.
Leaders
Sticking with the semiconductors, AMD just broke out above the 2021 highs, then went up and kissed our $225 target.
Longer-term, think AMD goes to $330, but we want to see it digest some of these recent gains. We can buy pullbacks towards the breakout level of $165.
Hewlett Packard Enterprise was one of the sector’s biggest winners over the last month, resulting in a bullish resolution out of a huge 4.5 year base. We can’t be bearish HPE if it’s above $17.50.
We still haven’t seen an all out reversal for the stock relative to the rest of the sector, though. That failed breakdown could be the start of a new uptrend, or it could just be a mean reversion within an ongoing downtrend.
For now, we can target $24 for HPE, which is the 161.8% retracement from the 2020 decline. But if we see resumed relative weakness, the opportunity cost of being involved isn’t worth it.
Losers
Not all breakouts have happy endings. Palo Alto was consolidating above support after breaking out of a huge base relative to the rest of the sector, but then they reported earnings. From failed moves come fast moves in the opposite direction.
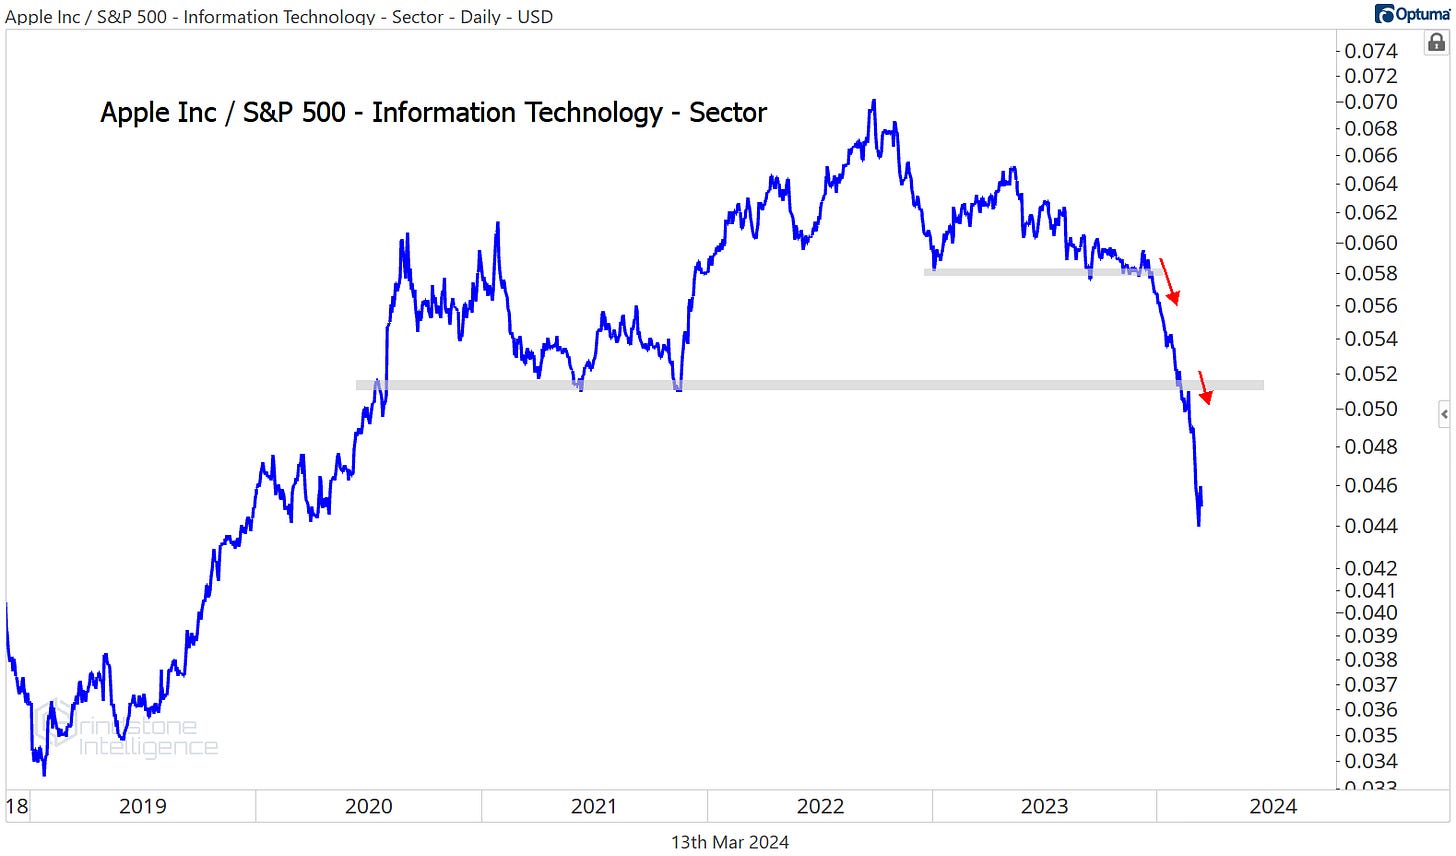
Trend reversals like the ones above happen, but that doesn’t mean they aren’t the lower likelihood outcome. We still want to err on the side of buying relative strength and avoiding relative weakness. Avoiding the relative weakness in Apple has certainly panned out. It just hit 4-year lows relative to the rest of Tech.
It’s not that we want to be shorting AAPL - this is a bull market after all. But we want to own the stocks that are outperforming, and right now, that isn’t AAPL.
More charts to watch
Fair Isaac is one that is.
We like FICO as it consolidates above our former target of $1250. We only want to be buying it now if it’s above that level, but the risk/reward is favorable right here with a target of $1900.
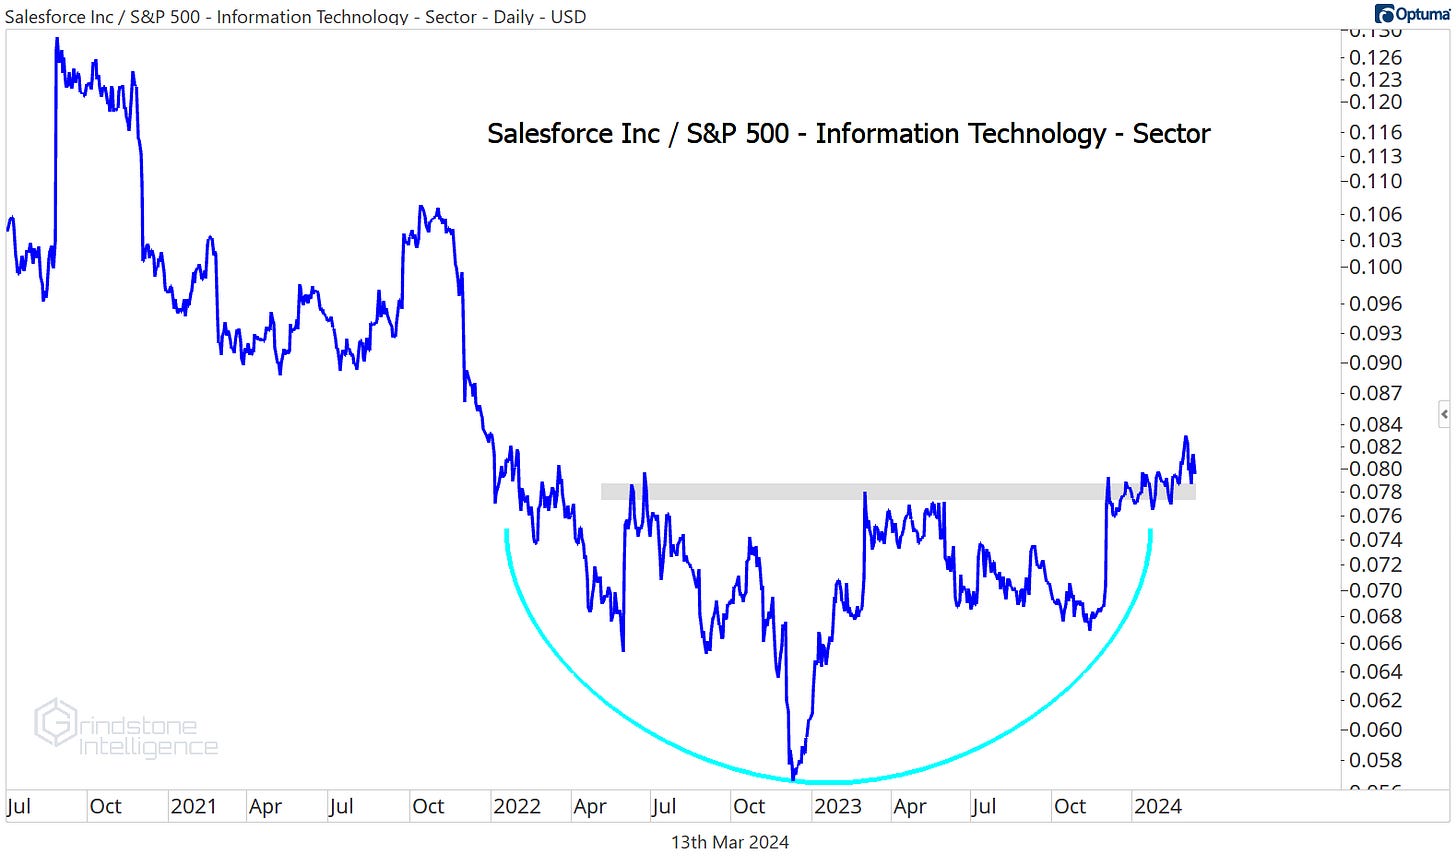
Salesforce just came out of a 2-year reversal pattern relative to the rest of Tech, and that’s enough to make us pay attention.
We want to see how it handles these former highs before initiating new long positions, but on a breakout we can be buying CRM with a target of $420.
We’re also watching for a breakout in Gartner, which has been stuck near the 423.6% retracement from the 2019-2020 decline for the last few months. We like it above $480 with a target of $725.
That’s all for today. Until next time.


