There’s nothing bearish about all-time highs.
The goal of technical analysis is to identify trends in the markets that we can profit from. One hundred years ago, Charles Dow was laying the groundwork for modern trend identification with his columns in the Wall Street Journal - columns which comprised what came to be known as ‘Dow Theory’. Dow Theory isn’t just about getting confirmation from the transports. In fact, that’s not even the most important of Dow’s tenets. Much more meaningful are his thoughts about the three types of trends: primary, secondary, and minor.
Primary trends (e.g. bull and bear markets) last a year or more. Within those broader movements, secondary trends are smaller movements that last weeks to months. Minor trends can last for days to weeks.
Trying to identify the current direction of each the primary, secondary, and minor trend is a challenge, of course. If it wasn’t, you wouldn’t bother reading our work, and we wouldn’t bother writing it. Today, though, there’s no question about the trends in the Tech sector, where we’re on pace for the highest weekly close ever. New highs don’t happen in downtrends.
The Tech sector isn’t just setting new highs. It’s also setting breaking out versus the rest of the market.
It took more than 20 years to get back to the relative peak that was set during the dotcom bubble, and reaching those former highs sparked a Tech selloff in 2022 that turned into the worst bear market since the Financial Crisis. Now, we’ve absorbed all that overhead supply and Tech is a leader once again.
Here’s a closer look at the Tech/SPX ratio. The failed breakdown at year-end 2022 was the catalyst that put an end to the growth-led bear market in stocks.
There’s a popular narrative that the market this year is being driven by just a handful of mega caps. Don’t believe it. True, mega caps have been some of the best performers in 2023, and without them, the gains in the S&P 500 and the NASDAQ wouldn’t be as large. But Tech’s leadership is broader than just a handful of names. Check out the ratio of the equally weighted Tech sector vs. the equally weighted S&P 500: it’s breaking out to new highs.
And while not every stock in the SPX is on the rise, the majority of them are when you look in Tech, Communication Services, Industrials, and Energy - all traditionally risk-on sectors. In Tech, 63% of constituents are above a rising 200-day moving average - the best mark for any sector. Trends are weaker in traditional risk-off sectors like Utilities, Consumer Staples, and Real Estate.
One place Tech’s leadership doesn’t extend is the small caps. Small cap tech is in the ‘Lagging’ quadrant of the weekly Relative Rotation Graph. And it’s heading the wrong direction. The small caps in general haven’t given us much reason to be excited, but if you must get involved there, look outside of the tech sector.
So what’s the gameplan for Tech going forward? The large cap sector is clearly in an uptrend, so we don’t want to be making big bearish bets here. And we obviously want to avoid the small caps until they show signs of improvement.
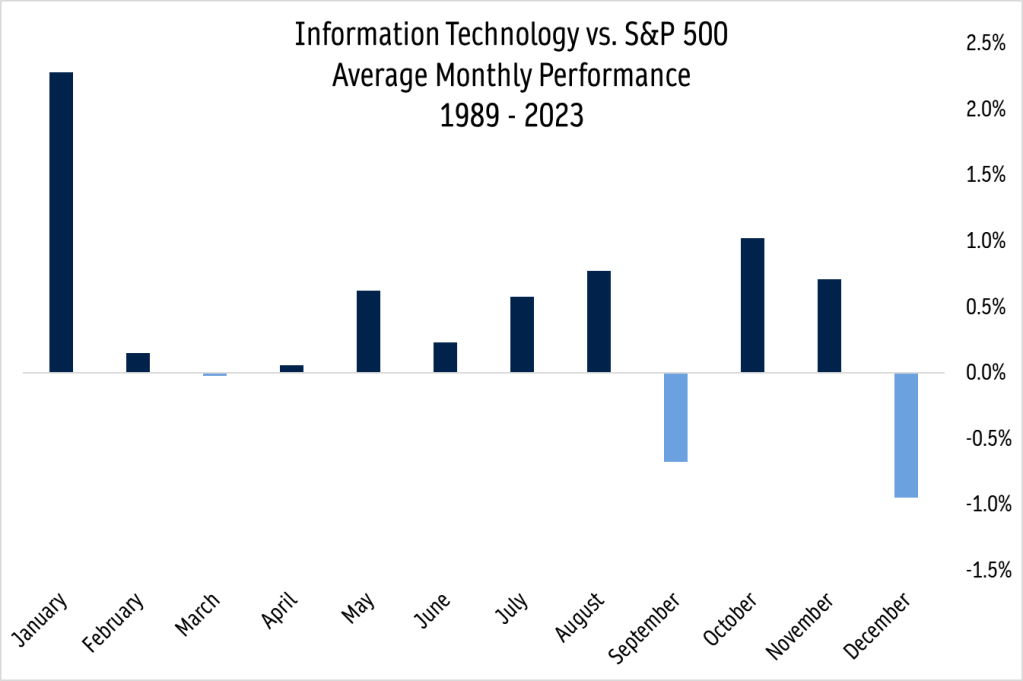
But this probably isn’t the best time to be going all in from the long side either, either. December is historically one of the better months for the S&P 500 overall, but it’s the single worst month to own Tech. Since 1989, Tech has underperformed the SPX in 65% of Decembers and by an average of about 1%.
January is a much better time to own the sector. Tech has led 75% of the time and outgained the benchmark index by an average of 2.25%.
Digging Deeper
For the first half of 2023, semiconductors were all the rage - and for good reason. Led by NVIDIA, the group jumped 90% by the middle of July. They’ve gone pretty much nowhere since then.
NVDA is still digesting the gains with this consolidation near the 161.8% retracement from the 2021-2022 decline. We can own it above $470 with a target of $700, which is the 261.8% retracement, but we don’t want to touch the stock from the long side if it falls below $420.
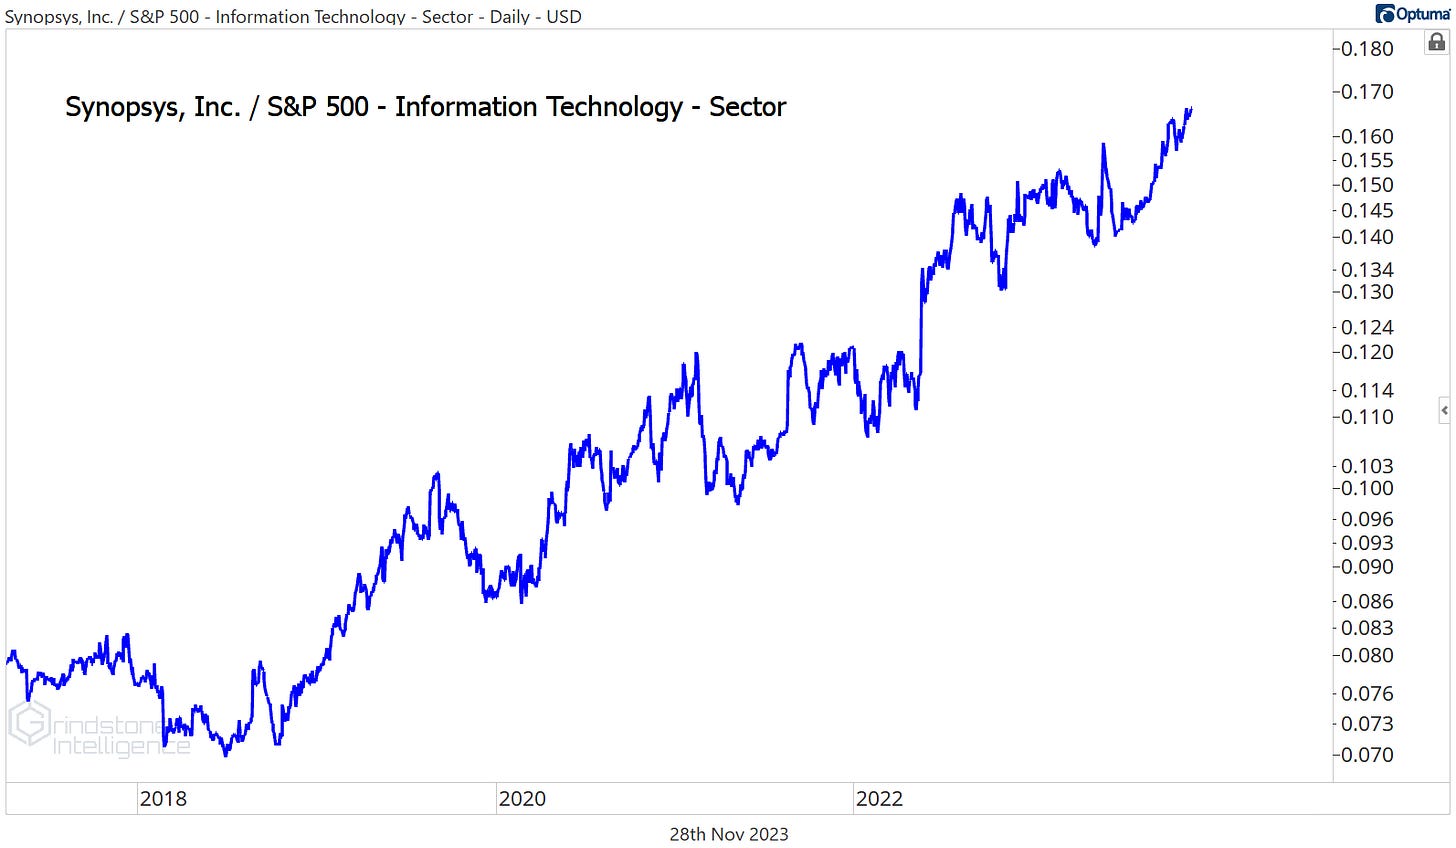
While semiconductor hardware has consolidated, semiconductor software stocks have continued to rise. Synopsys has been one of the best stocks in the world over the last 4 years, and it’s shown little sign of slowing down. Look how it’s done compared to the rest of the sector over that period.
We can use $520 as a level to manage risk on new entries, with a target of $775, which is the next key Fibonacci retracement from the COVID selloff.
Leaders
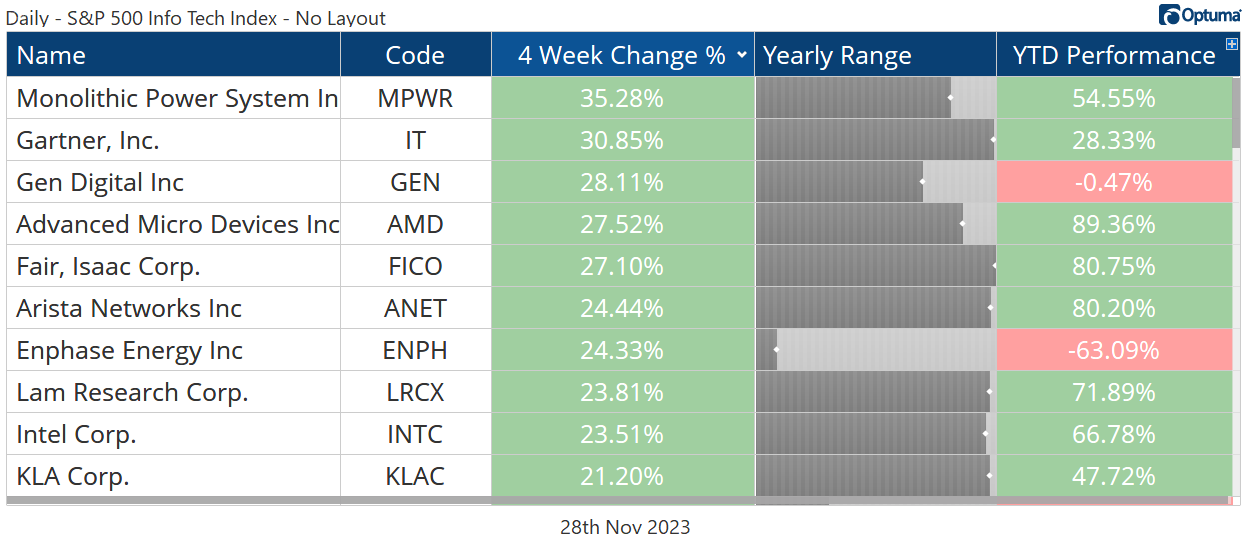
Fair Isaac rose another 27% over the last 4 weeks, continuing a 2-year run of outperformance against the rest of Tech and bringing the stock to all-time relative highs.
We’re targeting $1250.
Arista Networks just broke out to new relative highs as well, thanks to a 25% rally over the last month.
For ANET, we’re targeting $300 which is the 685.4% retracement from the 2018-2020 range, with support at the 423.6% retracement level. We only want to be long above $200.
Losers
Cisco dropped 7% over the last 4 weeks, one of only 3 stocks in the sector to end the period in the red. This is a textbook example of a consolidation resolving in the direction of the underlying trend. Look at the stock compared the the rest of the sector:
A neutral position on CSCO was fine as long as this chart was moving sideways - after all, this could have been a base that led to a reversal. But we never once saw a higher high that confirmed a new uptrend, so there was no reason to get involved from the long side. That’s the value of looking at these charts. We’re not just looking for what to buy. We’re also finding what not to buy.
Noteworthy Charts and Trade Ideas
Apple briefly broke below support in October, but bears couldn’t take advantage. That failed move is reminiscent of a pretty important failed breakdown at the beginning of 2023. We like AAPL above $170 with a target of $250.
Cognizant Technology has a great risk-reward setup as it tries to complete a cup and handle reversal pattern We want to buy a breakout above $72 with a near-term target of $82.
KLAC has been trekking steadily higher vs. the rest of Tech for several years, and we still like it with a target of $610.
IBM is working on a huge base. It just broke to its highest level in 5 years, but if you zoom out, it hasn’t gone anywhere for 20. This is one that’s taken a long time to develop and could take longer still, but it’s worth keeping an eye on for what could a massive move higher toward $320.
This is the most important chart for IBM. There’s opportunity cost in holding this while we wait for a move that may take time to play out, so we only want to hold it if it’s breaking above the 2022 highs relative to the S&P 500.
Motorola Solutions rallied from support at $275 and broke to new highs. We think it goes to $365, so we want to be buying any more pullbacks toward support.
For PTC, we’re zooming out and taking a big picture view after it just broke out to new all-time highs. The stock just went nowhere for two years after it ran into the 161.8% retracement from the entire 1998-2022 decline. We’re setting a target of $230, which is the next key retracement level.
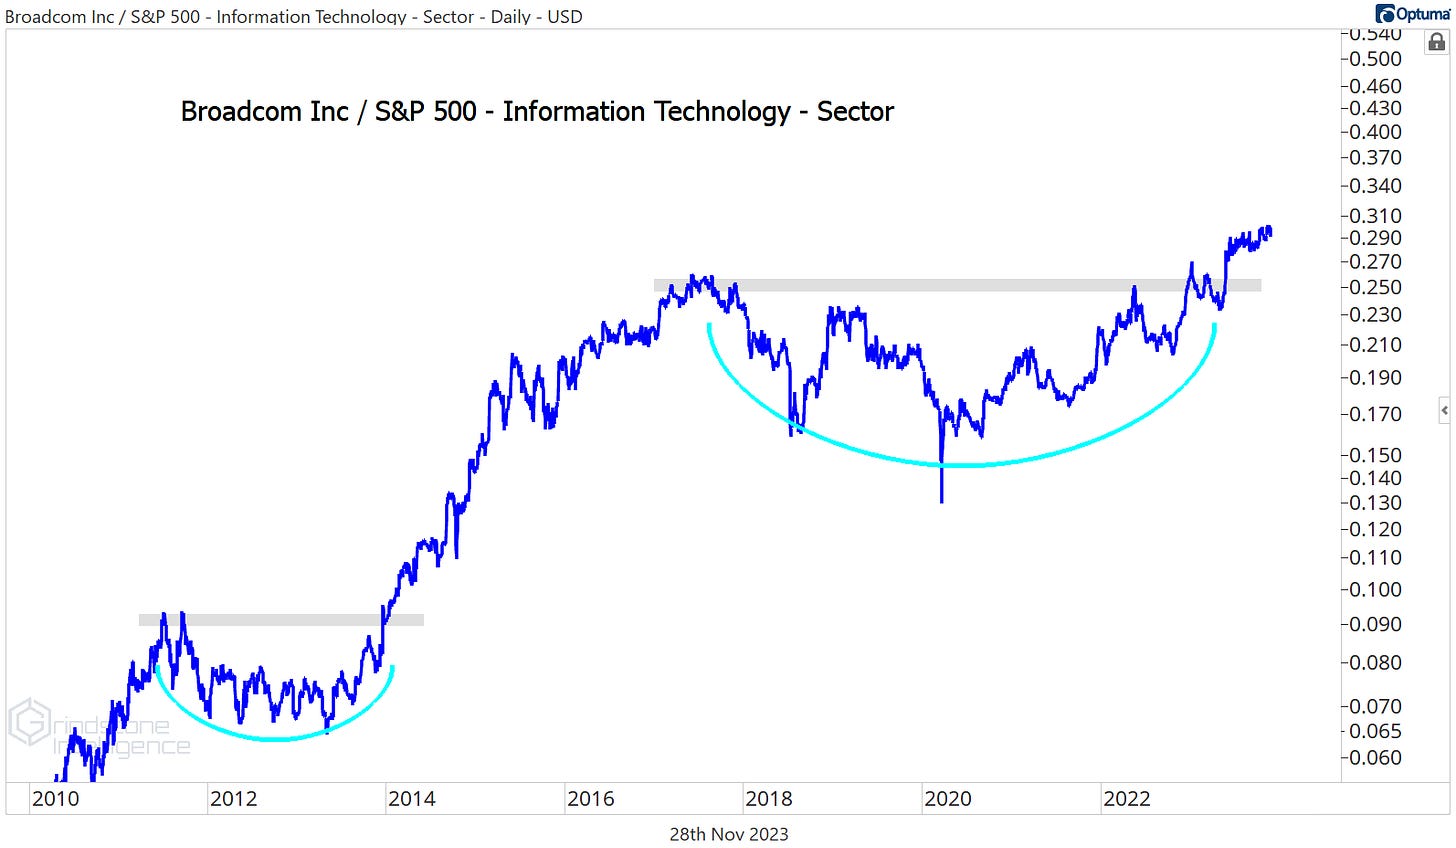
Broadcom is a great setup within the semiconductor space. Unlike NVDA, AVGO is still above its summer highs. We want to buy this as long as it stays above $900 with a target above $1300.
Check out the relative strength in Broadcom, too. It’s setting new highs vs. the rest of the sector after breaking out of a 6 year base. Not bearish.
That’s all for today.
Until next time.


