Technical Market Outlook and October Playbook
It doesn’t take a CMT charter to know that stock prices are in downtrends. Until that changes, we’re better off being underweight US stocks. In fact, we’re better off being underweight just about everything. Bonds are in downtrends. So are most commodities. And cryptos might be the worst of all. Cash has been the only real safe haven – and even that has been gutted by inflation.
US Equities
The S&P 500 is below 4100 and working on undercutting its June lows.
It’s entirely possible that this is a successful retest of the bottom, but we aren’t really seeing the evidence of that. In fact, breadth measures are saying the opposite. More stocks were setting new 52-week lows last week than they were at the June lows. And more stocks were getting oversold. The Advance-Decline line for both the S&P 500 and the broader NYSE Composite broke to new lows, too. There simply isn’t much evidence to support stocks rallying to new highs from here. If the SPX is back above 4100, then I think the conversation changes. But until then the bias is lower.
If there is a bull case to be made, I think it starts with the relative strength out of the Nasdaq. The Nasdaq Composite has yet to break its June lows, signaling some potential risk appetite out there. For now, this one piece of evidence isn’t enough to outweigh everything else we’re seeing, but it is something to keep an eye on.
The Dow Jones Industrial Average is working on a test of its pre-COVID highs. I think this is our line in the sand near-term for US stocks. If the Dow is holding above those 2020 highs, then the S&P 500 and the Nasdaq Composite are both probably holding their June lows, and that’s a bullish development for stocks overall. At that point, we can start talking about double-bottoms and bases to build off of. On the other hand, if the Dow is below those pre-COVID highs, we have to err on the negative side of stocks. The higher probability at that point is further downside for stock prices. In that breakdown scenario, the S&P 500 and the Nasdaq are both looking at tests of their own January 2020 peaks.
Currencies
The Dollar will be the tell. It has been all year. Whenever the Dollar goes up, asset prices fall. When the Dollar fades, risk assets catch a bid. It’s been that way all year:
The big question for the USD now is how it responds to these long-term levels in Asia. The USD/JPY is testing resistance from a major peak from more than 20 years ago.
There are plenty of people who argue price levels from that long ago don’t matter. Perhaps they’re right. We’ll see whether or not the market respects this historical turning point or not. It sure hasn’t shown much respect for resistance in the Chinese Renminbi. It blew right through overhead supply from 2019-2020.
The Euro is far more important than either of these two crosses. It alone comprises more than half of the DXY index. But how the USD responds to key levels vs. its Asian counterparts could give us clues about how it’ll act compared to other currencies. Especially since the EUR is stuck here in no man’s land with no key levels to watch of its own.
Fixed Income
Long-term interest rates are probably due for a reprieve over the next month as they touch 4%. That’s the post-GFC peak for the 10-year Treasury yield, and a pretty important psychological level, too. Normally I don’t put much weight on round numbers, but they seem to matter to the bond market.
We’re also nearing the 2013 taper tantrum peak for 30-year Treasuries. That’s another pretty logical level for rates to take a breather.
We definitely don’t want to be stepping in front of a freight train and getting leveraged long bonds after they’ve gotten absolutely crushed all year, but it might make sense to initiate a small position here.
Bitcoin
We don’t spend a lot of time with cryptocurrencies, but the playbook for Bitcoin is fairly simple: below 19000 you can’t own it. We’ve managed to hold that level for the last 3 months, and the risk is very clearly defined if you want to get involved from the long side. But keep in mind that you’re buying a downtrend. We need to see more signs of buyer strength before turning positive.
Precious Metals
Taken on its own, Gold has clearly resolved lower from a multi-year consolidation range. Support at $1700 has turned into overhead resistance, and there’s nothing appealing about this from the long side UNLESS we get back above $1700. In that scenario, this starts looking like a false breakdown and Gold prices might rip all the way to new all-time highs. Based on what we’re seeing today, that looks like the lower probability outcome.
The most bullish piece of evidence for Gold is how well Silver has held up in recent weeks. Silver tends to just be a more extreme version of Gold – when Gold rises, Silver rises more, and vice versa. So it’s interesting that the two metals are diverging now. Maybe Silver just hasn’t broken down yet. But its relative strength could be a leading indicator of an upcoming rally for the group. In any case, as long as Gold is below overhead supply, the bias has to be for lower prices.
Sector Views
Information Technology
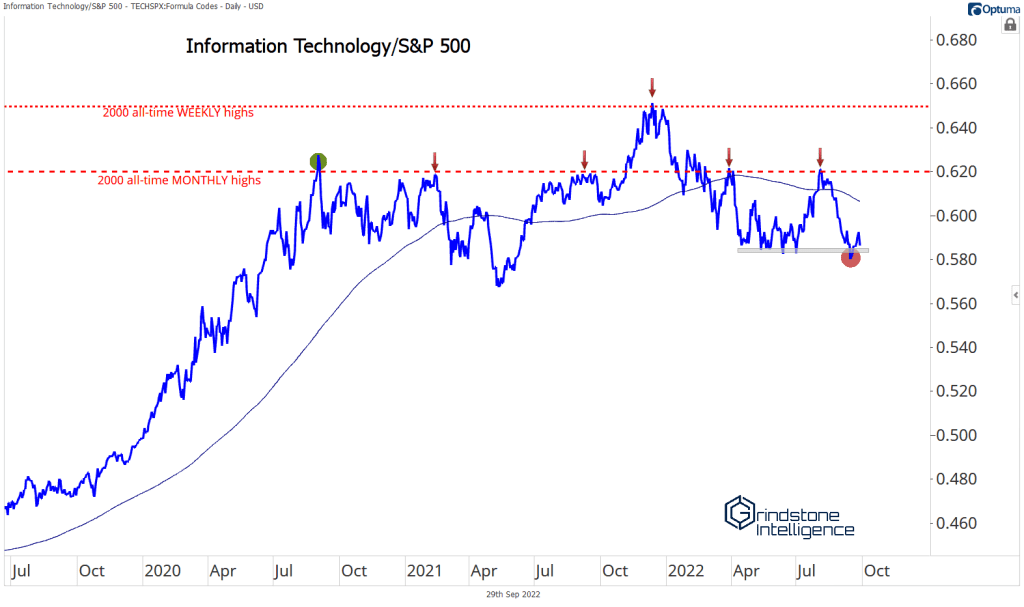
Information Technology is flirting with a pretty significant breakdown on a relative basis. It’s the biggest, baddest, most important sector in the US market, so what happens from here is pretty meaningful for stocks overall. It’s been more than two years since Tech first peaked at those internet bubble highs from more than 20 years ago, and we’re still trying to digest that level.
If the sector fails to hold its June lows, expect to see Tech breaking its lows on a relative basis, too. And based on what we’re seeing in some pretty key industries, a break seems pretty likely. Semiconductors have already tumbled through support.
So has Software:
The evidence suggests Tech overall will soon follow.
Energy
Energy is still top dog for the year, despite having peaked in June. As long as Energy remains above its 2000 lows on a relative basis, we need to assume it’ll continue to be a leader.
Marathon Petroleum is still in a structural uptrend and has yet to fall below its 200-day moving average. The 2018 highs offer near-term support at $85, while the 161.8% Fibonacci retracement from the entire 2018-2020 decline is up near $130.
Utilities
Utilities have been working for most of the year, but they’ve stalled out at relative resistance from 18 months ago. It no longer makes sense to overweight this group while they’re stuck below overhead supply, so a neutral stance is appropriate for now. We would turn more positive after a breakout or if we saw healthy consolidation in this range over the next month.
Real estate
One thing we never want to do is ignore new 52-week lows. That’s what we’re seeing out of the Real Estate sector on a relative basis. There’s not much reason to be long Real Estate until we see more constructive action.
Industrials
The Industrials sector failed to hold its breakout last month, but it’s still one of the most constructive sectors in the index. It’s continually set higher lows since bottoming vs. the S&P 500 in December, and we expect the value-tilted group to lead for the coming months.
Huntington Ingalls is among the best-positioned names in the space. They were setting new 52-week highs as recently as August, and so far, have managed to hold on to their breakout amid the market decline.
Communication Services
Just a few years ago, there was no worse place to be than Energy stocks. Oil prices were stuck at low levels, and no matter whether the market overall was rising or falling, Energy just couldn’t seem to get anything going. My favorite quote from around that time (though I can’t remember who it was from) was, “Any time I start thinking it’s a good time to buy Energy, I make myself lie down for a little bit until the feeling passes.”
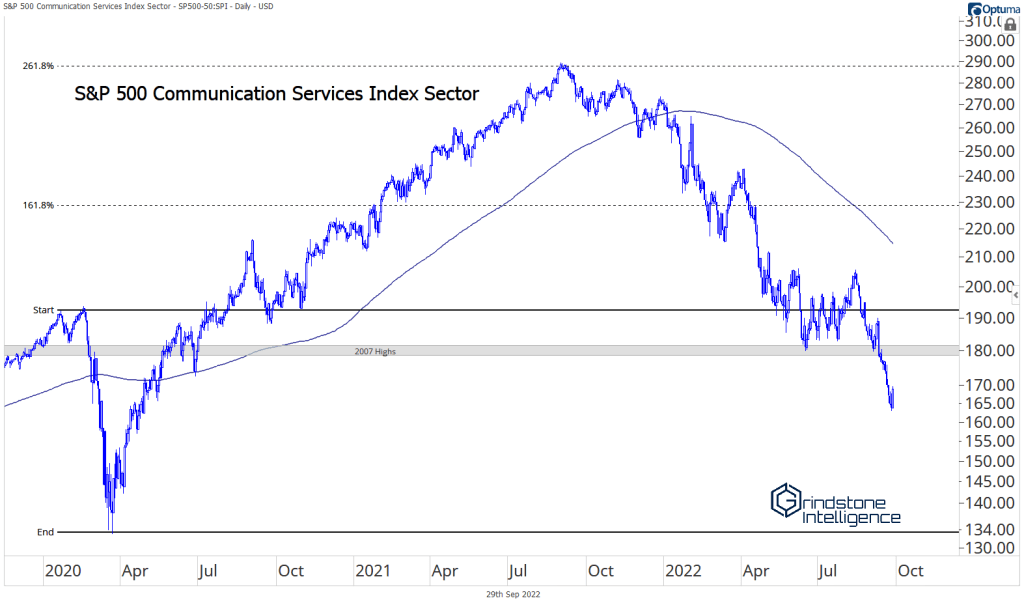
That’s the world we live in right now, except instead of Energy, it’s Communication Services. No matter which way you slice it, Communication Services is in a downtrend and there’s no good reason to be heavily invested there. This isn’t a great spot to be initiating new short positions, but we don’t want to long unless we’re back above those 2007 highs.
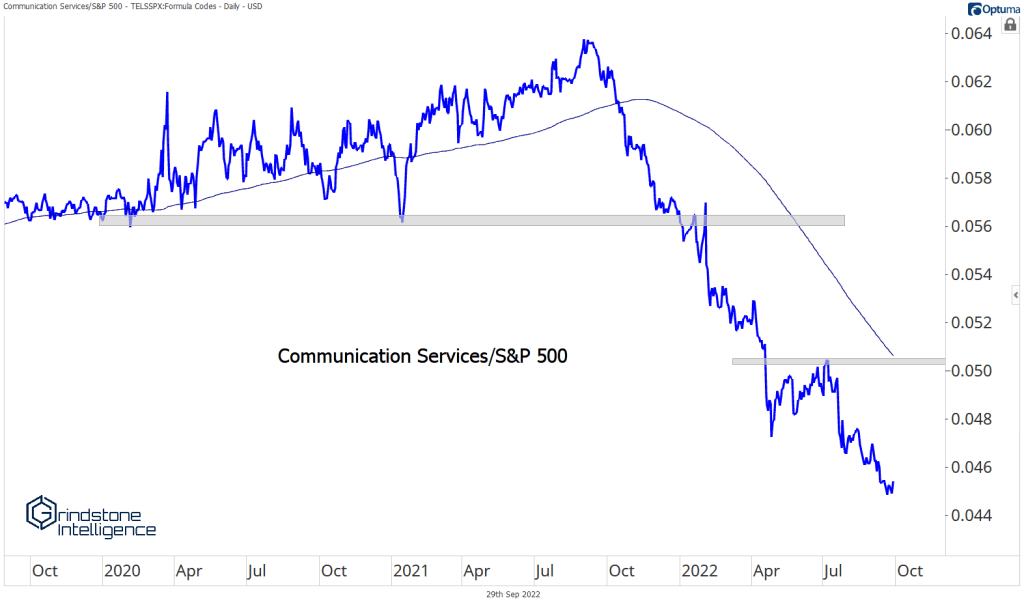
On a relative basis it’s no different. Communications is in an established downtrend compared to the S&P 500 and we want to be underweight unless the sector is back above the swing high from early July. Until then, any rallies should be treated as mean reversions.
Can Communications outperform going forward? Sure. But the odds aren’t in our favor, and we’d much rather be short than long that sector in the current environment. At some point, there will be an opportunity to get involved – again, look at Energy, which has been a great sector over the last 2 years – but we need to see some evidence of a bottom before we can turn bullish on the group. For now, this is the worst sector in the index, and we need to treat it as such.
Here’s a good example of why we don’t own things that are in downtrends. Could the bottom be in now? Absolutely. But we could have said that at any time over the last year, and it’s only gotten worse.
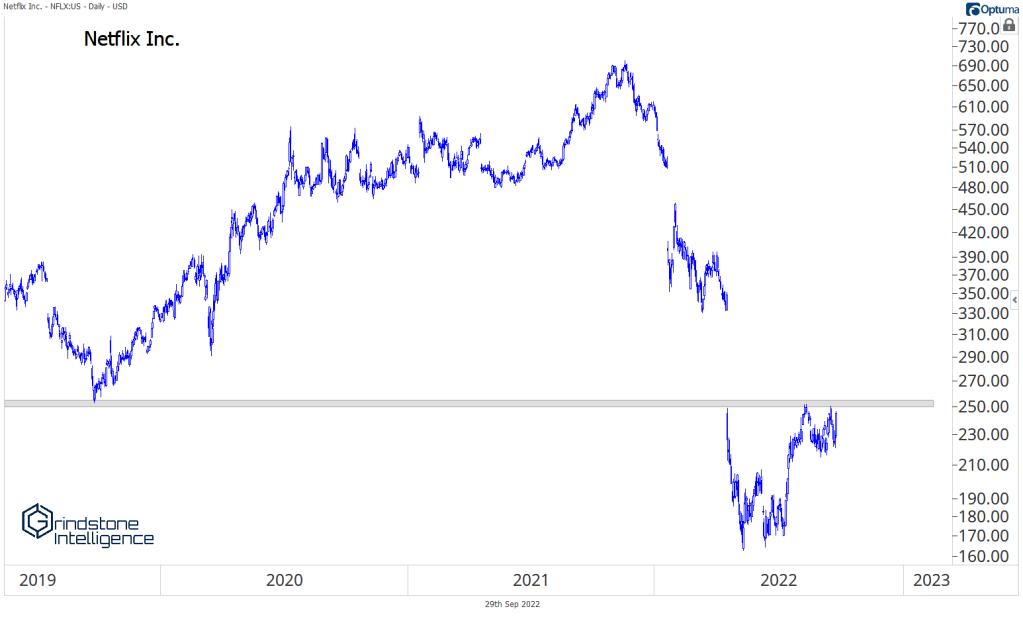
Now if you absolutely HAVE to own something here, we’d recommend taking a look at names showing relative strength. How about Netflix trying to resolve higher from this multi-month range?
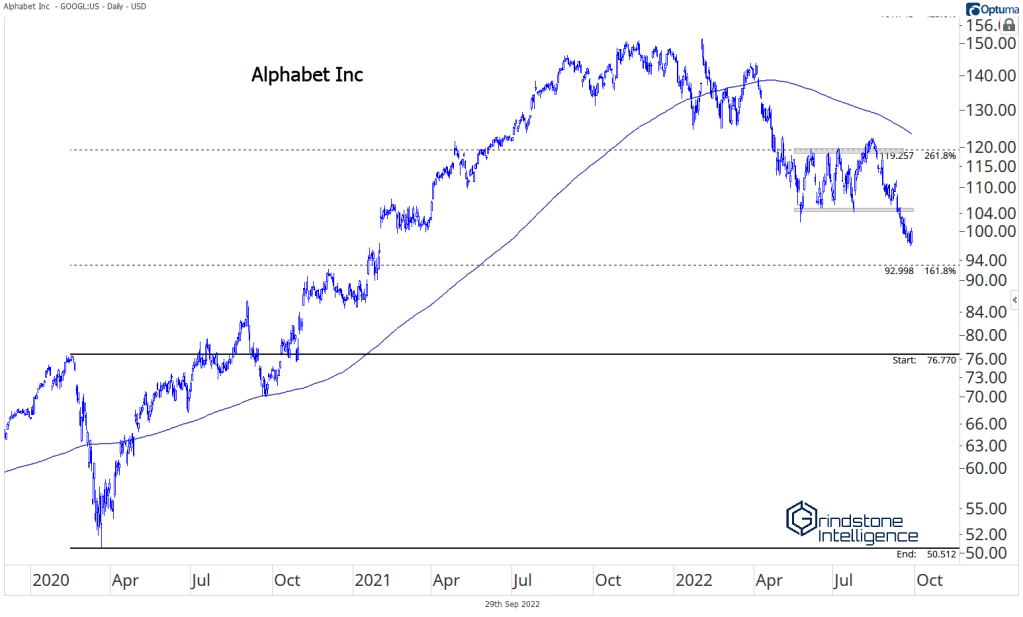
Unfortunately, most of the sector looks like GOOGL instead, setting new 52-week lows. Definitely not in an uptrend.
Playbook and Model Portfolio
Sector Outlook
The Grindstone Intelligence Sector Outlook is based on our top-down technical approach. These ratings are based on our views over the next month but are subject to change with incoming data. If we feel the need to adjust our ratings before the next scheduled newsletter, we will notify subscribers via email with updated views and our justification.
Grindstone Model Portfolio
The Grindstone US Equity Model Portfolio is a hypothetical allocation designed to align with our Sector Weightings View and seeks to outperform the S&P 500 Index over the long-term. The Model will invest only in exchange-traded funds that track sectors, industries, or categories of stocks. No individual stocks or cash positions will be used in the Grindstone US Equity Model Portfolio. Changes to the model portfolio will be communicated via email to subscribers, and official ‘trades’ will be executed at the next closing price.
Please reach out with any questions. We’re happy to clarify any of our opinions, but the nature of our publication prevents us from providing personalized advice. For those questions, please contact your financial advisor.
The post Technical Market Outlook and October Playbook first appeared on Grindstone Intelligence.


