Ten Charts I’ll Be Watching in 2022
Welcome to 2022. By now you’ve probably read a dozen or more market outlooks for the year, with predictions on everything from interest rates to mid-term election results. Those of you that have followed Means to a Trend for awhile know that I’m not in the business of making predictions on this site. Instead, I try to identify current trends in the market and the economy, and then do my best to point out the risks to those trends. Here are the trends I’ll be keeping a close eye on over the coming months.
Breadth
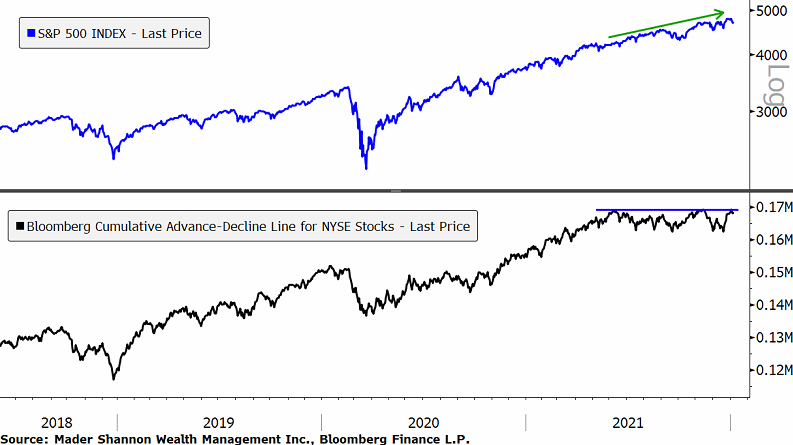
Though the benchmark S&P 500 index had a fantastic 2021, breadth was weak in the second half of the year – the cumulative advance-decline line for NYSE stocks stopped going up in June, while the index trekked steadily higher. Some measures of market breadth have begun to show improvement, and it’s comforting that the A/D line hasn’t gotten worse, but it’s unlikely the S&P can repeat last year’s performance if the black line is below last summer’s highs.
Small Cap Struggles
You’d be hard pressed to find a more frustrating chart than the Russell 2000 index of small cap stocks. This group peaked in the spring of 2021 and then spent the balance of the year stuck in a tight, choppy consolidation range (excluding a handful of days in early November, when prices broke out to new highs and then promptly failed). It’s paid to favor large cap over small – that won’t change as long as the Russell is rangebound.
Technology Outperformance
Ok so this is actually three charts, but since this is my blog and I can do whatever I want, I’m only counting it as one. Sue me. The Information Technology Sector is in the midst of challenging its all-time high relative to the S&P 500. The monthly closing high from 20 years ago was the stopping point in September of 2020, when Tech stocks briefly got hammered on both a relative and absolute basis. We’ve since surpassed that high:
But now we’re having trouble with the weekly closing highs from the Internet bubble:
If we zoom in on more recent action, we can see clearly how much respect prices have for those former turning points. Tech is the largest and most important sector in the index. It won’t be a leader going forward unless it can absorb all this overhead supply from two decades ago. And a relative decline from here would be a major headwind for equities.
U.S. Dominance
For U.S. investors like myself, there’s no place like home. Domestic indexes have outperformed their international competitors for most of the last decade, and 2021 was no exception. The Bloomberg World ex US index, stopped rising early last year and has trended sideways since. Emerging markets, dominated by China, have spent most of the last 12 months in a steady decline.
For now, there are no signs of fading U.S. dominance, but all trends eventually come to an end, and this one has certainly reached an advanced age.
Labor Shortage
It’s hard to choose just one chart that sums up the tightness of labor markets. Unemployment is back below 4% and near the lowest levels recorded in the last 60 years. Wages are rising, especially for lower-wage earners. Small business owners are citing labor as the number one problem facing their businesses. This stat is my favorite though: there are more than 1.5 jobs available for every unemployed worker in America.
If/when the pandemic fades, will a surge of new applicants enter the labor force? How will the answer affect supply chains and wage gains?
Input Costs
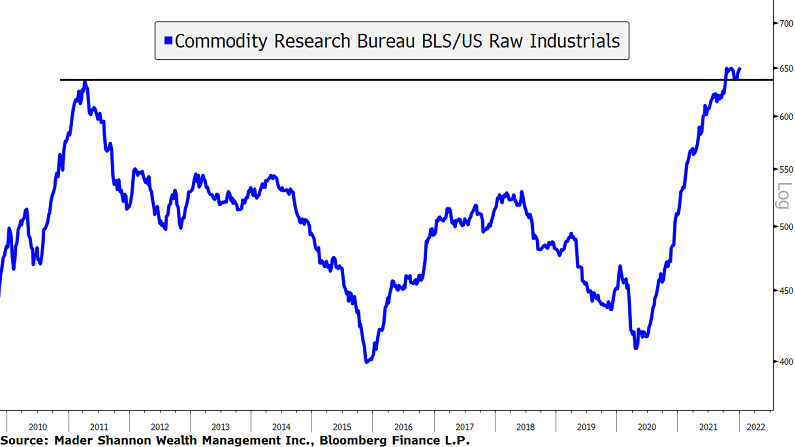
The causes have been fodder for plenty of debate – a surge in demand, capacity constraints, Covid disruptions, fiscal and monetary stimulus, etc. – but no matter the reason, input costs have surged over the last 18 months. The CRB Raw Industrials Index is hovering near its 2011 highs.
The future direction of prices for this basket of commodities (along with the resolution of the labor questions above) will be a major factor in business profitability in the coming year.
Profit Margins
Despite rapidly rising input and labor costs along with unprecedented supply chain disruptions that have limited sales volumes, businesses posted their highest profit margins in decades in 2021. Bank reserve releases (after large reserve provisions in 2020) accounted for some of the margin strength, but a considerable amount was attributable to good old fashioned pricing power. Numerous company executives have noted the low level of demand elasticity in the current economic environment. Analysts expect the trend to continue, and project even higher margins 12 months from now:
Whether they’re right or not will help determine if index earnings will grow faster or slower than the long-term average of 7%.
Inflation
How well businesses are able to pass through input costs to customers will also impact future consumer price inflation. Inflation is still the big wildcard for monetary policy and many Fed officials still expect price pressure to subside in the latter half of the year as supply problems correct and demand levels out. In the eyes of policy makers, the risk is that recent events have raised the public’s expectations for inflation, which can make them more accepting of price increases and, in turn, feed a spiral of higher and higher prices.
Interest Rates
While inflation was running rampant in 2021, bond yields remained remarkably subdued. The U.S. 10-year Treasury yield peaked in March, when every textbook would tell you that interest rates should be rising to offset more rapid losses in purchasing power. The surprising stability of the bond market was a tailwind for equities, especially growth stocks, whose valuation can be significantly altered by changes in the discount rate.
Now rates are challenging last year’s highs.
A breakout would spell trouble for bond prices, and perhaps shift the balance of power in equities from growth to value.
Growth vs. Value
Growth vs. Value has been a mess for the last year. Growth peaked relative to Value in September 2020 after a huge run-up from the COVID lows in March of that year. The two have alternated in leadership roles ever since.
Value is the most recent outperformer, having led since late November, and now the ratio is back to the middle of the range.
Consolidations like this should resolve in the direction of the underlying trend, which in this case favors Growth. But if we find ourselves breaking last summer’s lows, it could be a sign that Growth’s decade-long reign has come to an end.
Nothing in this post or on this site is intended as a recommendation or an offer to buy or sell securities. Posts on Means to a Trend are meant for informational and entertainment purposes only. I or my affiliates may hold positions in securities mentioned in posts. Please see my Disclosure page for more information.
The post Ten Charts I’ll Be Watching in 2022 first appeared on Grindstone Intelligence.


