The 8 Charts That Defined 2022
Another year is nearly gone, and it’s been one for the books. Let’s take look at what made 2022 what it was.
Inflation
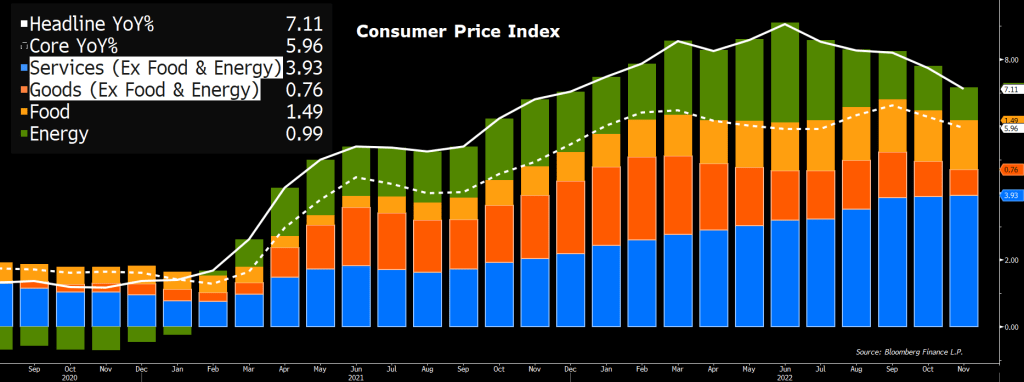
Inflation. How could a discussion of the last 12 months start anywhere else? Prices spiraled out of control in the aftermath of the unprecedented fiscal and monetary stimulus that accompanied the pandemic. At first, the surge in prices was led by goods. With spending on services crimped by lockdowns, people instead spent on things they could touch and hold. At the same time, supply lines for those goods were disrupted.
The economists were right, in part. Those price spikes were transitory. It just took much longer than they’d initially expected for the price pressures to subside. The prices for core goods and energy appear to be stabilizing.
We can’t say the same for the price of services, though. Inflation may have peaked, but the days of 2% per year seem far away.
The Fed
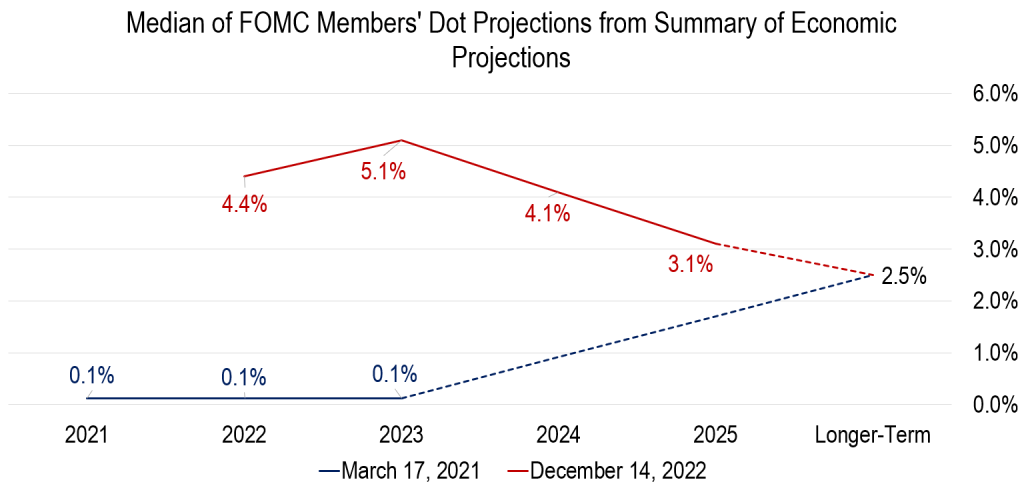
It’s the job of the Federal Reserve to maintain price stability in the United States. In March 2021, when the monetary authorities still believed in the merits of ‘transitory inflation’, the Fed forecasted interest would remain at the zero lower bound until at least 2024.
Instead, the Federal Funds target rate has been lifted by 4.25% in 2022. FOMC participants believe they’ll need to raise it above 5% next year.
Recession Ahead?
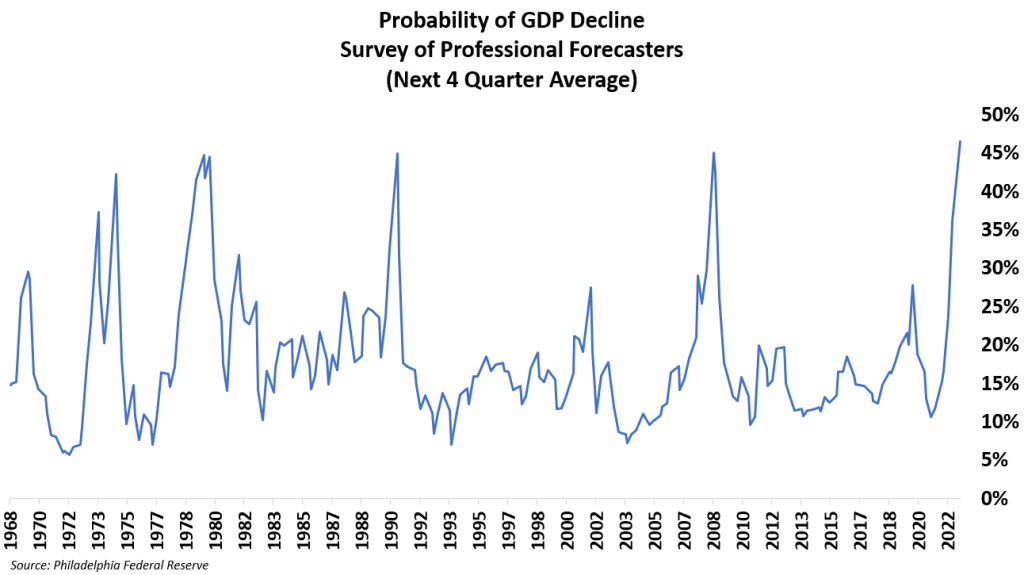
The Fed has a history of going too far and driving the economy into recession. Two consecutive quarters of GDP declines to start the year weren’t enough to garner a recession declaration from the National Bureau of Economic Research, though, and growth has since rebounded.
Now, an alarming number of forecasters believe recession is coming next year. Those pessimistic forecasts are (at least partly) to blame for the weak stock market action.
Bond Market Turmoil
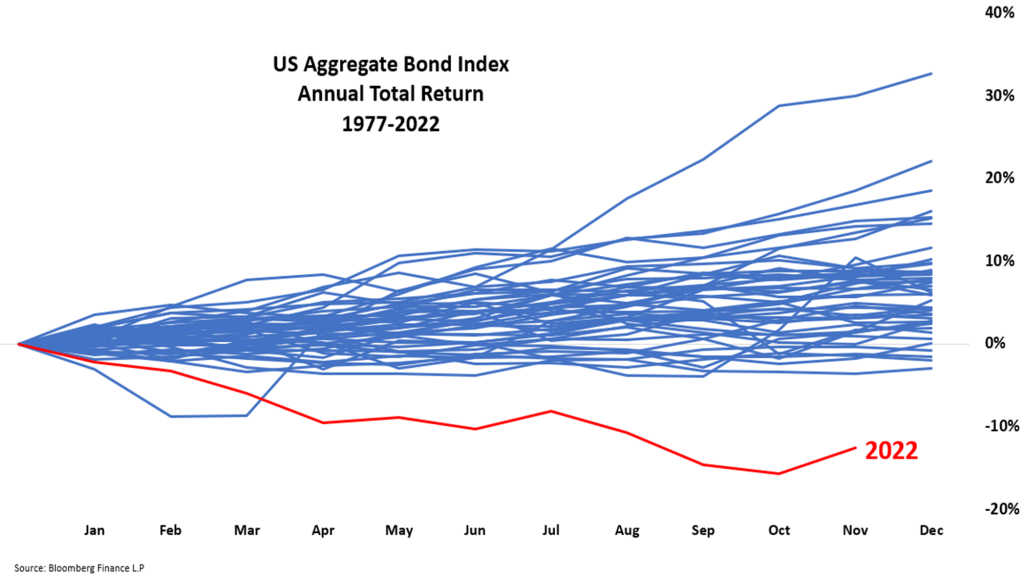
With the Fed hiking short-term rates and inflation expectations driving up longer-term ones, the bond market had its worst year in decades.
When stock prices are under pressure, investors often flee to fixed income for safety. Bonds offered no such safety this year. Of the last 50 years, 2022 stands alone.
Energy Outperformance
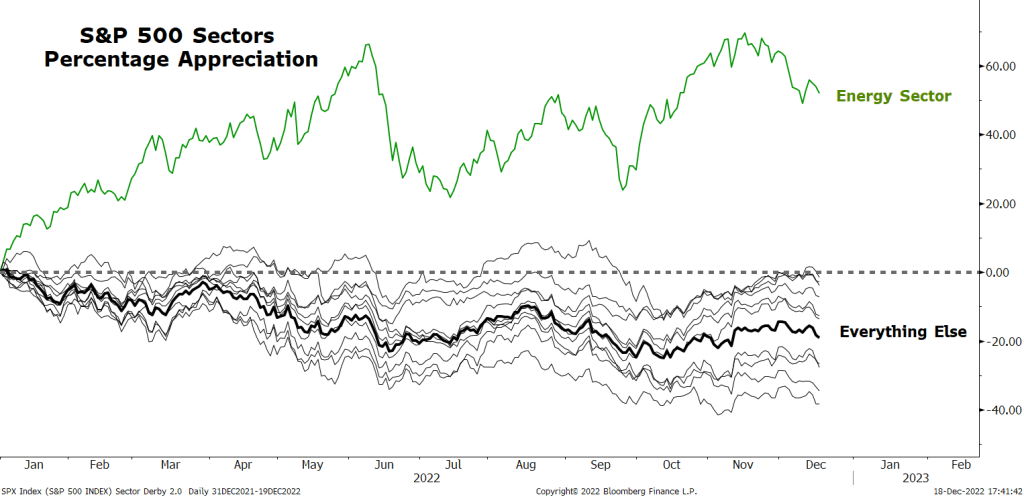
The bond market didn’t offer safety to investors, and neither did anything else. Except for Energy. The S&P 500 Energy Sector has risen more than 50% this year after being the top performing group in 2021 as well. Following a decade of underperformance, I guess Energy was due for a good run.
What’s most remarkable about their dominance this year? Not a single other GICS sector finds itself in the green as we enter the final two weeks of trading.
The US Dollar
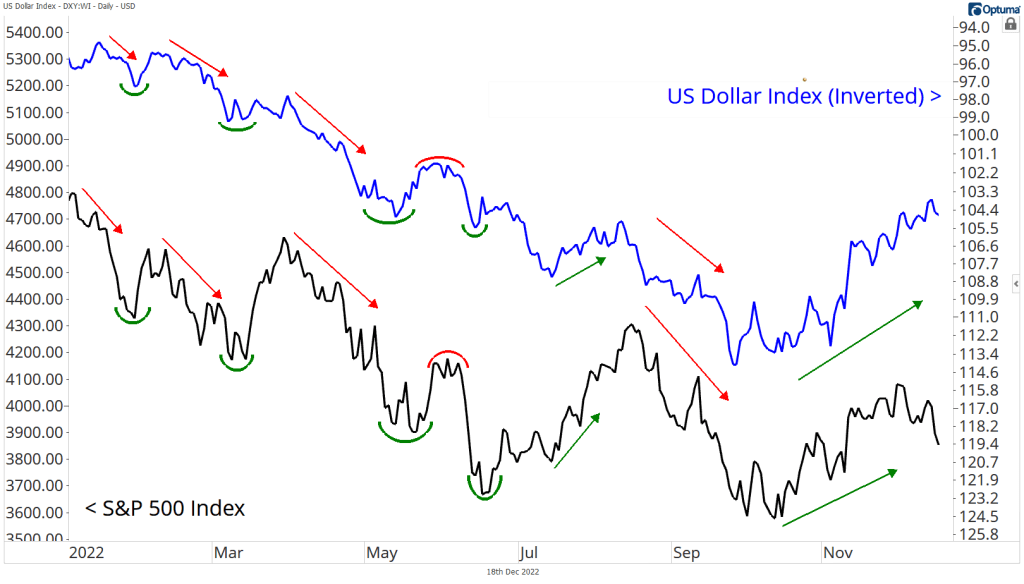
If you’ve been following Means to a Trend, you know the Dollar is the only thing that’s mattered in 2022. Each time the Dollar has set a new high, equity markets have dropped to a new low. When the US Dollar index finally peaked in September, the bottom in stocks wasn’t far behind.
A divergence has appeared in recent weeks, as stock prices have retreated while the Dollar continues to fade lower. It could be this relationship will end with the turning of the calendar, but the correlation has been one to watch in 2022.
Technology Stocks Stalling
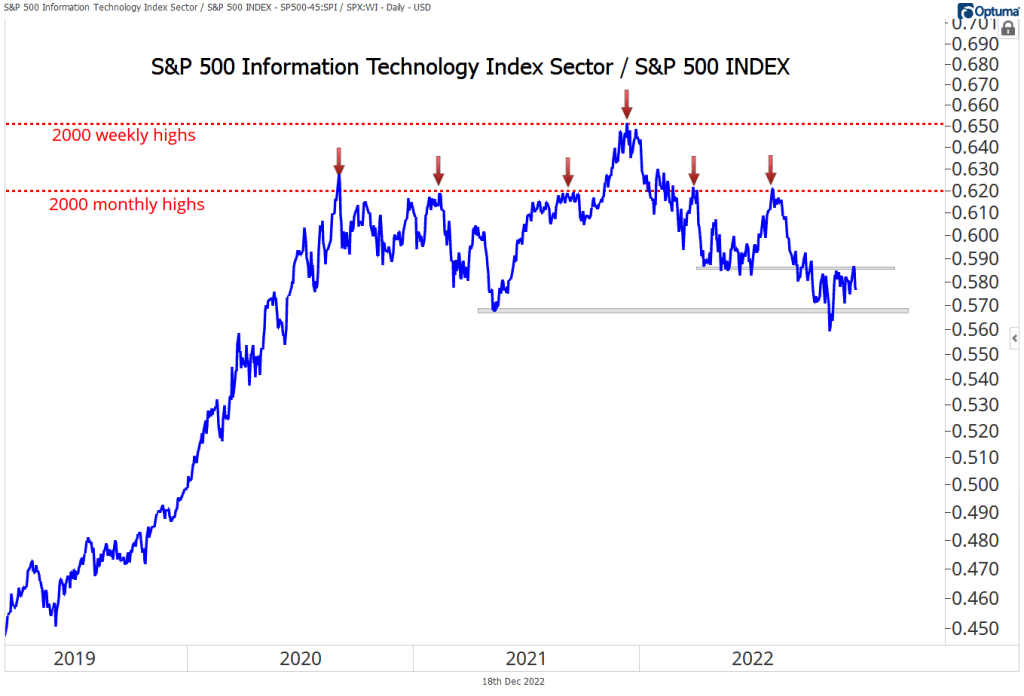
This has been one of my favorite charts all year and will continue to be in 2023. Information Technology stocks ended a decade-long run of outperformance when they ran into their Internet Bubble highs on a relative basis. Think prices from more than 20 years ago don’t matter? Check out the chart below.
Tech peaked vs. the rest of the market in December 2021, then has led the way on the downside in 2022. Leadership has shifted over that time, away from the high-flying growth stocks that dominated the 2010s, and into Value names that have long been out of favor.
Crypto
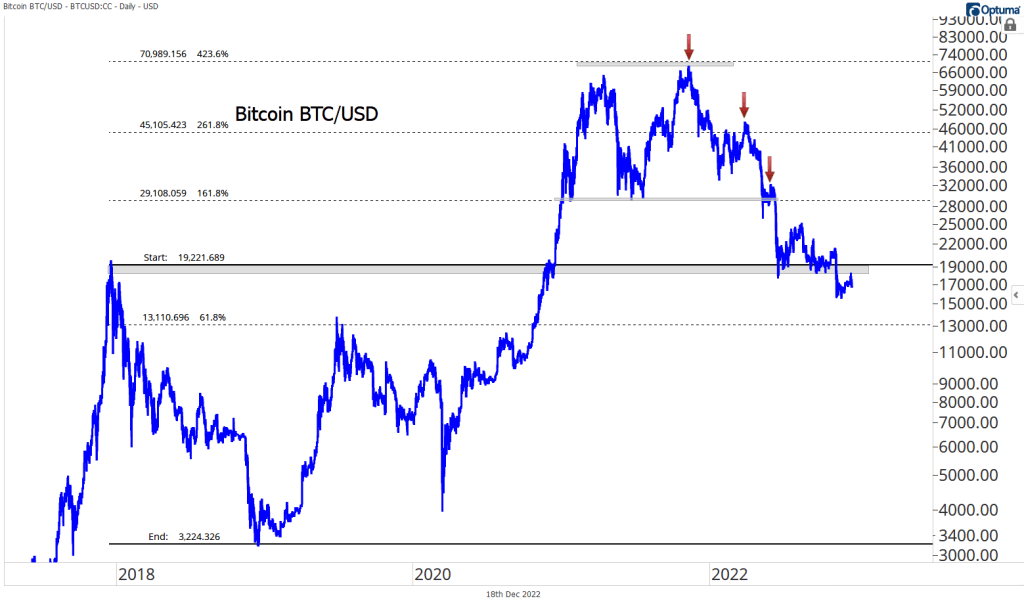
No discussion of the year would be complete without mentioning the cryptocurrency meltdown. Bitcoin, the original crypto, has fallen more than 75% from its peak, a decline that far outweighs the decline of equity and bond markets. Fibonacci retracements from the 2017-2018 decline have been a helpful guide in identifying areas of potential support and resistance along the way. Now, the former 2017 highs are clear overhead resistance.
The magnitude of Bitcoin’s decline isn’t out of the ordinary, though – at least not in the world of digital assets. What made this year different was the growing impact of crypto meltdowns on the real world. The ramifications of the 2017-2018 selloff were limited, because crypto was still a rather obscure asset. This time, though, a mass of retail and institutional investors have felt the blow. Billions of dollars have evaporated, and the collapse of FTX has shaken the industry to its core. Crypto may not be going away, but it’s forever changed.
Thanks to all of you for following along in 2022. If you haven’t heard, I’ve got big news! Means to a Trend is now part of Grindstone Intelligence, LLC.
Nothing in this post or on this site is intended as a recommendation or an offer to buy or sell securities. Posts on Means to a Trend are meant for informational and entertainment purposes only. I or my affiliates may hold positions in securities mentioned in posts. Please see my Disclosure page for more information.
The post The 8 Charts That Defined 2022 first appeared on Grindstone Intelligence.


