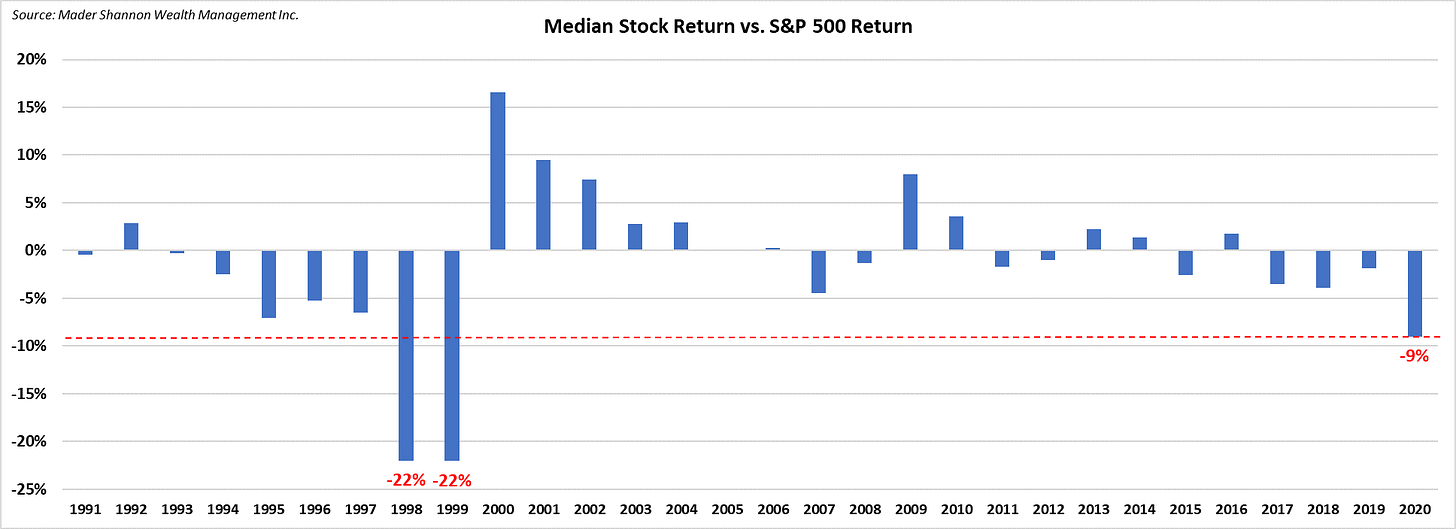
The Median Stock is Lagging the S&P 500 by the Most Since 1999
With 6 months almost behind us in 2020, the median S&P 500 stock is trailing the year-to-date index return by 9%. Should that hold, it’ll be the worst relative performance since the Dotcom era, when median stocks underperformed the index by 22% in 1998 and 1999.
For stock-pickers, finding winners is as tough as ever. Fully 2/3 of stocks in the index have lagged the benchmark return – something else that hasn’t been seen since the turn of the century.
But the similarities end there. The market soared during the Dotcom boom of the late-90s, rising more than 20% each year. So far in 2020, the S&P 500 has fallen as much as 35%, risen 45% from its low, and now sports a negative YTD return.
And in contrast to 1998 and 1999, 2020 lacks the big winners.
During the late 90s, index returns were skewed higher by large numbers of stocks turning in outsized returns. In 1999 alone, 30 stocks in the S&P 500 more than doubled. The best 4 performers quadrupled. Check out the distribution of member returns below.
The returns are shaped like a bell-curve, but with a cluster of returns that, if space permitted, would extend far to the right of the chart. That cluster of returns is known as the ‘fat-tail’ of the curve.
Any market historian can tell you that one key to investing success is capturing those ‘fat-tails’. Over the long-term, most stocks lag the index, and the majority of returns come from the small group of stocks that generate out-sized returns. Stocks portfolios are diversified with the hope of catching one or two of the fat-tail stocks.
But in 2020, the tail isn’t so fat. The distribution is almost normal.
In addition, the returns are tightly clustered – the standard deviation is remarkably subdued compared to even the last few years, let alone 1998 and 1999.
It certainly doesn’t support a narrative that a handful of stocks are generating outsized returns and dragging the index higher.
In fact, less than 1% of S&P 500 stocks have outperformed the index by more than 50% this year. A lot can change with half the year still to go, but that’s the lowest number in at least the last 30 years.
The fat-tails aren’t to blame for the index crushing the average stock in 2020. Instead, blame the mega-caps: Microsoft, Apple, Amazon, Alphabet, Facebook. Each has a outperformed the index by a substantial, though not extraordinary, margin this year. But in a market cap-weighted index, sometimes market cap is all that matters – those 5 names alone comprise more than 20% of a 500-stock index.
This isn’t the 90s, where an internet revolution drives dozens of stocks to triple-digit annual returns. Instead, index returns are skewed higher by the sheer size of a mere handful of stocks. It’s different this time.
The post The Median Stock is Lagging the S&P 500 by the Most Since 1999 first appeared on Grindstone Intelligence.


