The Myth of the ‘Average’ Return
“Don’t try to time the market. Stocks average 10% returns over the long-term. Just keep buying. Stick to the plan over the long-term, and everything will work out.”
We hear it all the time from financial advisors and investment gurus these days, and not for nefarious reasons: Humans are dumb. Too often, we allow emotions to control investment decisions, and our many behavioral flaws cause us to make sub-optimal decisions. That’s a big reason why so few investors are able to beat, or even match, the returns of benchmark indexes over time – our brains seem programmed to sell at the bottom and buy at the top.
One of a financial advisor’s most important jobs is to help their clients overcome those psychological short-comings. And the easiest way to do that is to entirely remove decision-making from the process. Thus, passive investing has become a dominant force in the industry.
Unfortunately, it’s been fueled in part by a bunch of narratives and statistics that mask the reality of historical returns.
It’s true that large caps stocks have averaged 10% gains over the last 100 years or so. But the odds that any of us will match that 10% annual gain are probably a lot lower than you think – even over extended timeframes. A single number simply isn’t sufficient to describe what’s actually happened.
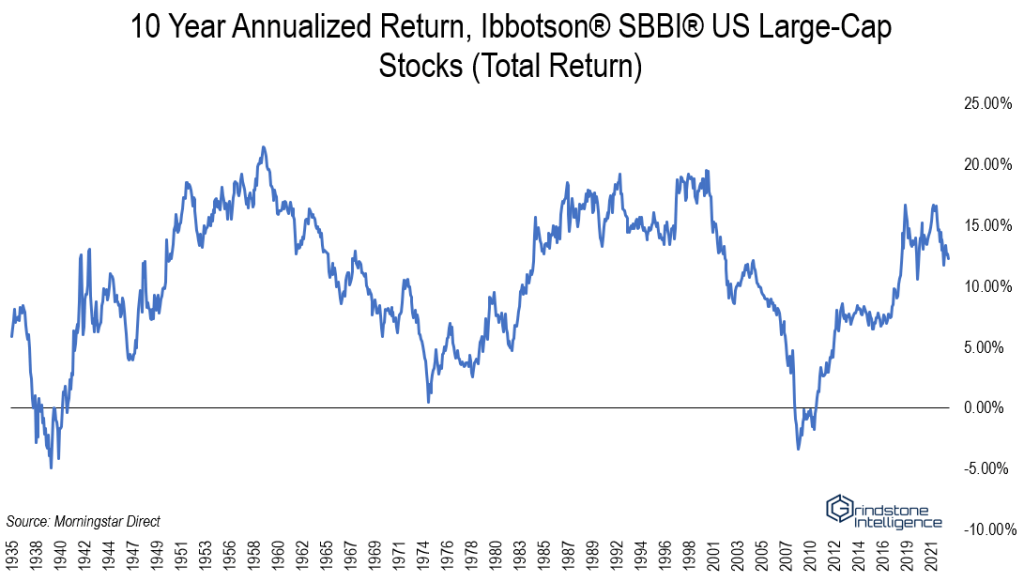
Consider a 10-year investment horizon. Starting with the late-1920s, large cap stocks have gained as much as 21% per year…. or dropped as much as 4.9% per year. For a $5,000 initial investment, that’s the difference between $34,000 and $3,000!
Hold on, you say. Ten years isn’t that long. If you started investing at a young age, you’ve still got plenty of time! You’re right. So what about 20 years?
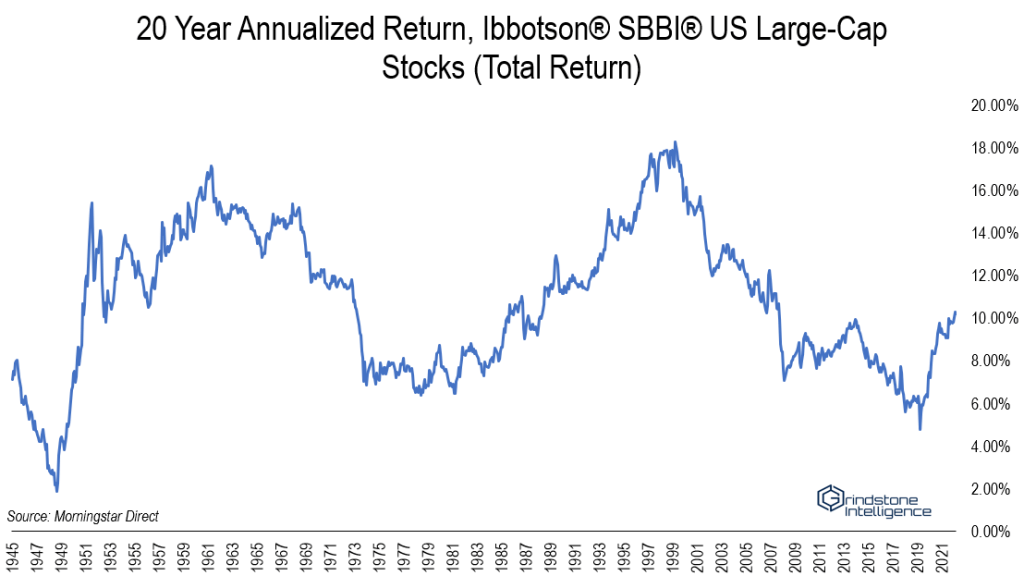
The good news is you’ve at least managed to achieve a positive return no matter what start date you were gifted. The bad news is returns are still wildly unpredictable – just 20% of the data fall within 1% of the central tendency. The maximum endpoint of that initial $5,000 is now a whopping $143,000, but the unlucky investor ended up with just $7,300. Good luck making a financial plan with that!
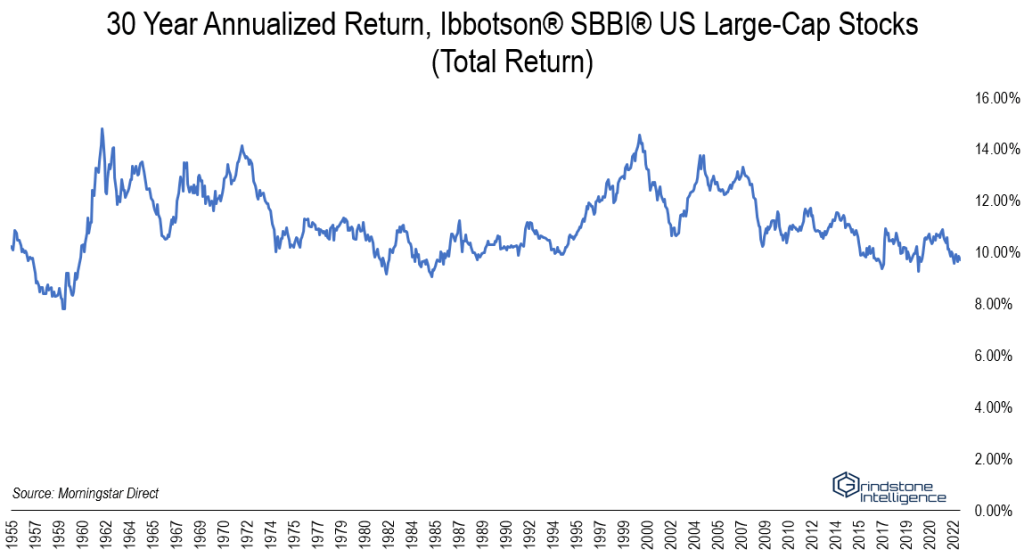
Luckily, if everyone managed to ride out the turbulence of their first 20 years and make it to 30 years, the distribution of returns tightens considerably. Even investors born at the worst time managed an annual gain of nearly 8%. Still, a 7% gap between the best and worst periods, compounded over 30 years, becomes a vast difference in experienced returns: $300,000 vs. $50,000.
The problem is, we’re still ignoring a few realities. For one, returns are nominal, but we tend to think in inflation adjusted terms. The median salary in the United States is about $70,000 today. If wages track the Fed’s annual 2% inflation target, that same median salary will be closer to $130,000 in 30 years. Our future buying power and retirement nest eggs need to be similarly adjusted. That’s harder than it sounds. It’s difficult to conceptualize how living expenses will change and adjust our financial plans accordingly, and it’s just as hard to guess the future path of inflation (especially after the last few years). It’s much easier to simply look at historical returns on an inflation-adjusted basis
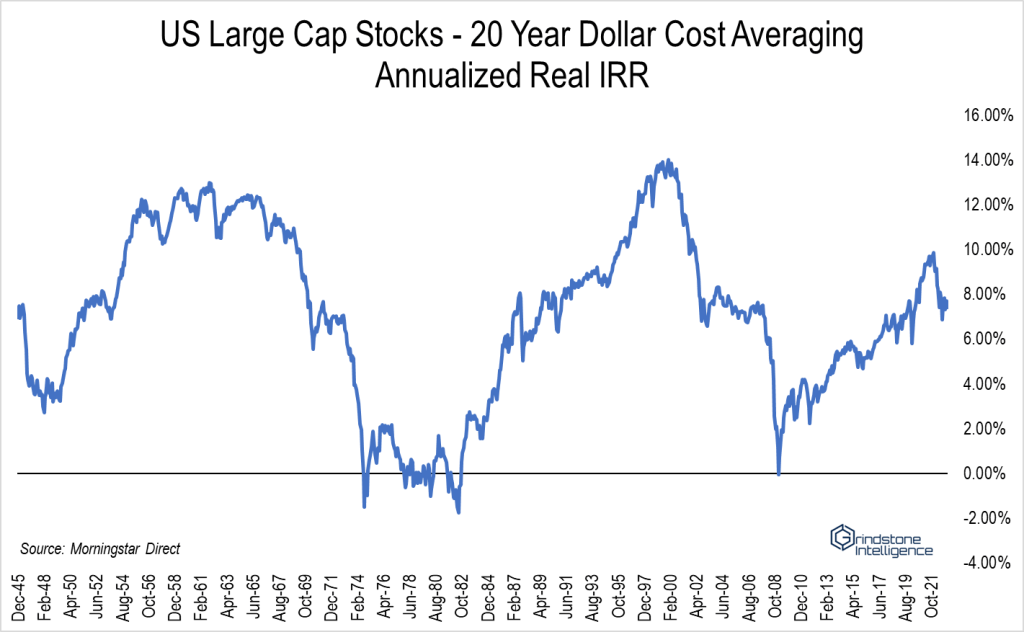
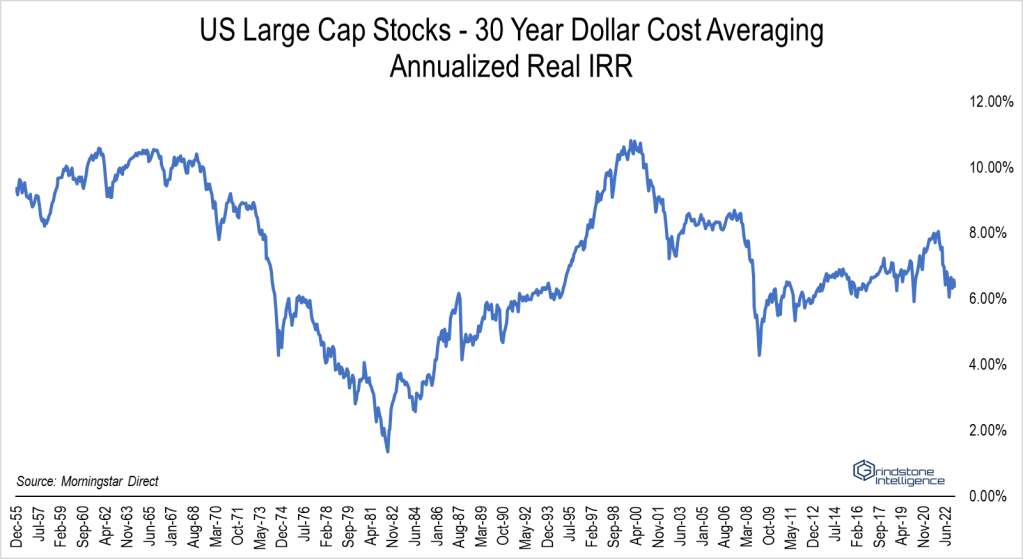
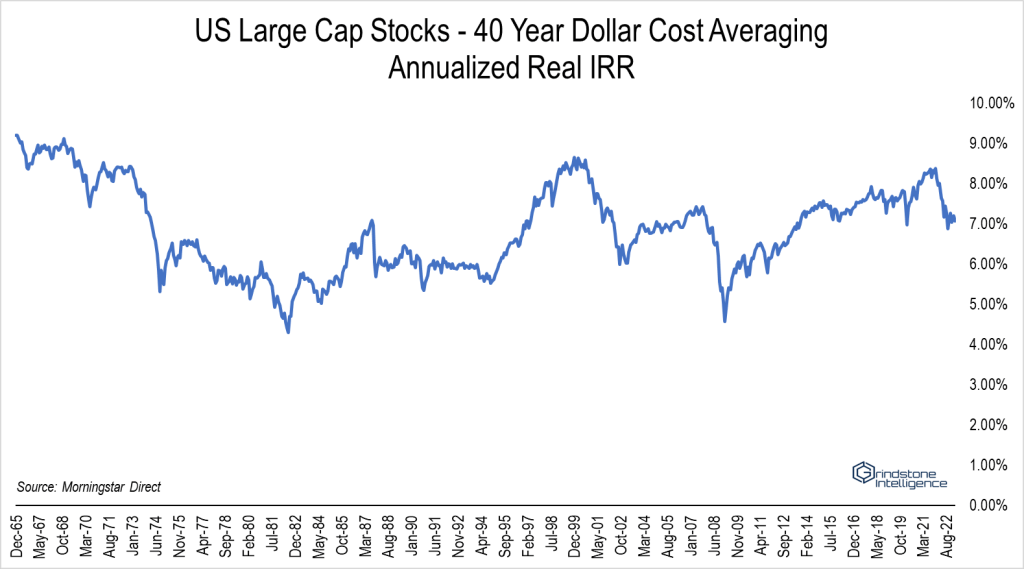
Additionally, we aren’t actually investing like in the examples above. Nobody invests their entire nest egg and then waits for 30 years – we’re making contributions over time. And the mechanics of dollar cost averaging widen the dispersion of historical returns.
The effects of inflation and periodic contributions to an investment portfolio can push internal rates of return below 0% even when investing for 20 years! Let’s say you invested $100 each month for those 20 years, for a total of $24,000 in contributions. That strategy would have yielded a retirement portfolio as large as $130,000 in today’s dollars, based on historical returns. Or you could have ended up with just $20,000 – less than the value of your contributions.
Over a 30-year horizon, the ‘average’ return is still quite useless. You might end up with $45,000 or $250,000.
And what if we take it all the way out to 4 decades? Might we finally see some consistency? Unfortunately, no. ‘The plan’ said you’d end up with a quarter of a million in today’s dollars by investing $100 a month for 40 years. You might get that. You could also end up with double that amount. Or half. Because average returns aren’t that useful.
Even these scenarios are oversimplified, because people don’t invest the same amount each month or each year. Most of us are able to invest more the older we get. And that will lead to an even wider distribution of outcomes. It’s the big moves that come near the end of the investment horizon that have the largest positive or negative impact on actual outcomes.
I’m not here to bash passive investing. It’s still the best approach for a lot of people – especially the ones that would otherwise succumb to the worst of their behavioral flaws. Remember, plenty of investors underperformed even those negative outcomes above. But let’s not pretend that investing is a one stop shop, where the same strategy can work in any environment. It just isn’t that easy.
And stop treating ‘average returns’ as gospel. They don’t come close to adequately describing history.
Whether we like it or not, we’re all playing a game of market timing. You can blindly hope that you were born at the right time, or you can take the future in your own hands. Only you know which path is the right one.
As for me, I’ll keep my focus on looking for profitable trends and managing risk. Even if I can’t match the best of index returns, perhaps I can limit the swings and have a higher degree of certainty about my financial future.
The post The Myth of the ‘Average’ Return first appeared on Grindstone Intelligence.


