The Stock Market Got Overbought. What Happens Next?
Stocks here in the U.S. are on pace for one of their best years ever. After a rough time for investors in 2022, the hot start is a welcome sight. The only question is, how long can it last?
Last week, a popular momentum indicator rose into ‘overbought’ territory for the S&P 500, causing many bearishly-inclined forecasters to sound the alarm. I can’t really blame them – the word overbought certainly sounds bad. But what does an overbought RSI actually mean?
The RSI, or relative strength index, is a momentum measure created by J. Welles Wilder Jr. and unveiled in his 1978 book, New Concepts in Technical Trading Systems. In short, it’s an oscillator ranging from 0 to 100 that tracks the speed and magnitude of a security’s recent price changes. You’ll see me regularly use a 14-period RSI on charts in these publications, most commonly to point out divergences between the directions of momentum and price.
A more common interpretation of RSI, though, is to look not at the RSI’s direction, but at its level: a reading greater than 70 is called ‘overbought’, signaling prices may be primed for a pullback. A reading below 30, on the other hand, is called ‘oversold’, and hints at a possible bounce.
This interpretation has a mixed historical record for timing reversals – overbought readings can get even more overbought, and vice versa. In fact, when we compared the level of RSI to the future performance of major stock indexes, we found the two had a correlation of roughly zero. Even when excluding the ‘middles’ of the oscillator and focusing only on returns that follow overbought or oversold readings, we were met with inconclusive results.
The S&P 500 shows the strongest 1-week and 1-month forward returns after oversold readings, but overbought levels result in the best returns over 3-month, 6-month, and 1-year periods. That data supports a narrative that overbought readings indicate both that a near-term pullback is at hand, but also that a strong, longer-term uptrend is in place (and vice versa for oversold readings).
The only problem is, data from the NASDAQ Composite says the exact opposite. Its best 1-week and 1-month returns follow overbought readings for the RSI, while oversold periods have been the best time to buy for 6-month and 1-year time horizons.
No, the level of RSI isn’t too useful when it comes to predicting the direction of future returns. But it does provide valuable information about the dispersion of future returns.
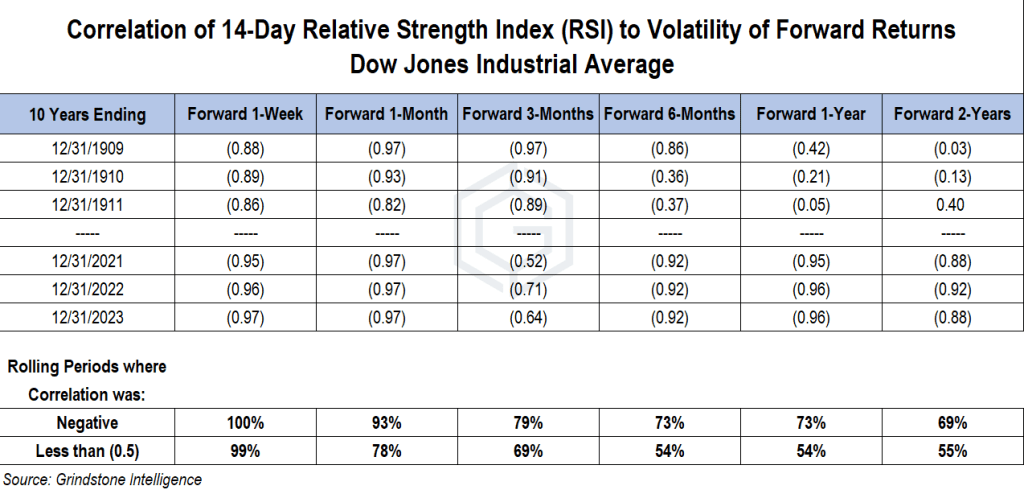
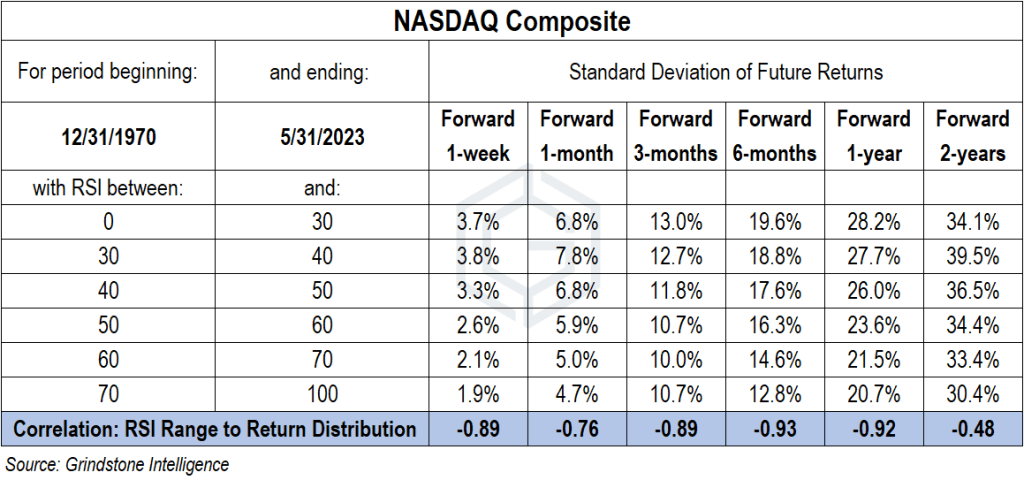
Thanks to Charlie Dow, daily prices for his trademark Industrial Average are available as far back as the late 1800s. A review of that data shows that RSI exhibits a strong negative correlation with the standard deviation of future return distributions. The distribution of forward returns is widest following oversold levels, and most narrow when RSI is the highest. That’s true for all future time horizons, be it 1 week, 3 months, or a year.
Here’s another way to visualize the relationship. We plotted forward 3-month returns following each overbought or oversold reading for the RSI and compared the two. The distribution curve for Overbought readings is narrow and steep. On the other hand, the ‘fat tails’ of the distribution curve are dominated by the Oversold category. A greater number of both great and terrible returns follow oversold conditions.
What’s striking about the data is not only the strong relationship, but also the consistency. No indicator is perfect, and even widely used factors fall out of favor for extended periods. This relationship, though, was quite consistent over rolling 10-year periods since 1900, especially over 1-week and 1-month horizons. And while RSI’s predictive value for dispersion clearly declines with time, it still offers insights into returns as far as 2 years in the future.
Moreover, this relationship doesn’t apply to just the Dow Jones Industrial Average. It holds for the S&P 500 and NASDAQ Composite, too. Here’s how those two stack up:
So while momentum is at extremes for some of the major indexes today, don’t fret. We can’t ever know for sure the future direction of prices, but overbought conditions tend to be followed by the most consistently positive returns we can ask for.
The post The Stock Market Got Overbought. What Happens Next? first appeared on Grindstone Intelligence.


