The Top Charts from Communication Services
The Communication Services sector went from being the worst sector in 2022 to one of the best in 2023. Now it’s beginning to fall back out of favor.
Relative to its benchmark, the S&P 500 index, the sector made it all the way back up to its mid-2018 lows. That’s also where its underperformance accelerated last spring and where it was rejected on a summer rally. That area is acting as resistance once again.
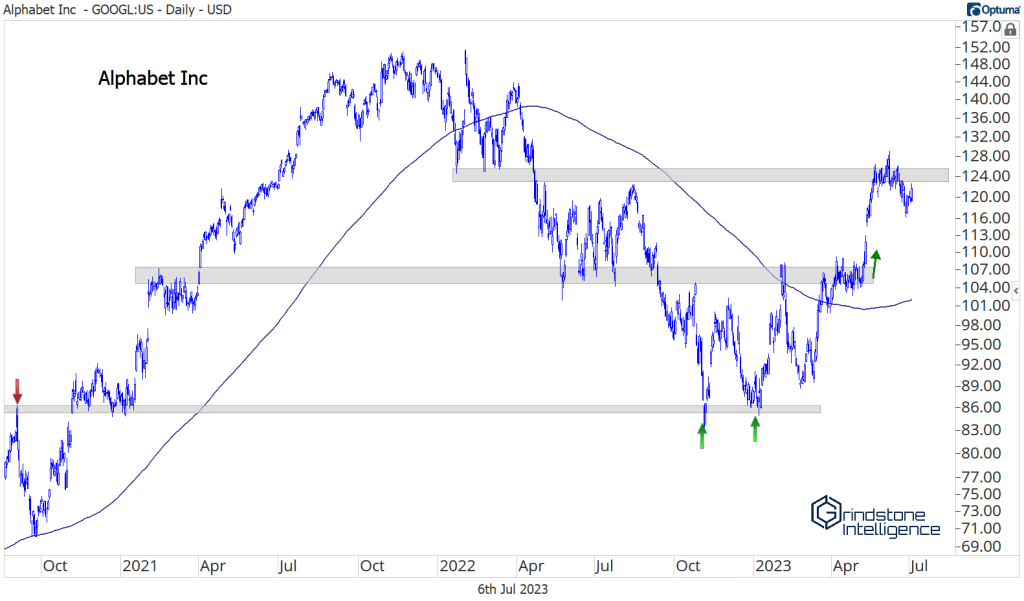
We hit that relative resistance at the same time as several of the biggest stocks in group ran into key levels of their own. Alphabet had quite the run in May, but it couldn’t get past the early 2022 lows, an area that was stiff resistance last summer. A consolidation below resistance doesn’t mean that the rise in Alphabet has come to an end. The stock is still in an uptrend. But until it can get past this important level, there are better places for us to put our money.
The same goes Meta. It finally closed the gap from the nasty 2022 breakdown, and now it’s due for a pullback. We’re not big on selling names short when they’re in clear uptrends, but we see little reason to be buying Meta here, stuck below such an important level.
The stock is at a big potential resistance level on a relative basis, too. Meta could absolutely blow past these key levels – the strongest stocks often do – but we view that as the lower likelihood outcome. Consolidation near here would be healthy.
Netflix is one that could keep going. It’s not as large as GOOGL or META, but it’s above a key former resistance level after a few months of consolidation. We like the risk-reward setup here, and we can be long with a target of $580 as long as this one is above $400.
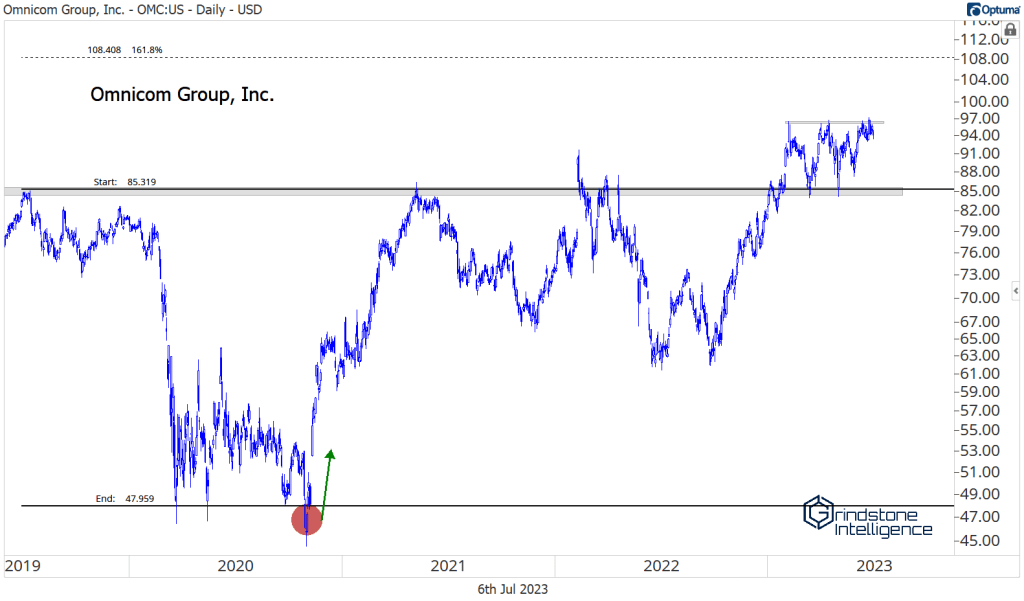
We’re seeing constructive action in advertisers, too. Omnicom was one of the first to break out earlier this year, and it’s been consolidating above major support for almost 6 months. We think it’s gearing up for a move toward the 161.8% retracement level from the COVID collapse, which is up at $108. But we want to see it get past $97 first.
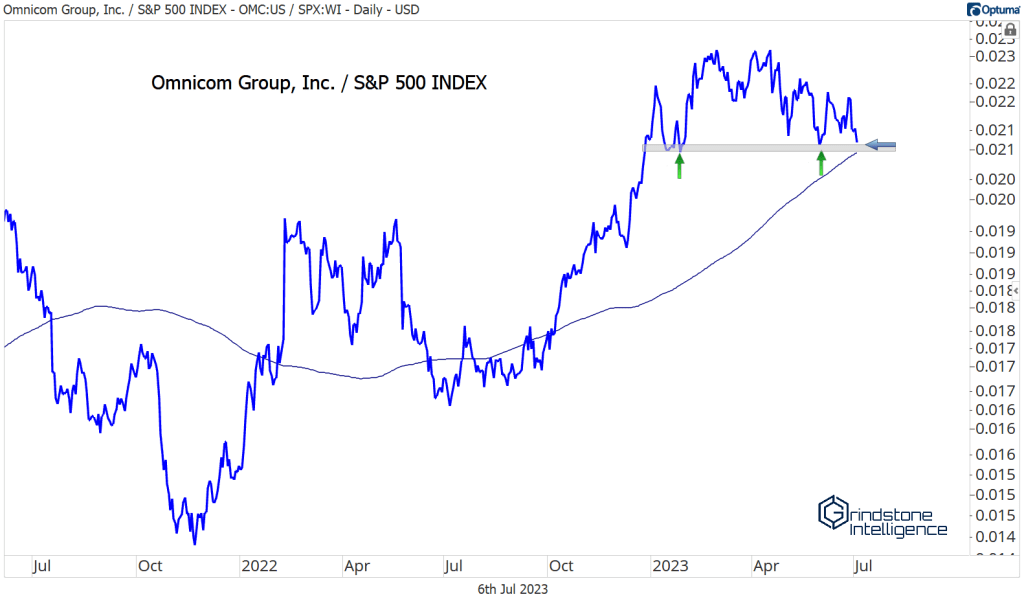
Just as important for OMC is how it responds to potential support on a relative basis. One thing we love is a stock that show strength on both an absolute basis and when compared to the benchmark. Omnicom, in a multi-year uptrend vs. the S&P 500, fits the bill. But if we see a breakdown in the chart below, we’ll have a lot less confidence in owning them. It won’t necessarily mean that OMC is falling outright. But it would be a sign that we should focus our attention elsewhere.
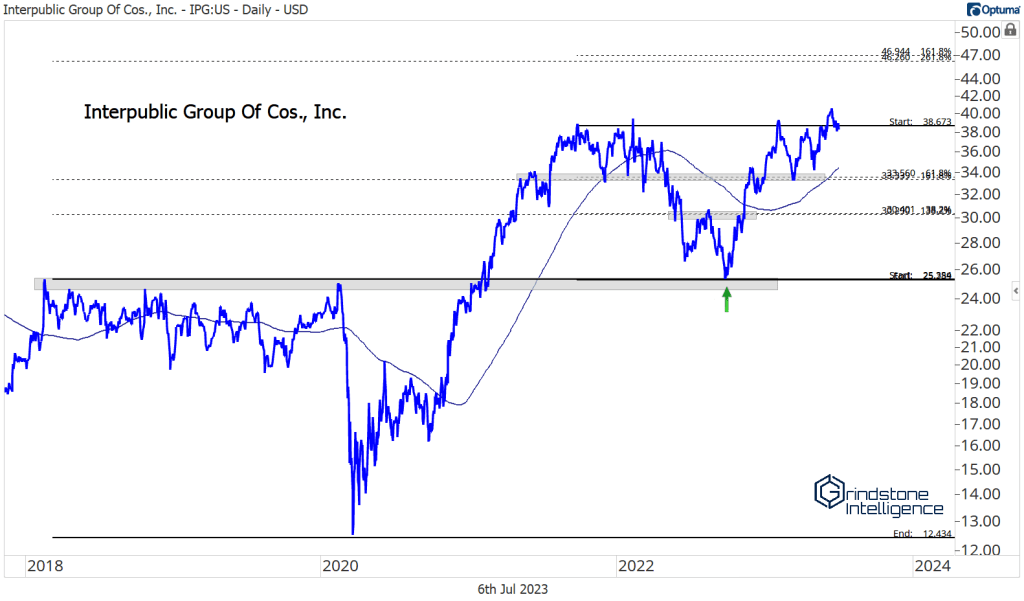
Similarly, we want to be buying their peer, Interpublic Group, on a breakout above $39, with a target of $46. That $46 level represent a cluster of key retracements from the last two major declines for the stock. Like OMC, though, we don’t want to waste our time owning this one if it’s stuck below resistance. The opportunity cost is too high.
One question we have about the sector is whether the weakest names will step to the front line if the generals start to fall.
Dish Network (which we’ve quite enjoyed making fun of) is trying once again to find a bottom. Will this one finally be the real deal? Or is this another iteration of the breakdown, consolidate, rinse, repeat pattern that been in place the past few years?
Charter Communications, has taken the first steps toward ending its downtrend. It’s been setting higher lows since October, and recently broke the downtrend line from the 2021 highs.
Verizon, another dumpster fire, just put in a failed breakdown and broke its own downtrend line.
We aren’t looking at these charts to identify trade opportunities, but instead for information. The fact that these 3 aren’t setting more and more lows (at least not yet) is further evidence of strength in this young bull market.
If even the weakest stocks can start trending higher, what do you think the strongest ones will be doing?
The post The Top Charts from Communication Services first appeared on Grindstone Intelligence.


