The US Housing Market in 10 Charts
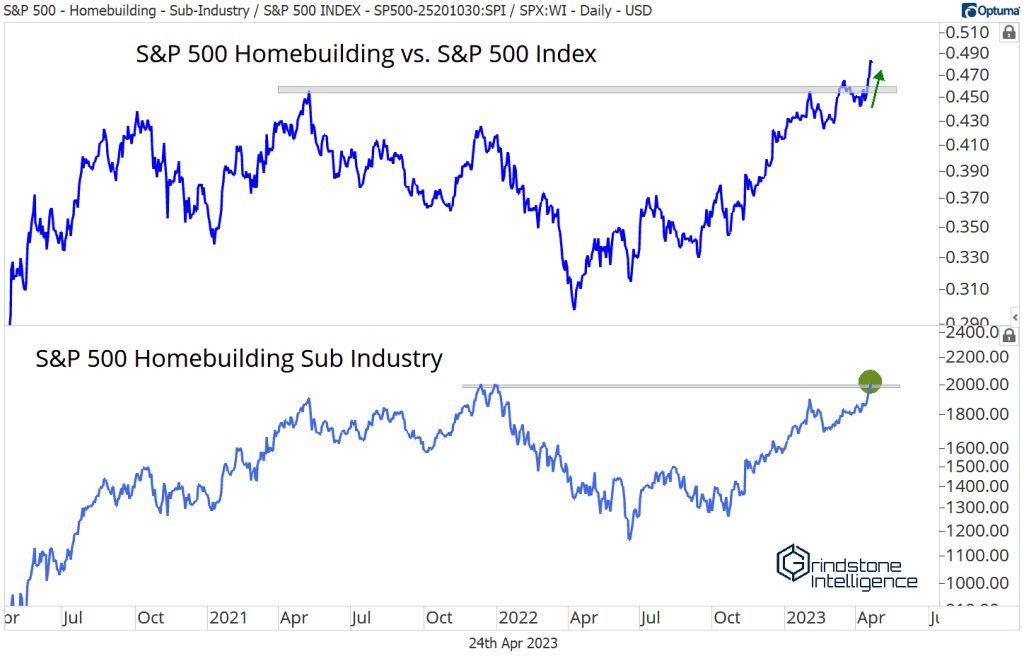
There are 120 GICS sub industries in the S&P 500 index. Only a handful are outpacing the year-to-date gain of the homebuilders.
Given the constant flow of negative sentiment surrounding the housing market these days – the predictions of imminent collapse, the mid-2000s comparisons, the affordability complaints – one would expect to see an industry in disarray.
Instead, homebuilders are breaking out to new highs on an absolute and a relative basis.
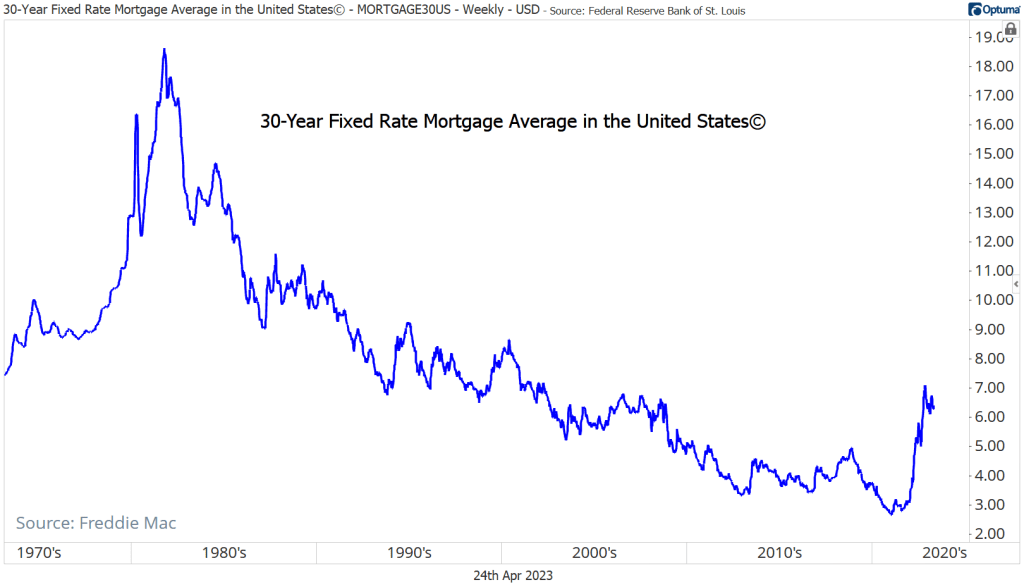
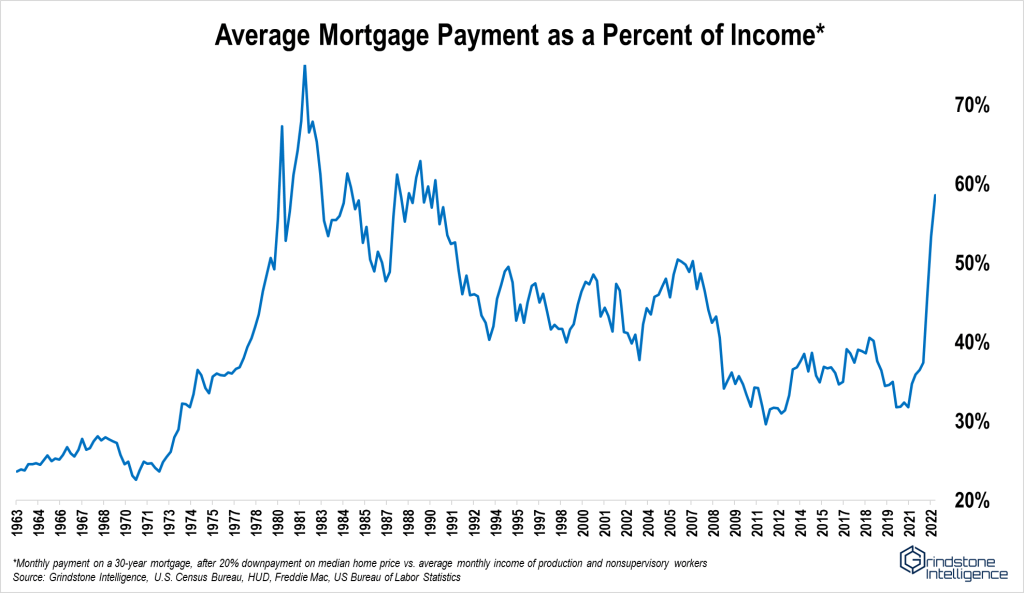
The concerns about housing are seemingly well founded. Since the Federal Reserve embarked on its fight against inflation, the average 30-year mortgage rate has climbed from less than 3% to as high as 7%. On a home with a 30-year mortgage and a 20% downpayment, that rate change shifts the monthly payment higher by more than 60%.
Somehow, that actually understates the affordability problem.
In March 2021, when the average mortgage rate was near 2.7%, the median sales price for a home in the US was under $370,000. Now, that median home costs closer to $470,000. Wages have increased over that same period, it’s true, but not by enough to cover the difference. The average monthly housing payment as a percent of income has nearly doubled in less than 24 months. By that measure, homes are more expensive than they’ve been in over 30 years – when mortgage rates were above 10%.
Affordability constraints have served to cool the surge in home prices. According to a recent article in the Wall Street Journal, home values along the west coast have fallen as much as 10%. Unfortunately for prospective home buyers, the weakness isn’t widespread. In the eastern half of the US, prices are still rising at a healthy pace. The Case-Shiller National Home Price Index has slowed from the record pace of 2021, but it’s still 3.8% higher than year-ago levels. That’s not something you’d see if the housing market was collapsing.
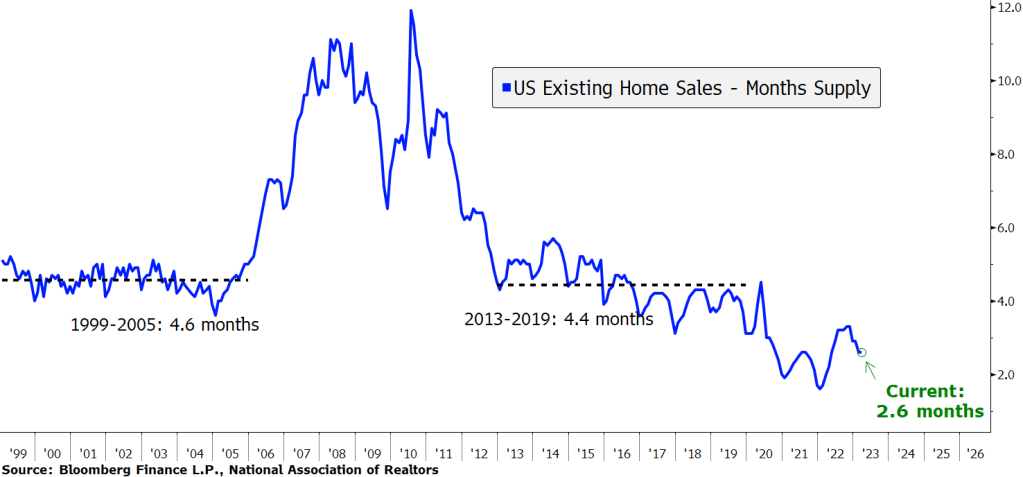
How can home prices be so resilient in the face of cost-constrained demand? Perhaps it’s the severe lack of available homes.
In healthy environments of years past, the months supply of existing homes available for sale averaged about four-and-a-half months. During the post-COVID housing boom, surging demand and supply chain disruptions drove that measure of supply to record lows. Demand may have cooled since then, but inventories haven’t recovered – there’s still only 2.6 months of supply available.
There’s good reason to believe the supply of existing homes for sales won’t improve any time soon, either. Millions of homeowners locked in ultra-low mortgage rates through pandemic-era refinances or recent relocations. It’s difficult for them to move if their new monthly home payment will be double or even triple their current rate.
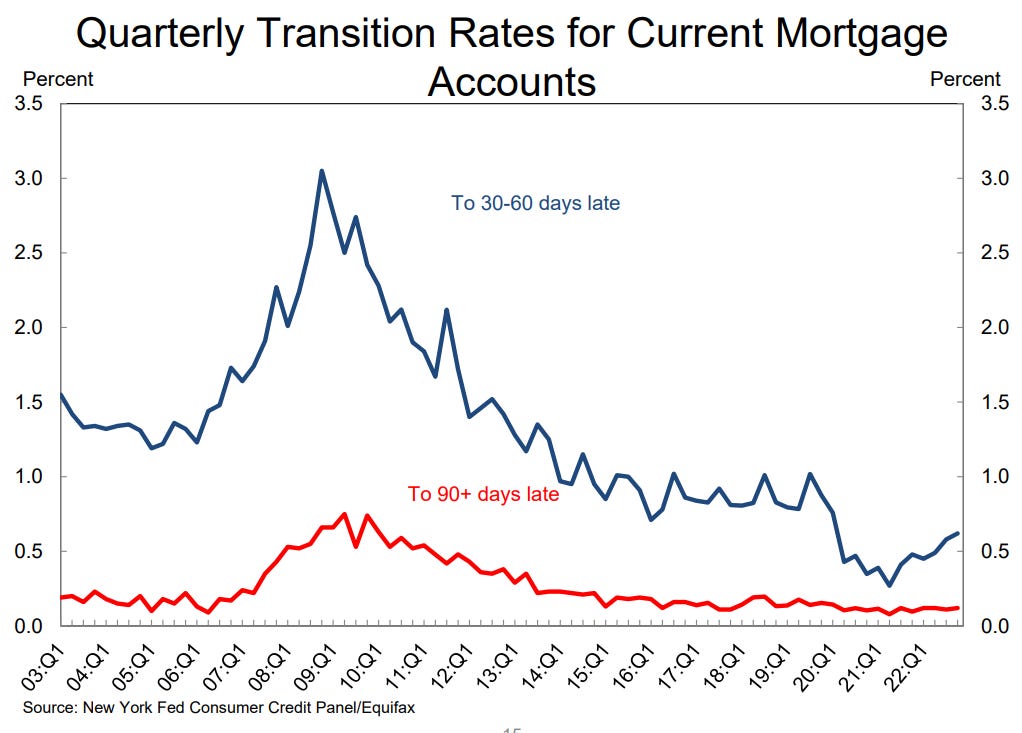
What about forced supply from foreclosures? Don’t count on that either. Delinquency rates on mortgages haven’t shown signs of material stress. Even after pandemic-era mortgage assistance measures began to expire, the percent of mortgage accounts that are 30-60 days late has stayed below any level seen from 2003-2019.
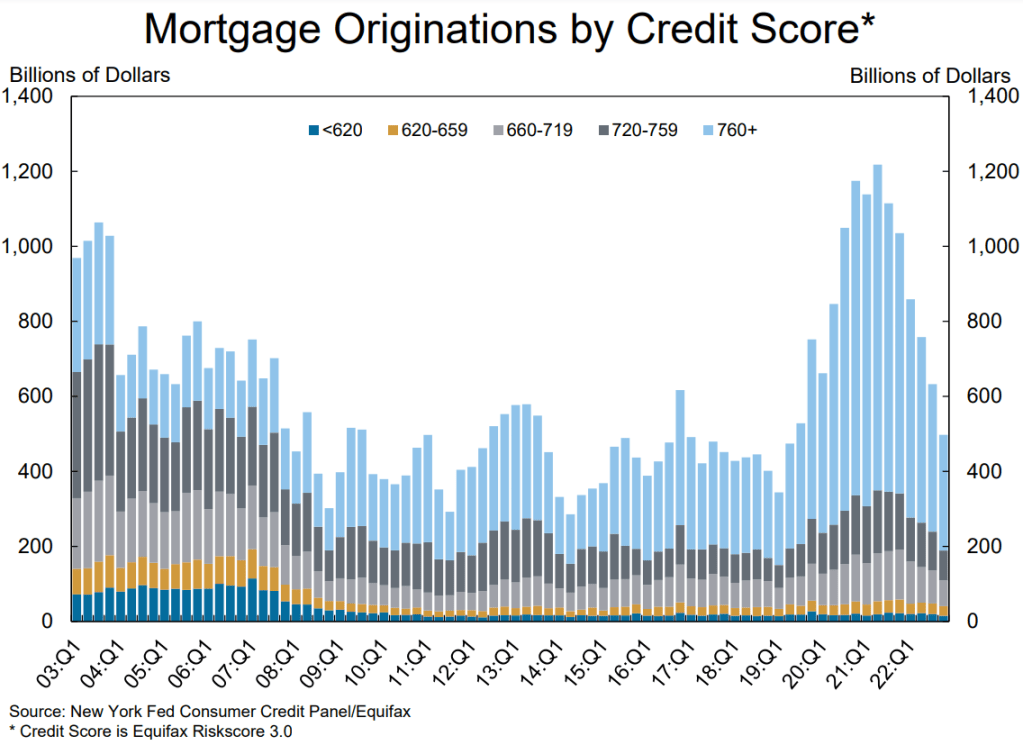
Even in an extended downturn, it’s unlikely we’ll see delinquencies mirror the increase seen in the Great Financial Crisis. For one, household mortgage debt as a percent of household real estate value is at the healthiest level since the 1960s. Moreover, homebuyers are in better financial shape than they were in the early 2000s. Most mortgage originations go to borrowers with credit scores of 760 or higher.
Given all that, we shouldn’t expect our inventory problem to be solved by homes being sold for financial reasons.
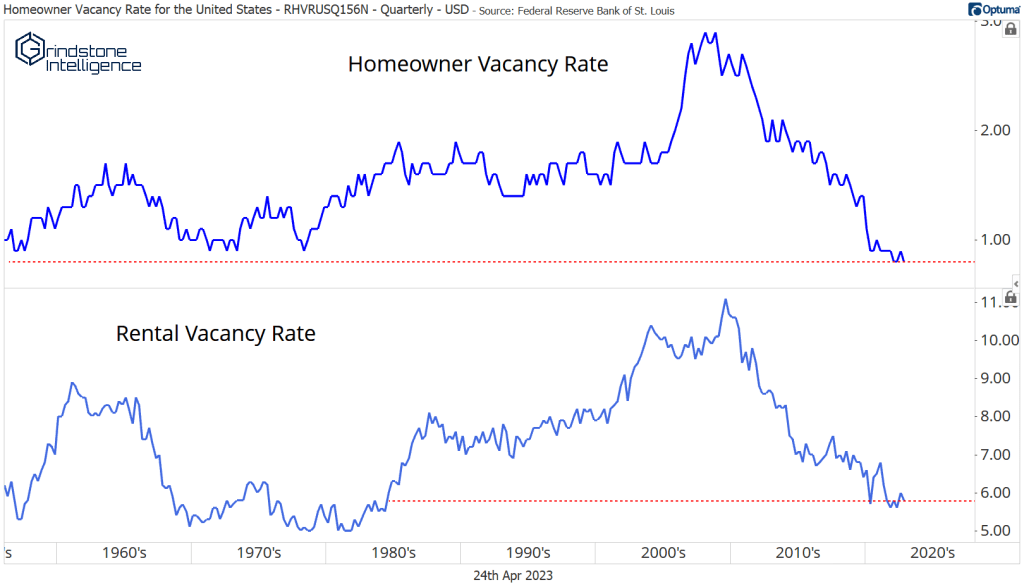
What about homes being ‘hoarded’? That won’t solve it either. Vacancy rates (the percentage of all vacant houses including second homes and seasonal units) have been declining for more than a decade. Of homes that are available for sale or for rent, vacancy rates are as low as they’ve been in decades.
There’s no easy solution to the lack of existing homes available for sale, so what about the inventory of new homes?
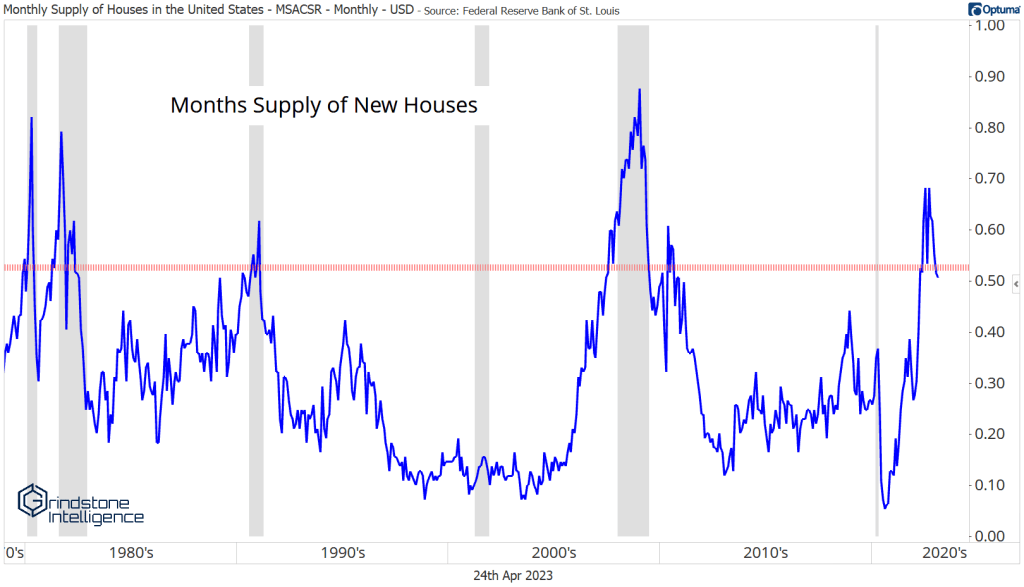
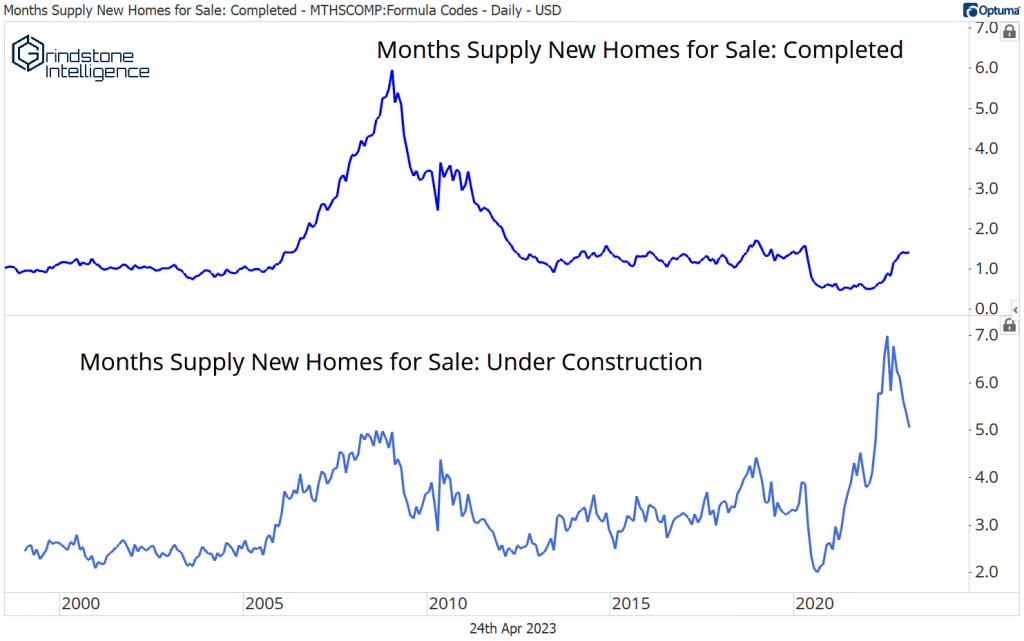
At first glance, it would seem that new home supplies are plentiful. In fact, the months supply of new houses was just at 13-year highs, and at levels that historically would be consistent with economic recession. The housing market doesn’t look so tight now, does it?
It’s just an illusion, though.
The inventory of completed homes for sale hasn’t changed at all. The expansion was entirely due to a rise in the number of new homes under construction.
Please leave this field empty
See which charts are catching our eye each week when you subscribe. It's FREE
Email Address *
Check your inbox or spam folder to confirm your subscription.
During 2021 and 2022, publicly traded homebuilders were taking in a record number of orders at record prices and record gross margins. But they couldn’t keep up. Cycle times – the time it takes to complete a home after breaking ground – extended by several months, because they couldn’t get the necessary materials, equipment, or appliances to finish and deliver homes.
What did the publicly traded builders do? They intentionally slowed the pace of sales. They stopped making homes available for sale until they were at or near completion, as opposed to when the lot was available. They stopped giving incentives altogether. They stopped taking new orders. Since then, the inventory of new homes under construction has begun to normalize, and completed inventory hasn’t expanded materially.
Build times have started to improve in recent months, though, according to industry executives. That’s a good sign for homebuyers, if it means builders can complete and deliver new homes. Unfortunately, the housing shortage can’t be solved overnight.
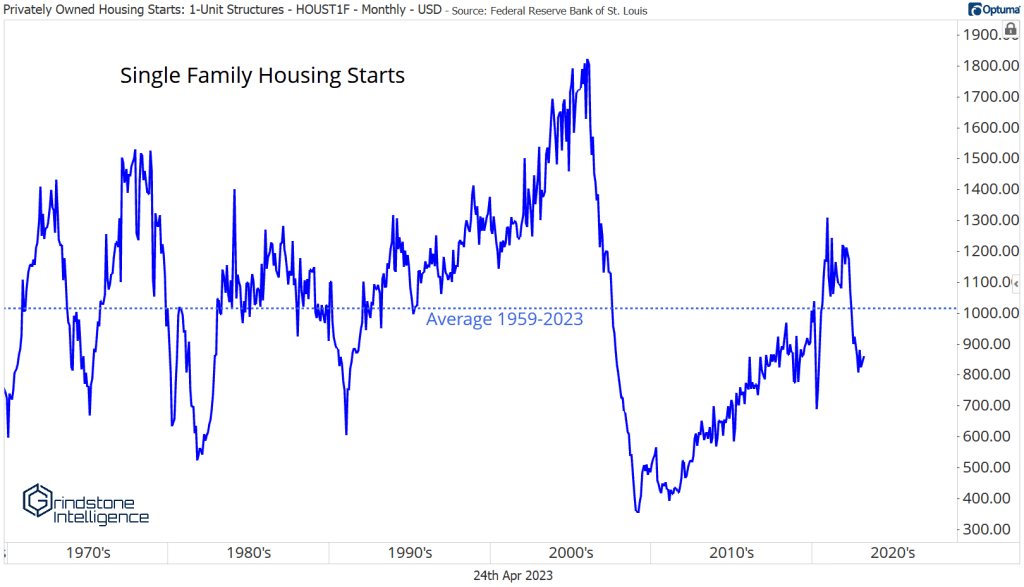
The root of the problem is that we underbuilt new homes in the US for more than a decade. From 2007 to 2019, and again now in 2023, single family housing starts have been less than the 60-year average. Between population growth and tear-downs, that’s not enough to satisfy the growth in underlying demand.
When the housing bubble burst 15 years ago, the entire industry came face-to-face with financial ruin. The homebuilders and suppliers that managed to survive, rightfully scarred by the experience, vowed to take a more cautious approach to their businesses going forward.
That approach is working so far. The homebuilders are up 25% for the year.
The post The US Housing Market in 10 Charts first appeared on Grindstone Intelligence.


