

Top Charts and Trade Ideas from the Industrials Sector
Sector outlook and deep dive

The strongest of bull markets don’t care about potential areas of resistance, bearish divergences, or the targets we set. That’s the type of environment we’re in today.
A few short weeks ago, the S&P 500 Industrials sector was nearing the 161.8% retracement from the 2021-2022 decline, a perfectly logical place for sellers to step in given the strength of the rally we’d seen over the prior 4 months. Instead of finding resistance, the Industrials kept on chugging along.

The takeaway isn’t that we shouldn’t set targets or watch for signs of potential reversals - we still have to manage risk. Rather, when we see prices ignore the things that might normally cause problems, it adds to the body of evidence that tells us how much strength is behind the rally.
The strength in the Industrials is simply a reflection of the strength in the stock market overall. No sector is more highly correlated to the S&P 500 than the Industrials, a statistic exemplified by the performance since the bear market lows back in October 2022. Since then the Industrials have tracked the SPX almost perfectly.

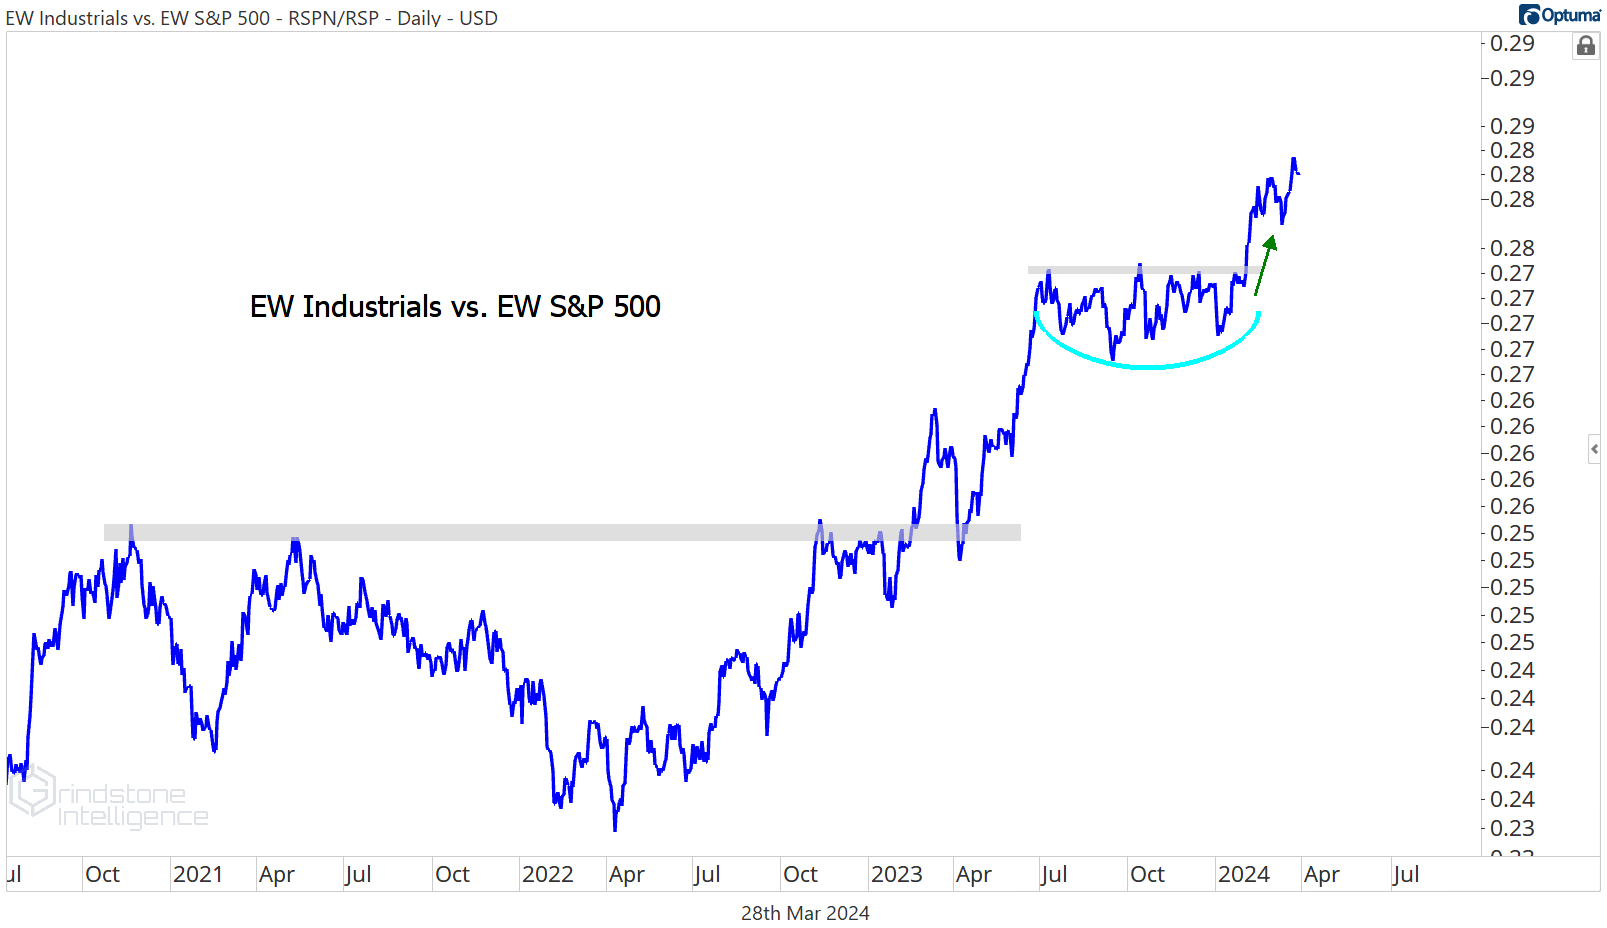
Owning the Industrials over the benchmark index hasn’t given investors much of an edge, but below the surface, it’s a different story. If you strip out the outsized influence of market cap weightings and look instead at the equally weighted versions, the Industrials are setting new highs. Ever since breaking out of a 2-year base in early 2022, this ratio has been stair-stepping steadily higher.
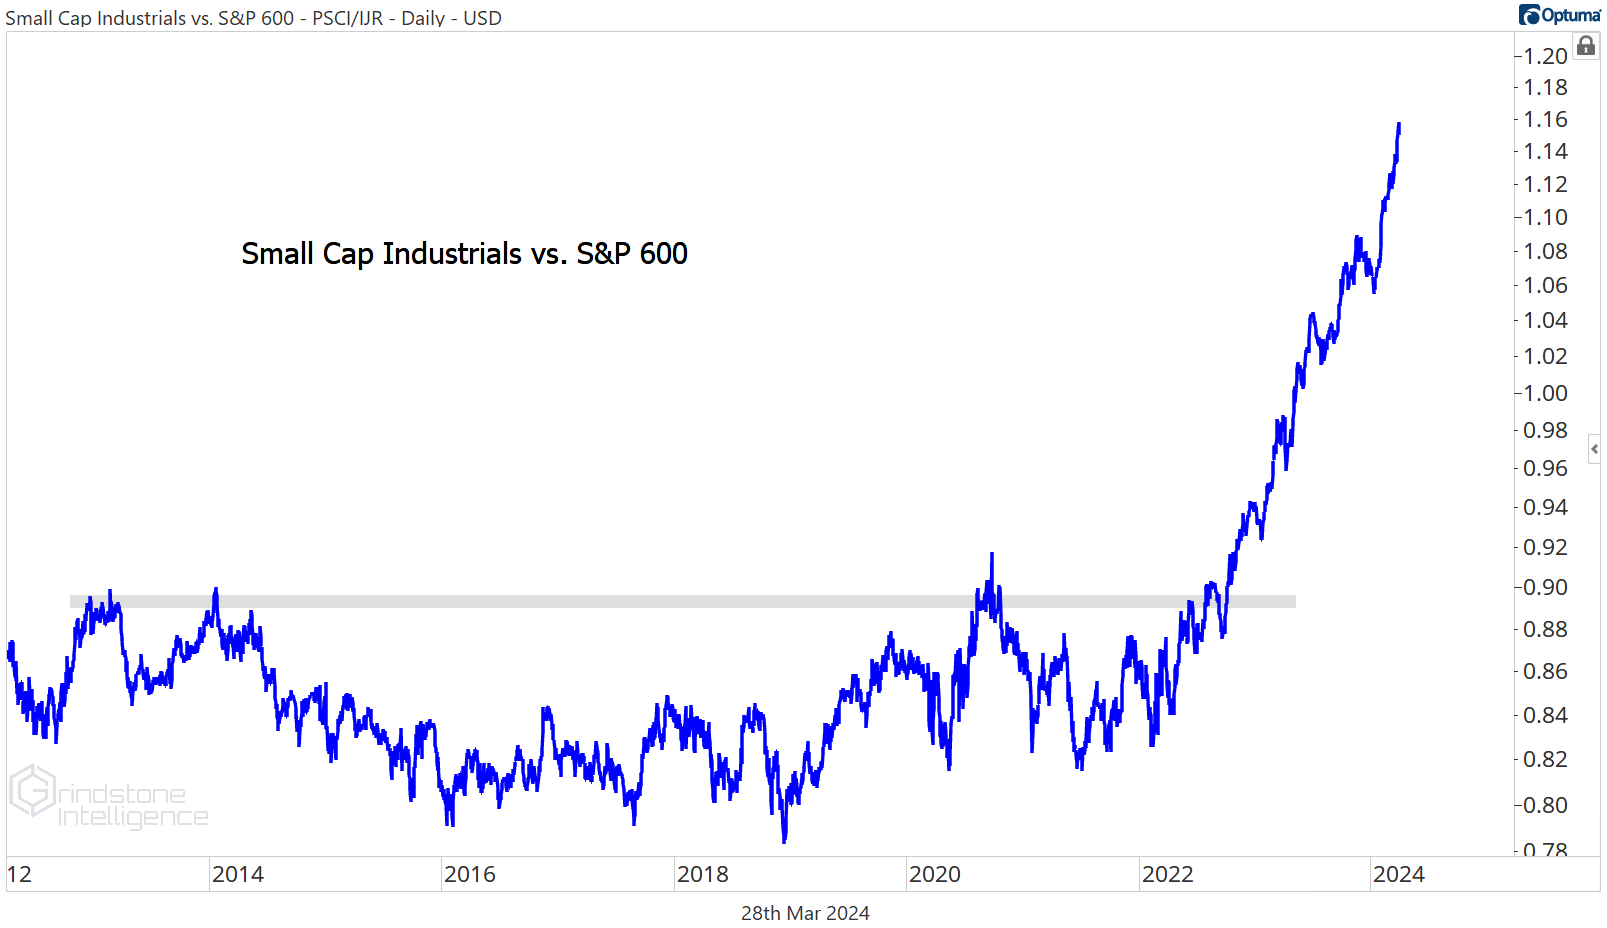
The further you dig, the better things get. Check out the ratio of the small cap Industrials relative to the S&P 600. A breakout from a 10 year base has turned into an asymptotic rise. Every time we see this chart, we have to double-check the settings to make sure we still have the y-axis set to log scale.
The small cap Industrials have been surging for awhile, but recent strength in the large cap Industrials reflects a shift out of growth stocks and into the value oriented areas of the market. Over the last 2 months, it’s been the Energy, Materials, Financials, and Industrials sectors that have led.
Whether that leadership becomes more than just a passing fad depends on this chart.

If this turns into a failed breakout for the Russell 1000 Growth Index relative to the Russell 1000 Value Index, we could be sitting here in 9 months talking about how it was the bankers and manufacturers - not the AI stocks - that dominated the market in 2024.
Digging Deeper - Industrials Sector Setups to Watch
It’s a new year, but leadership within the Industrials sector is much the same as it was in 2023. The Construction & Engineering and Trading Companies & Distributors industries are jostling for the top spot on the performance derby.

Right now it’s the Trading Companies and Distributors out front. Grainger has been a leader in that space for a long time now, and relative to the S&P 500, it’s at all-time highs. It took more than a decade to surpass the former peak, so if you think GWW has gone too far, too fast, think again. From big bases come big resolutions.

Just like for the sector overall, GWW largely ignored potential resistance at the 685.4% Fibonacci retracement near $970. Now that it’s above that level, we can use it to manage risk on new entries. Our next target long-term target is at $1470.

Fastenal is in the same boat, just on a smaller scale. It broke out of a 3 year base relative to the rest of the market earlier this year.
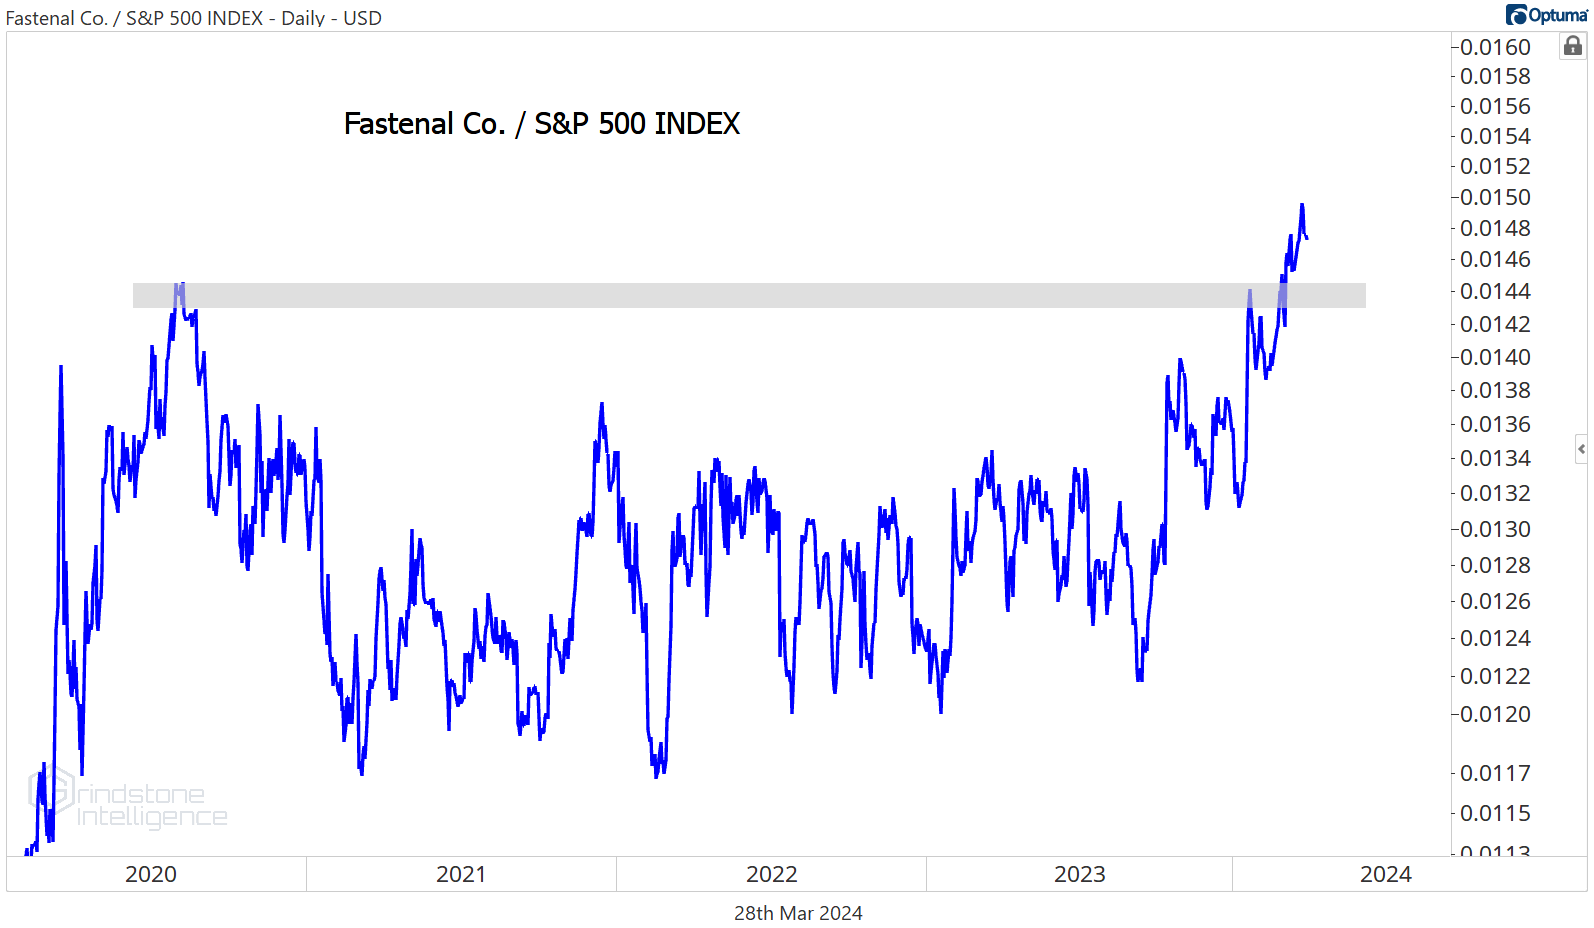
If a broad pullback comes, we want to take advantage by buying FAST closer to its $61 breakout level with a target of $85.

Leaders

Just three S&P 500 stocks have been stronger that General Electric in 2024, and one barely counts since it was just added to the index. GE’s up 41% for the year, and 15.75% over the last 4 weeks. That’s the result of a stock that just reversed a multi-year relative downtrend and is now setting 5 year highs vs. the S&P 500.

Our former target on GE was $145, and in what’s become a recurring theme in this market, the stock blew right past that level. We have to zoom out and approach the stock from a new perspective. The 2007-2009 decline is what we’ll use to manage risk from here, with the key level being the 61.8% retracement at $170. If GE is above that, we like it long with a target of $250.

Hubbell has been another big winner, and we love the relative strength we’re seeing in the stock relative to the rest of the market. It just broke to new all-time highs.

HUBB is trading above $378, which is the 423.6% retracement from the 2020 decline. As long as it continues to hold that level, we think it goes to $560.

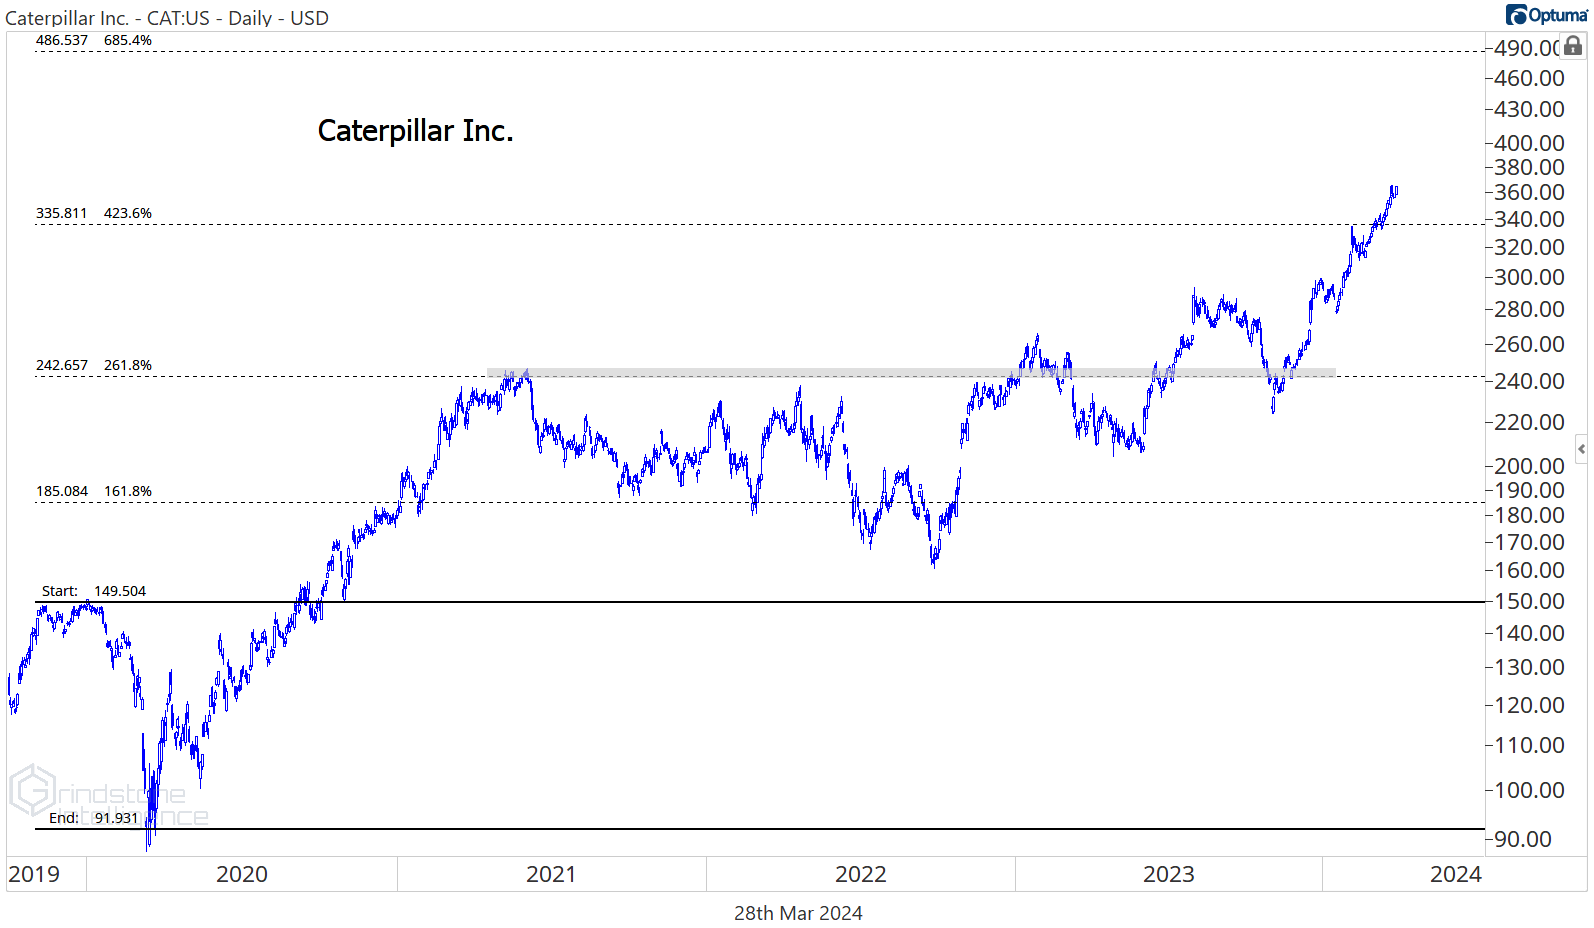
The same goes for Caterpillar. It just surged to its highest level relative to the rest of the market in more than a decade.
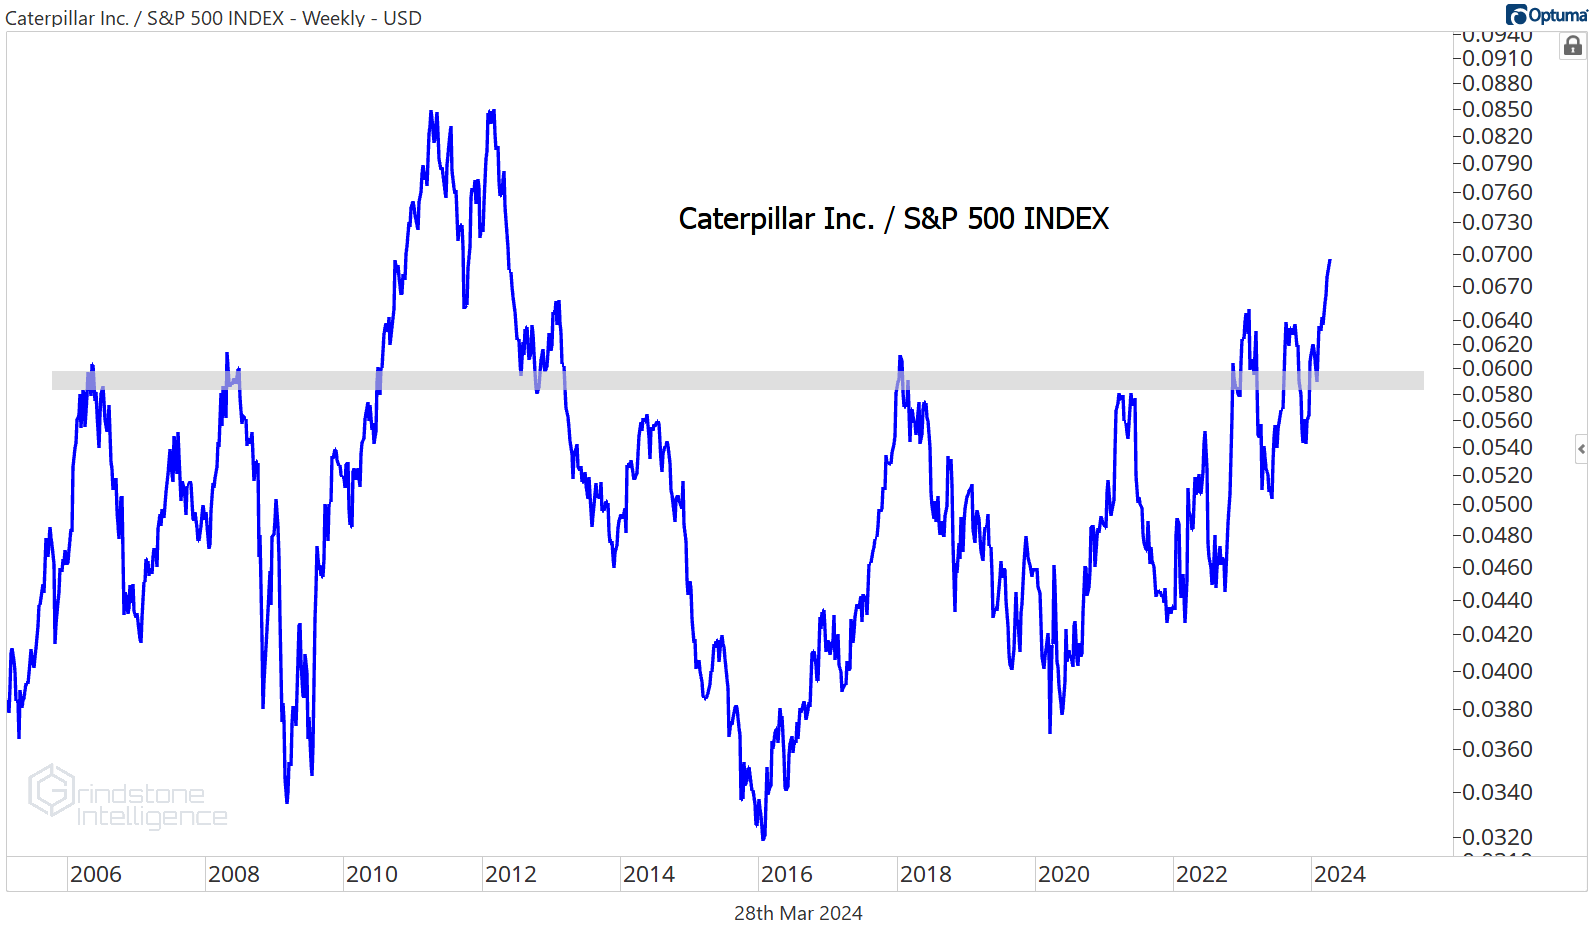
Our level to watch is $335. With CAT trading above that, we want to be buying it with a target of $485.
Now, we don’t want to buy every stock that shows up on the biggest winners list. MMM is still mired in a nasty relative downtrend.

There’s no reason to be involved with this name unless and until it shows evidence of a longer-term reversal.
Losers

Most of the stocks on the 4 week losers list are there for a reason. We don’t see a reason to be involved with any of them. There’s nothing wrong with keeping an eye on names like JB Hunt as they consolidate within a longer-term uptrend. But for now, the stock is stuck below overhead supply.

And the opportunity of waiting for a potential breakout is high during bull markets. JBHT just fell to multi-year lows against the S&P 500.

More stocks to watch
There are a lot of great setups out there these days, and since it’s a bull market, those great setups will probably resolve higher. But we don’t have the capacity to buy every great setup we see. Instead, we want to focus our attention on the ones showing relative strength and offering the best risk/reward opportunity.
Cintas is a picture of relative strength. Compare CTAS to the S&P 500 and it’s been breakout, uptrend, consolidation, rinse, repeat.

Cintas was consolidating above our former target of $625, then it gapped higher after earnings. If it gives back any of the gain following that breakaway gap, we want to take advantage of the pullback and buy it with a target of $790.

United Rentals is setting new highs vs. the rest of the market and on an absolute basis. We like the setup here as it consolidates above the 261.8% retracement from the 2021-2022 decline. With that as our risk level, we can target $900.

UBER has been a big winner this year, but all that strength has only brough it back to the relative highs it set just after the IPO in 2019. We’re on hold here until we see the relative breakout.

If we get one, UBER could go a lot higher. Right now it’s consolidating midway between the 2021 highs and the 161.8% retracement from the most recent bear market decline. We think the risk profile improves a lot on a move above $91. From there, we’d set an initial target of $135.

Trane continues to move higher after a brief consolidation above our former target of $268. We continue to like it long above that level with a target of $390.

Do you like big breakouts? I can’t think of many that are bigger than this one. Quanta Services just came out of a 20+ year base relative to the S&P 500. It’s gone nowhere for 20 years.
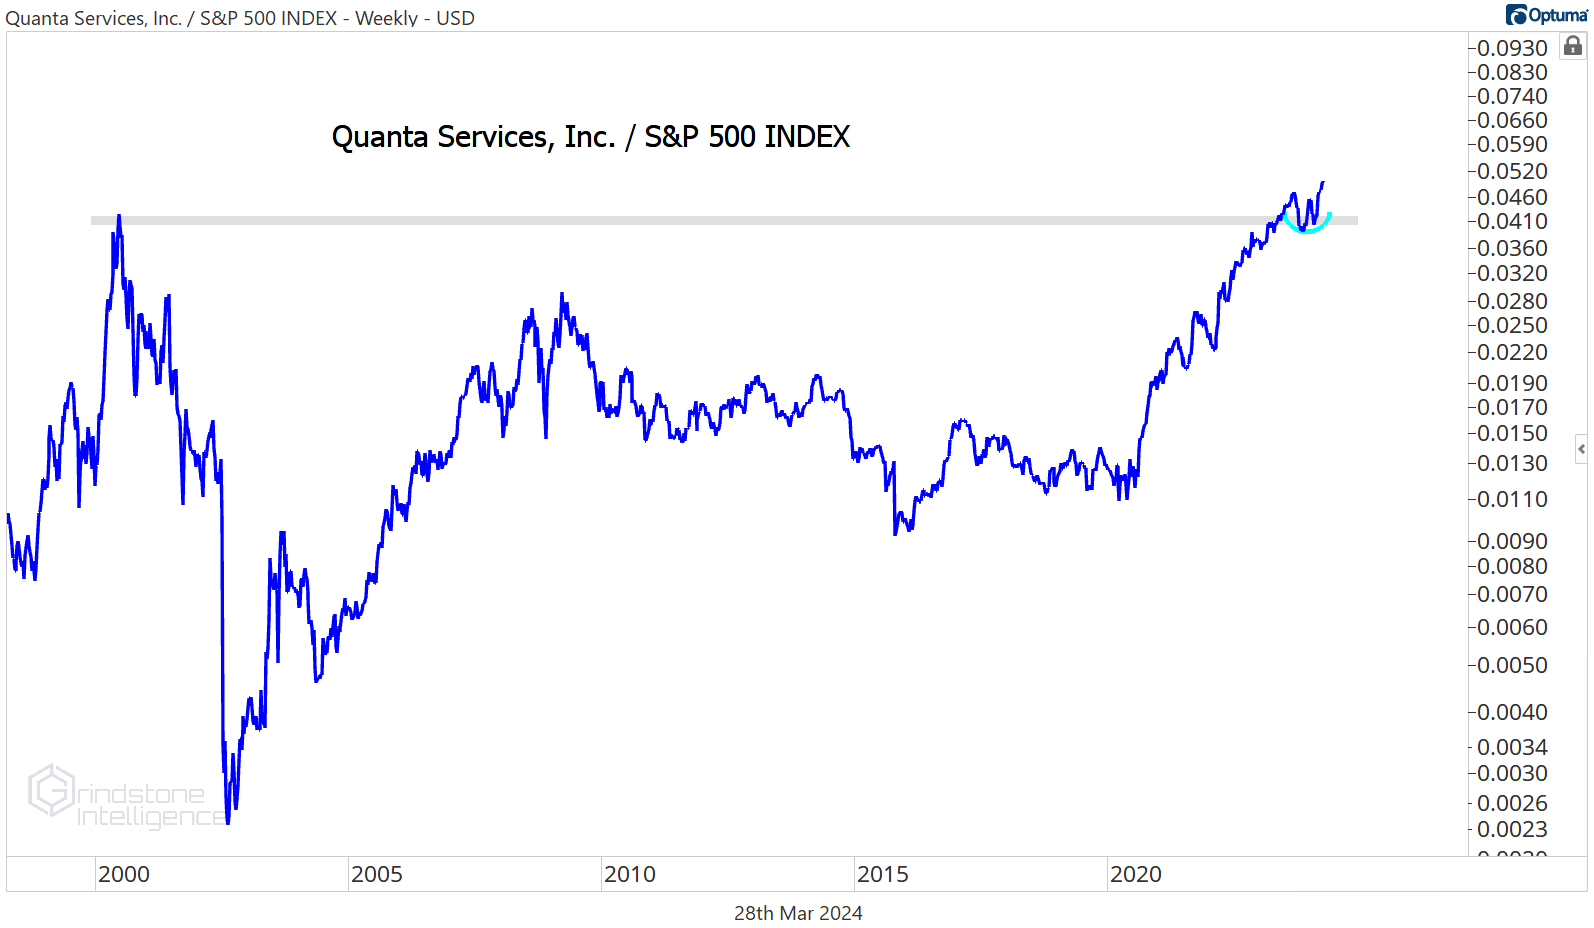
The stock on an absolute basis has gone nearly straight up over the last few years, though, and that’s made it difficult to find levels to manage risk against. Last fall’s selloff gave us something to work with. We can own PWR above $245 with a target of $300.

This breakout in Howmet Aerospace was almost as big as the one in PWR, but HWM just hit our target of $70. Don’t count it out completely - we’ve seen what all those other stocks have thought about the targets we set - but we’d like to see it get above that level and hold it before initiating any new positions.

Builders Firstsource continues to be a monster. I don’t need to draw on this chart or wrap words around it. It speaks for itself.

The risk/reward in BLDR is cleaner than a lot of the other setups out there right now, too, as it consolidates just above the 423.6% retracement from the 2022 decline. We do want to be a little wary of that potential bearish momentum divergence over the last few weeks, but as long as we’re managing risk accordingly, that shouldn’t keep us from getting involved. We like it above $200 with a target of $300.

Here are 2 other great setups. Both Carrier and Old Dominion are in long-term relative uptrends, but they’ve struggled a bit over the last year. Eventually, we should expect consolidations within long-term relative uptrends to resolve higher, so we want to take advantage of the pullbacks. For Carrier, we want to buy a breakout from this cup and handle pattern with a target of $74.

The level on Old Dominion is $445. If it’s above that, we think ODFL goes to $570.

That’s all for today. Until next time.