Our job is to find trends, with the belief that trends are more likely to persist than reverse course.
One of the easiest ways to identify those trends is to look at a stock’s current price and compare it to the level and direction of a moving average of trailing prices. If the current price is above a rising moving average (MA), then prices are in an uptrend. Below a falling MA, a downtrend. Pretty simple, right?
Things are a little more difficult when you get mixed signals: the level says one thing, but the MA trend says another. What if price is above a falling MA? That’s a key first step toward a new uptrend, but it doesn’t always mean prices have bottomed. The same logic holds for a price that’s below a rising MA.
So what do you call it when prices are directly on top of a flat moving average? In this case, we call it Consumer Staples.
The sector is stuck within the middle of a multi-year range and without a trend - there’s simply not much to see.
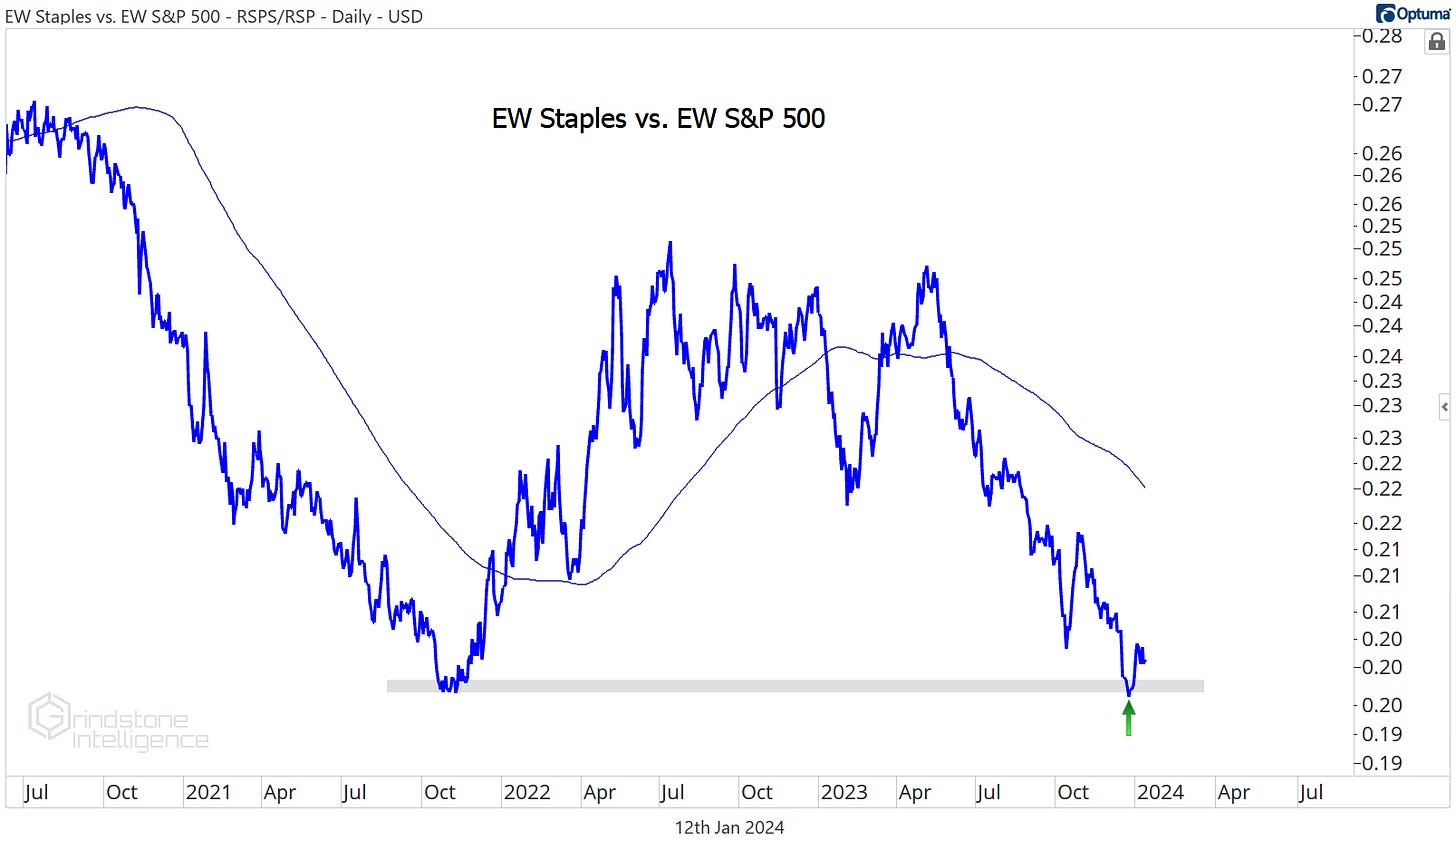
That is, unless you compare them to the rest of the S&P 500. On a relative basis, the Staples are pretty interesting, as they work on confirming a bullish momentum divergence following a failed breakdown at the 2021 lows. That could spark a mean reversion of outperformance by the Staples.
We’re seeing the same bounce even when we strip out the impact of market cap skew - the equally weighted Staples are finding support vs. the equally weighted S&P 500 at those same 2021 lows.
The most interesting part is when it’s happening. January is supposed to be the worst month of the year for the Consumer Staples sector. In Januarys since 1990, the Staples have underperformed 68% of the time and by an average of 1.3%. So far this year? The Staples are leading by 0.6%.
If the Staples are outperforming in what’s supposed to be the worst month of the year, what’s that say about the underlying strength in the sector? This is a group worth paying attention to.
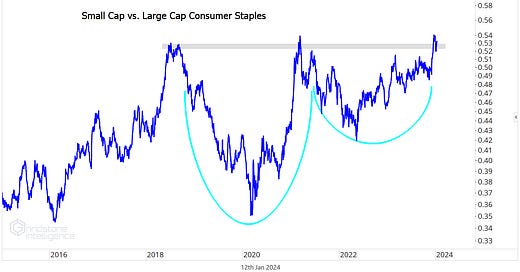
Especially the small cap variant. The small cap Consumer Staples sector is threatening to break out of a huge, 5-year cup-and-handle base relative to the large cap sector. The bigger the base, the bigger the resolution.
The PowerShares SmallCap Consumer Staples ETF is already breaking out to new highs. We think it will go to $40.50, which is the 161.8% retracement from the 2021-2023 range.
There are more opportunities beneath the surface.
Digging Deeper
More than half of the Consumer Staples sub-industries have fallen over the past year. That’s pretty shocking when you consider that the total S&P 500 has risen 20% over that timeframe.
Packaged Foods & Meats have been among the worst, falling 10% over the last 12 months. That’s pushed the group back toward the relative lows set in late-2021, right before the 2022 bear market began.
Tyson was among the worst offenders within the sub-industry: when compared to the S&P 500, they fell all the way back to lows not seen since 2012. If buyers were ever going to step in, this is a pretty logical place to do it. Especially with momentum putting in a bullish divergence at that most recent low.
We want to see confirmation of the downtrend reversal before getting long this name, and that will come if TSN is above $57. We want to be long only if it’s above that level, with a target near $70.
Leaders
Constellation Brands was the best-performing Consumer Staples stock over the last 4 weeks, but we aren’t quite ready to jump on the bandwagon. First, we want to see how it handles the top end of this 2 year trading range. $260 has been stiff resistance over that period, and the first breakout attempt failed to hold - so this area has a lot of memory. If STZ is above $260, we want to be long with a target of $290. But there’s no reason to be involved otherwise.
For COST, we had been watching the key resistance level near $575, which lines up with the 685.4% retracement from the 2018 selloff. That area has now turned into support, and we want to own the stock above that level with a target of $800.
What’s most impressive about COST is the relative strength. Not only is the stock at new highs compared to the rest of the sector, it also just broke out relative to the market overall. Coming out of this two year base, we expect more outperformance in the near future.
Costco peer Walmart is nearly as good, and it presents a better risk/reward setup right now. We can be long WMT above $152 with a target up near $200, which is the 423.6% retracement from the 2018 selloff. Also check out how momentum has stayed out of oversold territory for the last 18 months - that’s a big feather in the cap for the bulls.
Back in November we set an initial target for Monster Beverage that was hit almost immediately, and the stock has been digesting those gains ever since. Now it looks like MNST is ready for the next leg higher. We want to be long with a target of 470, which is the 261.8% retracement from the 2021-2022 trading range.
We really like the relative strength we’re seeing in the stock. Compared to the sector overall, MNST broke out above the 2021 highs in early 2023 and then successfully backtested the breakout last fall. That kept the long-term structural uptrend intact, and now Monster is threatening to set new relative highs again.
Losers
Archer Daniels has fallen 9% over the last month, and earlier this week it closed at the lowest level in almost 2 years. Support from the summer 2021 highs hasn’t completely broken yet, though. This is a level that both S&P 500 and Consumer Staples bulls want to see hold - a bunch of stocks breaking support is not consistent with a rising market.
We’ve been talking about Walgreens for a few months as a mean reversion play, and we thought it might rally all the way toward $30. The mean reversion came, but the rally didn’t have the legs that we hoped it might. This is one to leave alone while it takes time to digest these 15-year lows.
More Noteworthy Charts
We’ve been watching Hershey for a potential bottom for just over a month now. It hasn’t given us much to be excited about this year after being a big winner in 2022, but at least the stock has stopped going down. This was a logical place to do so, as it approached the Fibonacci 138.2% retracement from the 2020 decline. That’s also where prices stalled out in mid-2021.
We really like the risk/reward setup for HSY when compared to the rest of the Staples. Last year, the Hershey/Staples ratio broke out of a HUGE cup and handle base. It’s reversed sharply over the last 6 months, but now that we’re backtesting the initial breakout level, we’re watching for signs that a new leg higher is beginning. We want to be long HSY above $190 with an initial target of $215.
We’re less excited about the prospects for Dollar General. It’s possible that DG just blows right past the COVID lows - which are currently acting as stiff resistance - in an attempt to fill the gap from the summer, but we’d rather take a wait-and-see approach on the stock for now. Especially with momentum putting in a bearish divergence at the most recent peak. Remember, losers have an unfortunate tendency to keep on losing, and this stock hasn’t shown us enough evidence that the longer-term downtrend is over.
That’s all for today. Until next time.


